
An official website of the United States government
An official website of the United States government
The .gov means it's official.
Federal government websites often end in .gov or .mil. Before sharing sensitive information,
make sure you're on a federal government site.
The site is secure.
The
https:// ensures that you are connecting to the official website and that any
information you provide is encrypted and transmitted securely.
Directly supervise and coordinate work activities of cleaning personnel in hotels, hospitals, offices, and other establishments.
Employment estimate and mean wage estimates for First-Line Supervisors of Housekeeping and Janitorial Workers:
| Employment (1) | Employment RSE (3) |
Mean hourly wage |
Mean annual wage (2) |
Wage RSE (3) |
|---|---|---|---|---|
| 153,640 | 1.1 % | $ 21.68 | $ 45,100 | 0.4 % |
Percentile wage estimates for First-Line Supervisors of Housekeeping and Janitorial Workers:
| Percentile | 10% | 25% | 50% (Median) |
75% | 90% |
|---|---|---|---|---|---|
| Hourly Wage | $ 13.93 | $ 16.21 | $ 19.05 | $ 24.25 | $ 30.54 |
| Annual Wage (2) | $ 28,980 | $ 33,710 | $ 39,630 | $ 50,440 | $ 63,530 |
Industries with the highest published employment and wages for First-Line Supervisors of Housekeeping and Janitorial Workers are provided. For a list of all industries with employment in First-Line Supervisors of Housekeeping and Janitorial Workers, see the Create Customized Tables function.
Industries with the highest levels of employment in First-Line Supervisors of Housekeeping and Janitorial Workers:
| Industry | Employment (1) | Percent of industry employment | Hourly mean wage | Annual mean wage (2) |
|---|---|---|---|---|
| Services to Buildings and Dwellings | 59,990 | 2.79 | $ 21.41 | $ 44,530 |
| Traveler Accommodation | 29,270 | 2.13 | $ 19.16 | $ 39,860 |
| Elementary and Secondary Schools | 13,130 | 0.16 | $ 23.48 | $ 48,840 |
| General Medical and Surgical Hospitals | 7,290 | 0.13 | $ 24.73 | $ 51,450 |
| Nursing Care Facilities (Skilled Nursing Facilities) | 5,900 | 0.42 | $ 20.25 | $ 42,120 |
Industries with the highest concentration of employment in First-Line Supervisors of Housekeeping and Janitorial Workers:
| Industry | Employment (1) | Percent of industry employment | Hourly mean wage | Annual mean wage (2) |
|---|---|---|---|---|
| Services to Buildings and Dwellings | 59,990 | 2.79 | $ 21.41 | $ 44,530 |
| Traveler Accommodation | 29,270 | 2.13 | $ 19.16 | $ 39,860 |
| Facilities Support Services | 2,750 | 1.64 | $ 22.64 | $ 47,090 |
| Rooming and Boarding Houses | 80 | 0.84 | $ 19.62 | $ 40,800 |
| Gambling Industries | 880 | 0.48 | $ 19.96 | $ 41,510 |
Top paying industries for First-Line Supervisors of Housekeeping and Janitorial Workers:
| Industry | Employment (1) | Percent of industry employment | Hourly mean wage | Annual mean wage (2) |
|---|---|---|---|---|
| Federal Executive Branch (OEWS Designation) | 390 | 0.02 | $ 40.16 | $ 83,530 |
| Scientific Research and Development Services | 90 | 0.01 | $ 34.15 | $ 71,030 |
| Automobile Dealers | 30 | (7) | $ 31.15 | $ 64,800 |
| Chemical Manufacturing (3255 and 3256 only) | (8) | (8) | $ 30.09 | $ 62,580 |
| Sugar and Confectionery Product Manufacturing | 40 | 0.05 | $ 29.53 | $ 61,430 |
States and areas with the highest published employment, location quotients, and wages for First-Line Supervisors of Housekeeping and Janitorial Workers are provided. For a list of all areas with employment in First-Line Supervisors of Housekeeping and Janitorial Workers, see the Create Customized Tables function.
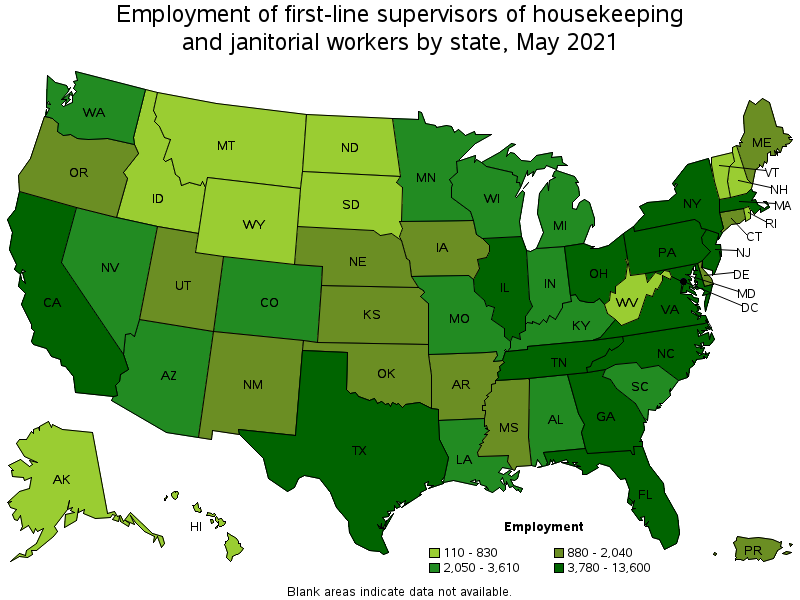
States with the highest employment level in First-Line Supervisors of Housekeeping and Janitorial Workers:
| State | Employment (1) | Employment per thousand jobs | Location quotient (9) | Hourly mean wage | Annual mean wage (2) |
|---|---|---|---|---|---|
| Texas | 13,600 | 1.11 | 1.02 | $ 19.37 | $ 40,280 |
| California | 12,390 | 0.75 | 0.69 | $ 25.45 | $ 52,930 |
| Florida | 12,240 | 1.42 | 1.30 | $ 19.74 | $ 41,060 |
| New York | 8,490 | 0.98 | 0.90 | $ 26.37 | $ 54,850 |
| Georgia | 5,910 | 1.35 | 1.24 | $ 20.10 | $ 41,810 |
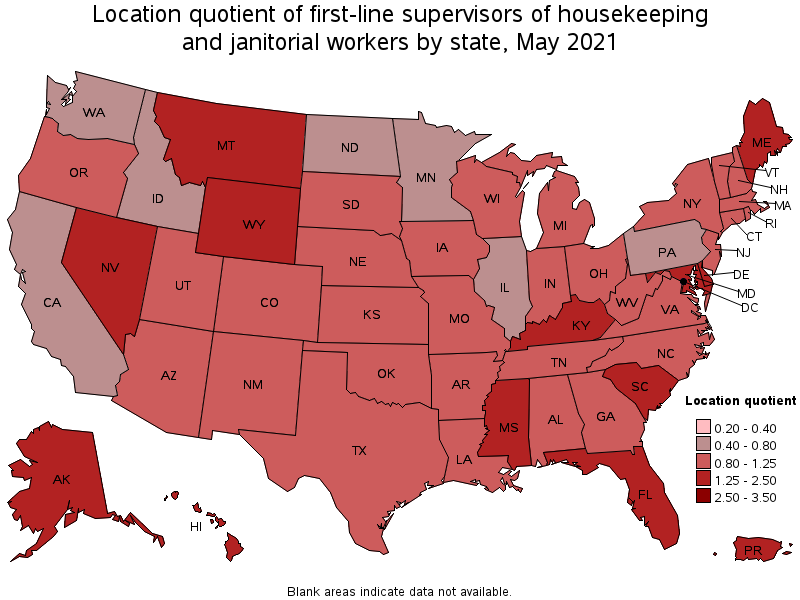
States with the highest concentration of jobs and location quotients in First-Line Supervisors of Housekeeping and Janitorial Workers:
| State | Employment (1) | Employment per thousand jobs | Location quotient (9) | Hourly mean wage | Annual mean wage (2) |
|---|---|---|---|---|---|
| Nevada | 2,810 | 2.18 | 2.00 | $ 19.67 | $ 40,910 |
| Wyoming | 550 | 2.12 | 1.95 | $ 20.91 | $ 43,480 |
| Alaska | 600 | 2.01 | 1.85 | $ 21.11 | $ 43,900 |
| Delaware | 880 | 2.01 | 1.84 | $ 24.32 | $ 50,590 |
| District of Columbia | 1,150 | 1.73 | 1.59 | $ 24.34 | $ 50,630 |
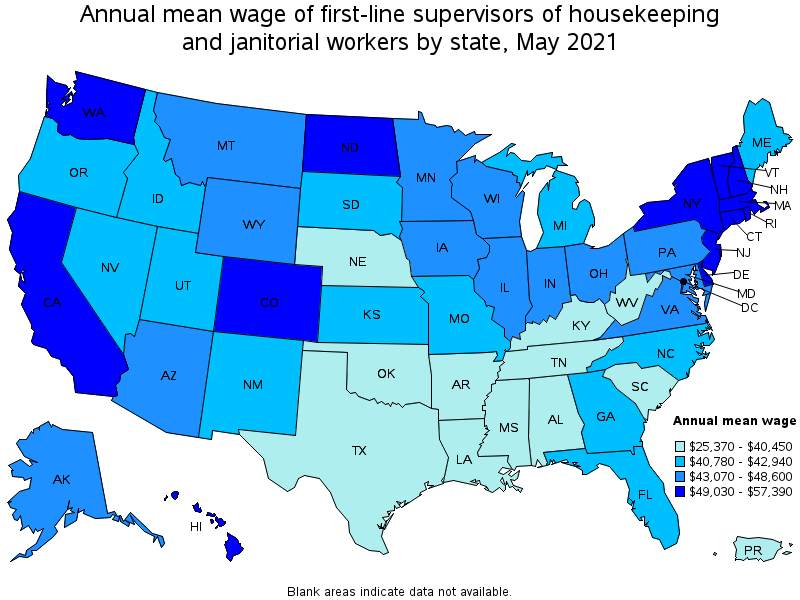
Top paying states for First-Line Supervisors of Housekeeping and Janitorial Workers:
| State | Employment (1) | Employment per thousand jobs | Location quotient (9) | Hourly mean wage | Annual mean wage (2) |
|---|---|---|---|---|---|
| Massachusetts | 3,930 | 1.16 | 1.06 | $ 27.59 | $ 57,390 |
| Rhode Island | 570 | 1.25 | 1.15 | $ 26.48 | $ 55,080 |
| New York | 8,490 | 0.98 | 0.90 | $ 26.37 | $ 54,850 |
| Connecticut | 1,740 | 1.11 | 1.02 | $ 26.11 | $ 54,300 |
| California | 12,390 | 0.75 | 0.69 | $ 25.45 | $ 52,930 |
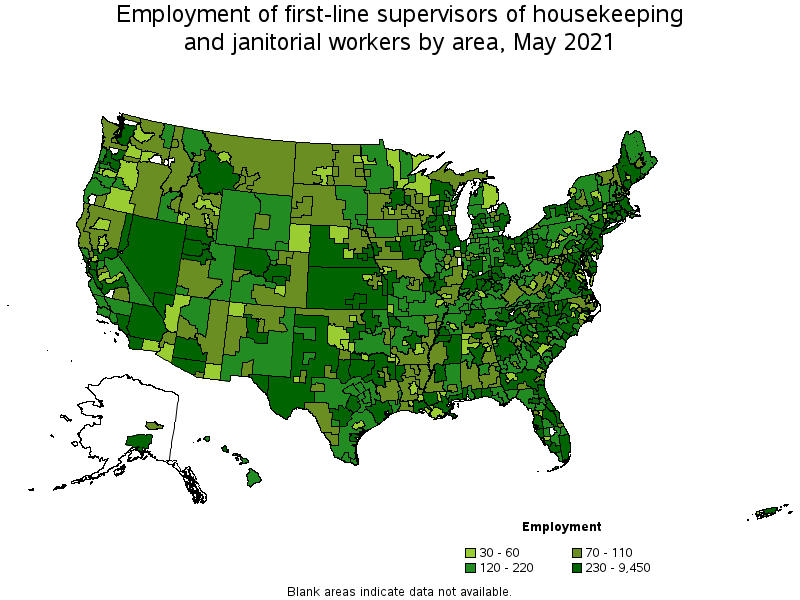
Metropolitan areas with the highest employment level in First-Line Supervisors of Housekeeping and Janitorial Workers:
| Metropolitan area | Employment (1) | Employment per thousand jobs | Location quotient (9) | Hourly mean wage | Annual mean wage (2) |
|---|---|---|---|---|---|
| New York-Newark-Jersey City, NY-NJ-PA | 9,450 | 1.09 | 1.00 | $ 27.26 | $ 56,710 |
| Washington-Arlington-Alexandria, DC-VA-MD-WV | 4,660 | 1.59 | 1.46 | $ 24.44 | $ 50,830 |
| Los Angeles-Long Beach-Anaheim, CA | 4,180 | 0.73 | 0.67 | $ 25.77 | $ 53,600 |
| Miami-Fort Lauderdale-West Palm Beach, FL | 3,560 | 1.45 | 1.33 | $ 19.58 | $ 40,730 |
| Atlanta-Sandy Springs-Roswell, GA | 3,490 | 1.35 | 1.24 | $ 21.19 | $ 44,060 |
| Houston-The Woodlands-Sugar Land, TX | 3,450 | 1.19 | 1.09 | $ 19.43 | $ 40,410 |
| Dallas-Fort Worth-Arlington, TX | 3,420 | 0.95 | 0.87 | $ 20.23 | $ 42,070 |
| Chicago-Naperville-Elgin, IL-IN-WI | 3,290 | 0.78 | 0.71 | $ 23.34 | $ 48,540 |
| Boston-Cambridge-Nashua, MA-NH | 3,130 | 1.21 | 1.11 | $ 28.44 | $ 59,160 |
| Philadelphia-Camden-Wilmington, PA-NJ-DE-MD | 2,660 | 1.00 | 0.92 | $ 24.05 | $ 50,030 |
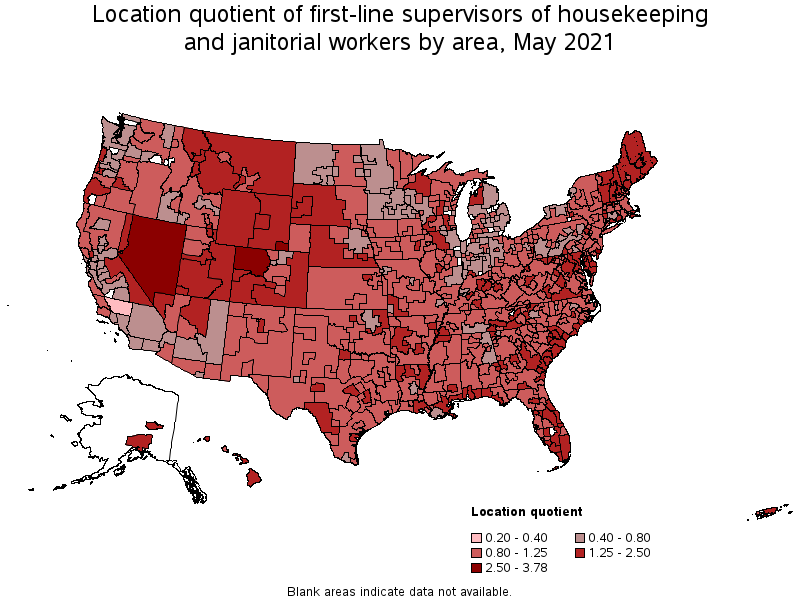
Metropolitan areas with the highest concentration of jobs and location quotients in First-Line Supervisors of Housekeeping and Janitorial Workers:
| Metropolitan area | Employment (1) | Employment per thousand jobs | Location quotient (9) | Hourly mean wage | Annual mean wage (2) |
|---|---|---|---|---|---|
| Atlantic City-Hammonton, NJ | 320 | 2.78 | 2.55 | $ 21.21 | $ 44,110 |
| Cheyenne, WY | 120 | 2.74 | 2.51 | $ 19.79 | $ 41,160 |
| Myrtle Beach-Conway-North Myrtle Beach, SC-NC | 430 | 2.66 | 2.44 | $ 17.92 | $ 37,270 |
| Brunswick, GA | 110 | 2.60 | 2.38 | $ 17.02 | $ 35,400 |
| Naples-Immokalee-Marco Island, FL | 350 | 2.41 | 2.21 | $ 21.10 | $ 43,880 |
| Enid, OK | 50 | 2.36 | 2.17 | $ 15.74 | $ 32,740 |
| Fairbanks, AK | 80 | 2.35 | 2.16 | $ 23.49 | $ 48,860 |
| Kahului-Wailuku-Lahaina, HI | 150 | 2.32 | 2.12 | $ 25.97 | $ 54,010 |
| Homosassa Springs, FL | 70 | 2.31 | 2.12 | $ 18.14 | $ 37,730 |
| Daphne-Fairhope-Foley, AL | 170 | 2.24 | 2.05 | $ 18.43 | $ 38,340 |
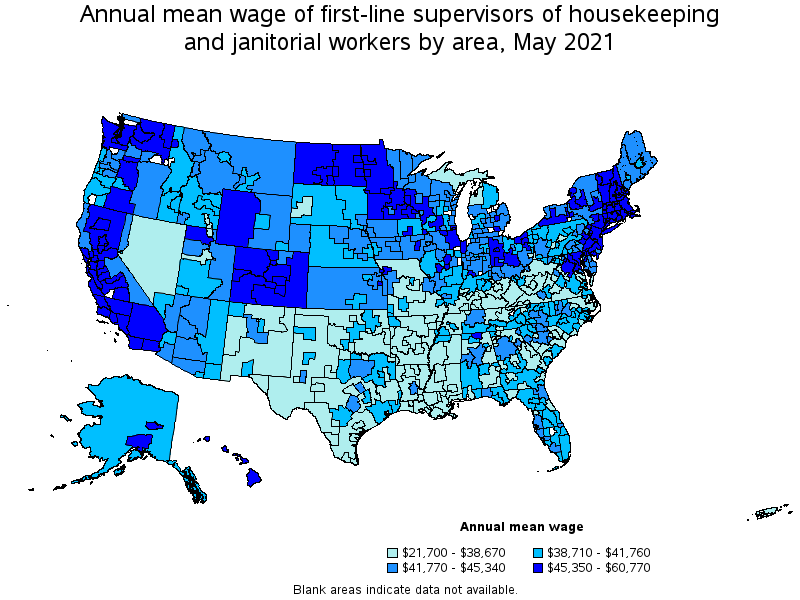
Top paying metropolitan areas for First-Line Supervisors of Housekeeping and Janitorial Workers:
| Metropolitan area | Employment (1) | Employment per thousand jobs | Location quotient (9) | Hourly mean wage | Annual mean wage (2) |
|---|---|---|---|---|---|
| San Jose-Sunnyvale-Santa Clara, CA | 720 | 0.68 | 0.62 | $ 29.21 | $ 60,770 |
| San Francisco-Oakland-Hayward, CA | 1,640 | 0.73 | 0.67 | $ 28.97 | $ 60,250 |
| Boston-Cambridge-Nashua, MA-NH | 3,130 | 1.21 | 1.11 | $ 28.44 | $ 59,160 |
| Lima, OH | 70 | 1.35 | 1.24 | $ 27.96 | $ 58,150 |
| New York-Newark-Jersey City, NY-NJ-PA | 9,450 | 1.09 | 1.00 | $ 27.26 | $ 56,710 |
| Leominster-Gardner, MA | 40 | 0.83 | 0.76 | $ 27.07 | $ 56,300 |
| Bridgeport-Stamford-Norwalk, CT | 400 | 1.07 | 0.98 | $ 26.88 | $ 55,920 |
| Vallejo-Fairfield, CA | 60 | 0.49 | 0.45 | $ 26.78 | $ 55,700 |
| Hartford-West Hartford-East Hartford, CT | 460 | 0.85 | 0.78 | $ 26.75 | $ 55,640 |
| Boulder, CO | 120 | 0.63 | 0.58 | $ 26.64 | $ 55,410 |
Nonmetropolitan areas with the highest employment in First-Line Supervisors of Housekeeping and Janitorial Workers:
| Nonmetropolitan area | Employment (1) | Employment per thousand jobs | Location quotient (9) | Hourly mean wage | Annual mean wage (2) |
|---|---|---|---|---|---|
| Northwest Colorado nonmetropolitan area | 480 | 4.13 | 3.78 | $ 25.03 | $ 52,050 |
| Kansas nonmetropolitan area | 430 | 1.15 | 1.06 | $ 20.58 | $ 42,810 |
| Nevada nonmetropolitan area | 320 | 3.29 | 3.02 | $ 17.10 | $ 35,570 |
| East Tennessee nonmetropolitan area | 320 | 2.39 | 2.19 | $ 18.89 | $ 39,290 |
| North Northeastern Ohio nonmetropolitan area (noncontiguous) | 300 | 0.96 | 0.88 | $ 20.02 | $ 41,640 |
Nonmetropolitan areas with the highest concentration of jobs and location quotients in First-Line Supervisors of Housekeeping and Janitorial Workers:
| Nonmetropolitan area | Employment (1) | Employment per thousand jobs | Location quotient (9) | Hourly mean wage | Annual mean wage (2) |
|---|---|---|---|---|---|
| Northwest Colorado nonmetropolitan area | 480 | 4.13 | 3.78 | $ 25.03 | $ 52,050 |
| Nevada nonmetropolitan area | 320 | 3.29 | 3.02 | $ 17.10 | $ 35,570 |
| Eastern Utah nonmetropolitan area | 220 | 2.70 | 2.48 | $ 21.28 | $ 44,270 |
| East Tennessee nonmetropolitan area | 320 | 2.39 | 2.19 | $ 18.89 | $ 39,290 |
| Northern New Hampshire nonmetropolitan area | 80 | 2.30 | 2.11 | $ 22.49 | $ 46,780 |
Top paying nonmetropolitan areas for First-Line Supervisors of Housekeeping and Janitorial Workers:
| Nonmetropolitan area | Employment (1) | Employment per thousand jobs | Location quotient (9) | Hourly mean wage | Annual mean wage (2) |
|---|---|---|---|---|---|
| Hawaii / Kauai nonmetropolitan area | 170 | 1.93 | 1.77 | $ 26.07 | $ 54,220 |
| Massachusetts nonmetropolitan area | 120 | 2.00 | 1.84 | $ 25.91 | $ 53,890 |
| Connecticut nonmetropolitan area | 50 | 1.59 | 1.46 | $ 25.83 | $ 53,720 |
| Southwest Colorado nonmetropolitan area | 190 | 1.96 | 1.79 | $ 25.46 | $ 52,950 |
| Northwest Colorado nonmetropolitan area | 480 | 4.13 | 3.78 | $ 25.03 | $ 52,050 |
These estimates are calculated with data collected from employers in all industry sectors, all metropolitan and nonmetropolitan areas, and all states and the District of Columbia. The top employment and wage figures are provided above. The complete list is available in the downloadable XLS files.
The percentile wage estimate is the value of a wage below which a certain percent of workers fall. The median wage is the 50th percentile wage estimate—50 percent of workers earn less than the median and 50 percent of workers earn more than the median. More about percentile wages.
(1) Estimates for detailed occupations do not sum to the totals because the totals include occupations not shown separately. Estimates do not include self-employed workers.
(2) Annual wages have been calculated by multiplying the hourly mean wage by a "year-round, full-time" hours figure of 2,080 hours; for those occupations where there is not an hourly wage published, the annual wage has been directly calculated from the reported survey data.
(3) The relative standard error (RSE) is a measure of the reliability of a survey statistic. The smaller the relative standard error, the more precise the estimate.
(7) The value is less than .005 percent of industry employment.
(8) Estimate not released.
(9) The location quotient is the ratio of the area concentration of occupational employment to the national average concentration. A location quotient greater than one indicates the occupation has a higher share of employment than average, and a location quotient less than one indicates the occupation is less prevalent in the area than average.
Other OEWS estimates and related information:
May 2021 National Occupational Employment and Wage Estimates
May 2021 State Occupational Employment and Wage Estimates
May 2021 Metropolitan and Nonmetropolitan Area Occupational Employment and Wage Estimates
May 2021 National Industry-Specific Occupational Employment and Wage Estimates
Last Modified Date: March 31, 2022