
An official website of the United States government
An official website of the United States government
The .gov means it's official.
Federal government websites often end in .gov or .mil. Before sharing sensitive information,
make sure you're on a federal government site.
The site is secure.
The
https:// ensures that you are connecting to the official website and that any
information you provide is encrypted and transmitted securely.
Keep buildings in clean and orderly condition. Perform heavy cleaning duties, such as cleaning floors, shampooing rugs, washing walls and glass, and removing rubbish. Duties may include tending furnace and boiler, performing routine maintenance activities, notifying management of need for repairs, and cleaning snow or debris from sidewalk.
Employment estimate and mean wage estimates for Janitors and Cleaners, Except Maids and Housekeeping Cleaners:
| Employment (1) | Employment RSE (3) |
Mean hourly wage |
Mean annual wage (2) |
Wage RSE (3) |
|---|---|---|---|---|
| 2,036,680 | 0.4 % | $ 15.32 | $ 31,860 | 0.3 % |
Percentile wage estimates for Janitors and Cleaners, Except Maids and Housekeeping Cleaners:
| Percentile | 10% | 25% | 50% (Median) |
75% | 90% |
|---|---|---|---|---|---|
| Hourly Wage | $ 10.74 | $ 11.80 | $ 14.31 | $ 17.66 | $ 22.26 |
| Annual Wage (2) | $ 22,340 | $ 24,550 | $ 29,760 | $ 36,730 | $ 46,300 |
Industries with the highest published employment and wages for Janitors and Cleaners, Except Maids and Housekeeping Cleaners are provided. For a list of all industries with employment in Janitors and Cleaners, Except Maids and Housekeeping Cleaners, see the Create Customized Tables function.
Industries with the highest levels of employment in Janitors and Cleaners, Except Maids and Housekeeping Cleaners:
| Industry | Employment (1) | Percent of industry employment | Hourly mean wage | Annual mean wage (2) |
|---|---|---|---|---|
| Services to Buildings and Dwellings | 824,710 | 38.32 | $ 14.22 | $ 29,570 |
| Elementary and Secondary Schools | 302,620 | 3.74 | $ 16.76 | $ 34,860 |
| General Medical and Surgical Hospitals | 73,650 | 1.32 | $ 15.85 | $ 32,970 |
| Local Government, excluding schools and hospitals (OEWS Designation) | 64,910 | 1.21 | $ 19.02 | $ 39,560 |
| Colleges, Universities, and Professional Schools | 62,130 | 2.08 | $ 16.85 | $ 35,040 |
Industries with the highest concentration of employment in Janitors and Cleaners, Except Maids and Housekeeping Cleaners:
| Industry | Employment (1) | Percent of industry employment | Hourly mean wage | Annual mean wage (2) |
|---|---|---|---|---|
| Services to Buildings and Dwellings | 824,710 | 38.32 | $ 14.22 | $ 29,570 |
| Facilities Support Services | 29,500 | 17.62 | $ 14.51 | $ 30,170 |
| Vocational Rehabilitation Services | 17,020 | 6.37 | $ 13.11 | $ 27,270 |
| Religious Organizations | 9,090 | 5.07 | $ 16.15 | $ 33,580 |
| Rooming and Boarding Houses | 410 | 4.60 | $ 16.89 | $ 35,130 |
Top paying industries for Janitors and Cleaners, Except Maids and Housekeeping Cleaners:
| Industry | Employment (1) | Percent of industry employment | Hourly mean wage | Annual mean wage (2) |
|---|---|---|---|---|
| Couriers and Express Delivery Services | 1,120 | 0.12 | $ 27.32 | $ 56,820 |
| Postal Service (federal government) | 13,360 | 2.12 | $ 25.90 | $ 53,870 |
| Natural Gas Distribution | 40 | 0.04 | $ 23.77 | $ 49,430 |
| Coal Mining | 60 | 0.17 | $ 22.88 | $ 47,580 |
| Metal Ore Mining | 90 | 0.22 | $ 22.50 | $ 46,790 |
States and areas with the highest published employment, location quotients, and wages for Janitors and Cleaners, Except Maids and Housekeeping Cleaners are provided. For a list of all areas with employment in Janitors and Cleaners, Except Maids and Housekeeping Cleaners, see the Create Customized Tables function.
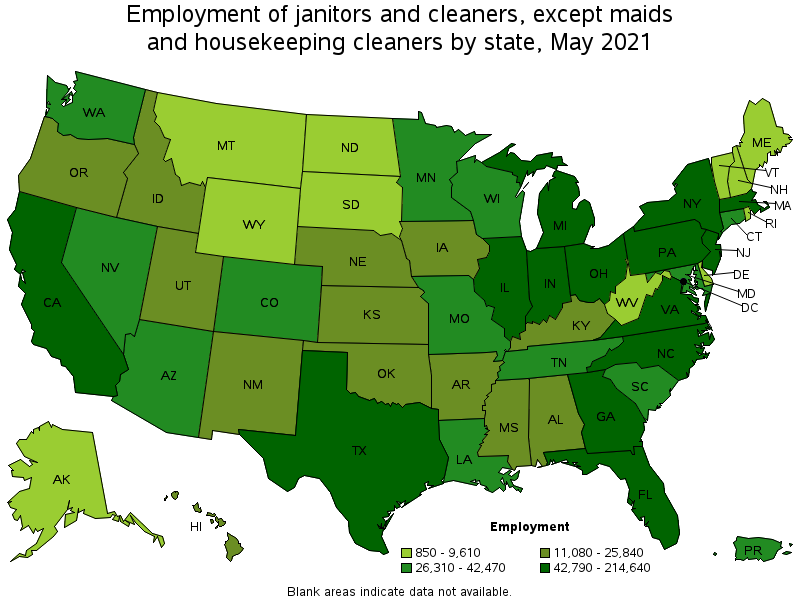
States with the highest employment level in Janitors and Cleaners, Except Maids and Housekeeping Cleaners:
| State | Employment (1) | Employment per thousand jobs | Location quotient (9) | Hourly mean wage | Annual mean wage (2) |
|---|---|---|---|---|---|
| California | 214,640 | 12.98 | 0.90 | $ 17.99 | $ 37,410 |
| Texas | 169,050 | 13.83 | 0.96 | $ 13.18 | $ 27,420 |
| New York | 161,480 | 18.63 | 1.29 | $ 18.66 | $ 38,820 |
| Florida | 119,490 | 13.88 | 0.96 | $ 13.08 | $ 27,210 |
| Illinois | 92,790 | 16.51 | 1.14 | $ 15.92 | $ 33,120 |
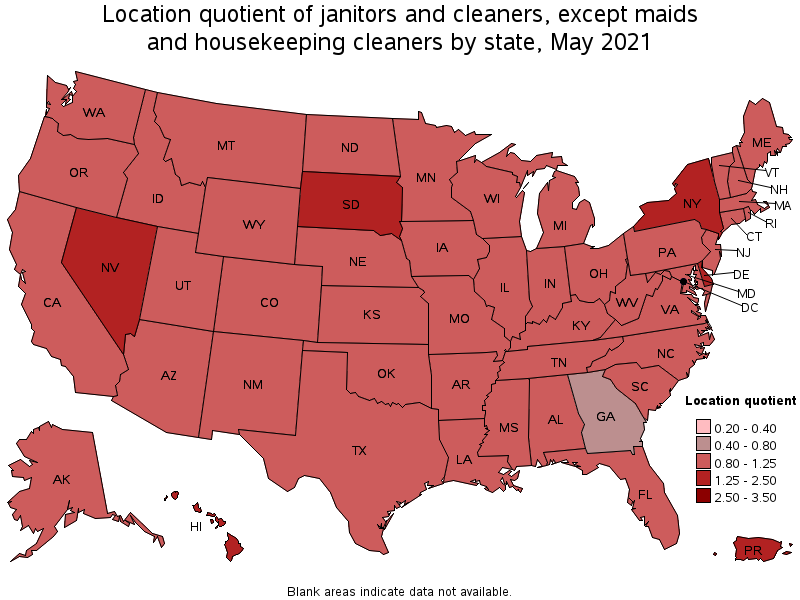
States with the highest concentration of jobs and location quotients in Janitors and Cleaners, Except Maids and Housekeeping Cleaners:
| State | Employment (1) | Employment per thousand jobs | Location quotient (9) | Hourly mean wage | Annual mean wage (2) |
|---|---|---|---|---|---|
| Nevada | 26,310 | 20.41 | 1.41 | $ 14.55 | $ 30,260 |
| Hawaii | 11,080 | 20.21 | 1.40 | $ 16.39 | $ 34,090 |
| District of Columbia | 12,510 | 18.89 | 1.31 | $ 18.07 | $ 37,580 |
| South Dakota | 7,890 | 18.72 | 1.30 | $ 14.33 | $ 29,800 |
| New York | 161,480 | 18.63 | 1.29 | $ 18.66 | $ 38,820 |
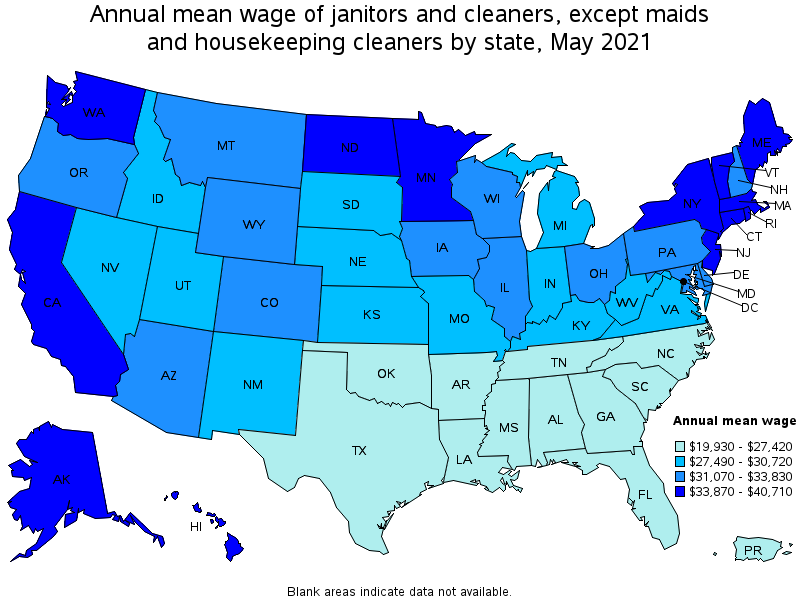
Top paying states for Janitors and Cleaners, Except Maids and Housekeeping Cleaners:
| State | Employment (1) | Employment per thousand jobs | Location quotient (9) | Hourly mean wage | Annual mean wage (2) |
|---|---|---|---|---|---|
| Massachusetts | 47,540 | 14.00 | 0.97 | $ 19.57 | $ 40,710 |
| New York | 161,480 | 18.63 | 1.29 | $ 18.66 | $ 38,820 |
| Washington | 42,470 | 13.25 | 0.92 | $ 18.32 | $ 38,100 |
| District of Columbia | 12,510 | 18.89 | 1.31 | $ 18.07 | $ 37,580 |
| California | 214,640 | 12.98 | 0.90 | $ 17.99 | $ 37,410 |
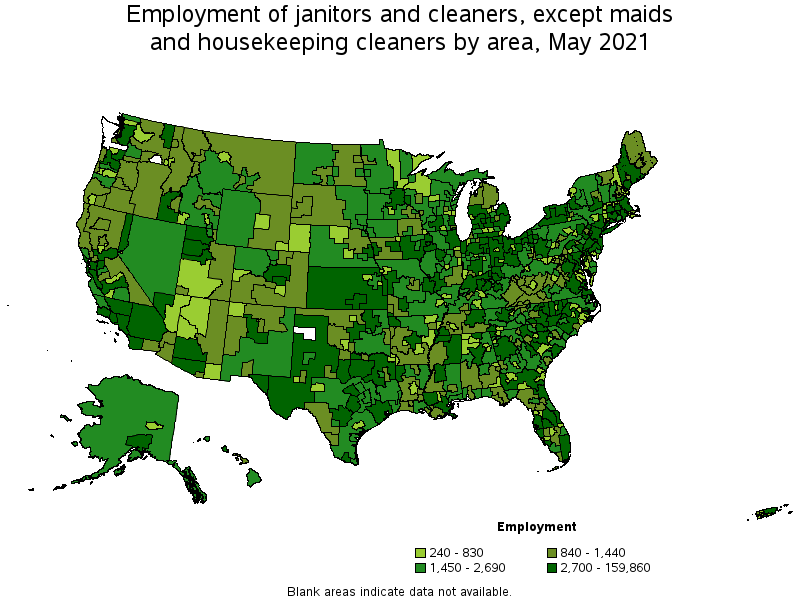
Metropolitan areas with the highest employment level in Janitors and Cleaners, Except Maids and Housekeeping Cleaners:
| Metropolitan area | Employment (1) | Employment per thousand jobs | Location quotient (9) | Hourly mean wage | Annual mean wage (2) |
|---|---|---|---|---|---|
| New York-Newark-Jersey City, NY-NJ-PA | 159,860 | 18.42 | 1.27 | $ 19.22 | $ 39,980 |
| Los Angeles-Long Beach-Anaheim, CA | 74,890 | 13.09 | 0.91 | $ 17.58 | $ 36,560 |
| Chicago-Naperville-Elgin, IL-IN-WI | 68,690 | 16.23 | 1.12 | $ 16.33 | $ 33,960 |
| Washington-Arlington-Alexandria, DC-VA-MD-WV | 49,900 | 17.01 | 1.18 | $ 16.50 | $ 34,310 |
| Houston-The Woodlands-Sugar Land, TX | 46,200 | 15.95 | 1.10 | $ 13.00 | $ 27,040 |
| Philadelphia-Camden-Wilmington, PA-NJ-DE-MD | 40,960 | 15.43 | 1.07 | $ 16.09 | $ 33,470 |
| Dallas-Fort Worth-Arlington, TX | 40,780 | 11.36 | 0.79 | $ 13.92 | $ 28,950 |
| Miami-Fort Lauderdale-West Palm Beach, FL | 38,710 | 15.78 | 1.09 | $ 13.07 | $ 27,180 |
| Boston-Cambridge-Nashua, MA-NH | 37,750 | 14.60 | 1.01 | $ 19.83 | $ 41,240 |
| San Francisco-Oakland-Hayward, CA | 28,710 | 12.80 | 0.89 | $ 20.21 | $ 42,030 |
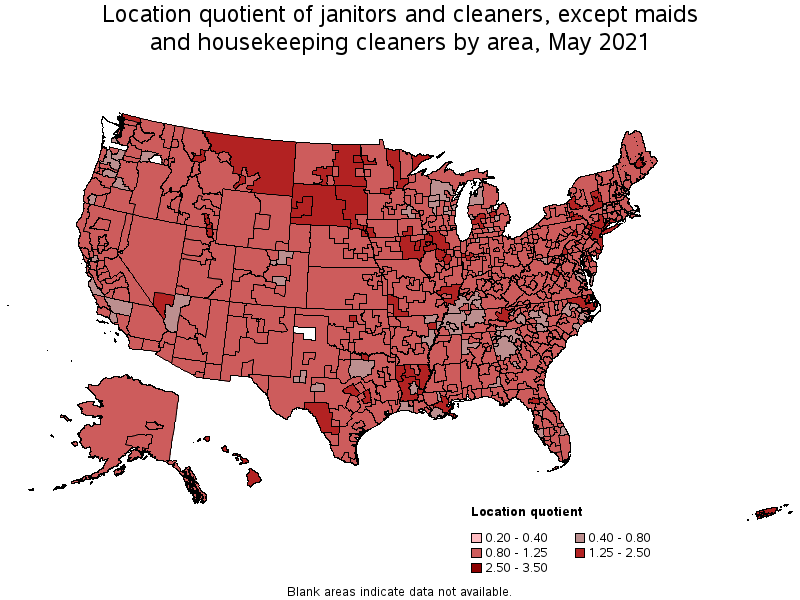
Metropolitan areas with the highest concentration of jobs and location quotients in Janitors and Cleaners, Except Maids and Housekeeping Cleaners:
| Metropolitan area | Employment (1) | Employment per thousand jobs | Location quotient (9) | Hourly mean wage | Annual mean wage (2) |
|---|---|---|---|---|---|
| Ithaca, NY | 1,140 | 24.64 | 1.70 | $ 17.65 | $ 36,710 |
| Waterloo-Cedar Falls, IA | 2,060 | 24.59 | 1.70 | $ 16.56 | $ 34,450 |
| Harrisonburg, VA | 1,510 | 24.53 | 1.70 | $ 13.43 | $ 27,930 |
| Logan, UT-ID | 1,530 | 24.04 | 1.66 | $ 13.37 | $ 27,810 |
| Sioux City, IA-NE-SD | 2,000 | 23.87 | 1.65 | $ 15.70 | $ 32,650 |
| Shreveport-Bossier City, LA | 3,840 | 23.69 | 1.64 | $ 10.80 | $ 22,460 |
| Saginaw, MI | 1,760 | 22.92 | 1.59 | $ 14.18 | $ 29,490 |
| Las Vegas-Henderson-Paradise, NV | 20,980 | 22.83 | 1.58 | $ 14.65 | $ 30,480 |
| Atlantic City-Hammonton, NJ | 2,650 | 22.81 | 1.58 | $ 15.96 | $ 33,200 |
| Kahului-Wailuku-Lahaina, HI | 1,430 | 22.39 | 1.55 | $ 16.77 | $ 34,870 |
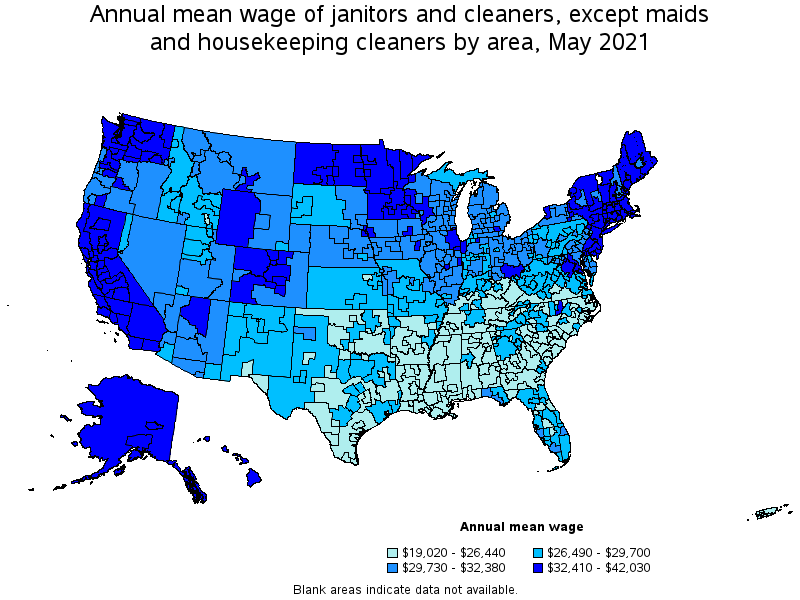
Top paying metropolitan areas for Janitors and Cleaners, Except Maids and Housekeeping Cleaners:
| Metropolitan area | Employment (1) | Employment per thousand jobs | Location quotient (9) | Hourly mean wage | Annual mean wage (2) |
|---|---|---|---|---|---|
| San Francisco-Oakland-Hayward, CA | 28,710 | 12.80 | 0.89 | $ 20.21 | $ 42,030 |
| Boston-Cambridge-Nashua, MA-NH | 37,750 | 14.60 | 1.01 | $ 19.83 | $ 41,240 |
| Barnstable Town, MA | 1,100 | 11.31 | 0.78 | $ 19.78 | $ 41,150 |
| San Jose-Sunnyvale-Santa Clara, CA | 15,130 | 14.16 | 0.98 | $ 19.48 | $ 40,520 |
| New York-Newark-Jersey City, NY-NJ-PA | 159,860 | 18.42 | 1.27 | $ 19.22 | $ 39,980 |
| Napa, CA | 1,000 | 14.51 | 1.00 | $ 19.20 | $ 39,940 |
| Seattle-Tacoma-Bellevue, WA | 23,300 | 12.15 | 0.84 | $ 19.20 | $ 39,940 |
| New Bedford, MA | 550 | 8.98 | 0.62 | $ 18.78 | $ 39,060 |
| Vallejo-Fairfield, CA | 1,270 | 9.81 | 0.68 | $ 18.55 | $ 38,580 |
| Worcester, MA-CT | 3,340 | 12.44 | 0.86 | $ 18.51 | $ 38,500 |
Nonmetropolitan areas with the highest employment in Janitors and Cleaners, Except Maids and Housekeeping Cleaners:
| Nonmetropolitan area | Employment (1) | Employment per thousand jobs | Location quotient (9) | Hourly mean wage | Annual mean wage (2) |
|---|---|---|---|---|---|
| Kansas nonmetropolitan area | 6,670 | 17.76 | 1.23 | $ 13.88 | $ 28,860 |
| Southeast Iowa nonmetropolitan area | 4,330 | 20.63 | 1.43 | $ 15.16 | $ 31,540 |
| North Northeastern Ohio nonmetropolitan area (noncontiguous) | 4,310 | 13.70 | 0.95 | $ 14.54 | $ 30,250 |
| North Texas Region of Texas nonmetropolitan area | 4,030 | 15.15 | 1.05 | $ 12.74 | $ 26,490 |
| Balance of Lower Peninsula of Michigan nonmetropolitan area | 3,870 | 15.32 | 1.06 | $ 14.63 | $ 30,430 |
Nonmetropolitan areas with the highest concentration of jobs and location quotients in Janitors and Cleaners, Except Maids and Housekeeping Cleaners:
| Nonmetropolitan area | Employment (1) | Employment per thousand jobs | Location quotient (9) | Hourly mean wage | Annual mean wage (2) |
|---|---|---|---|---|---|
| Northeast Louisiana nonmetropolitan area | 1,450 | 23.44 | 1.62 | $ 10.18 | $ 21,180 |
| Border Region of Texas nonmetropolitan area | 1,280 | 22.91 | 1.58 | $ 11.87 | $ 24,700 |
| West South Dakota nonmetropolitan area | 1,270 | 21.11 | 1.46 | $ 13.91 | $ 28,930 |
| East-Central Montana nonmetropolitan area | 1,300 | 20.89 | 1.44 | $ 15.22 | $ 31,650 |
| Northwest Illinois nonmetropolitan area | 2,610 | 20.66 | 1.43 | $ 14.73 | $ 30,630 |
Top paying nonmetropolitan areas for Janitors and Cleaners, Except Maids and Housekeeping Cleaners:
| Nonmetropolitan area | Employment (1) | Employment per thousand jobs | Location quotient (9) | Hourly mean wage | Annual mean wage (2) |
|---|---|---|---|---|---|
| Massachusetts nonmetropolitan area | 790 | 13.62 | 0.94 | $ 19.10 | $ 39,740 |
| Connecticut nonmetropolitan area | 420 | 13.47 | 0.93 | $ 18.36 | $ 38,190 |
| Alaska nonmetropolitan area | 1,670 | 17.15 | 1.19 | $ 18.00 | $ 37,430 |
| Hawaii / Kauai nonmetropolitan area | 1,670 | 18.74 | 1.30 | $ 17.96 | $ 37,350 |
| Western Washington nonmetropolitan area | (8) | (8) | (8) | $ 17.78 | $ 36,970 |
These estimates are calculated with data collected from employers in all industry sectors, all metropolitan and nonmetropolitan areas, and all states and the District of Columbia. The top employment and wage figures are provided above. The complete list is available in the downloadable XLS files.
The percentile wage estimate is the value of a wage below which a certain percent of workers fall. The median wage is the 50th percentile wage estimate—50 percent of workers earn less than the median and 50 percent of workers earn more than the median. More about percentile wages.
(1) Estimates for detailed occupations do not sum to the totals because the totals include occupations not shown separately. Estimates do not include self-employed workers.
(2) Annual wages have been calculated by multiplying the hourly mean wage by a "year-round, full-time" hours figure of 2,080 hours; for those occupations where there is not an hourly wage published, the annual wage has been directly calculated from the reported survey data.
(3) The relative standard error (RSE) is a measure of the reliability of a survey statistic. The smaller the relative standard error, the more precise the estimate.
(8) Estimate not released.
(9) The location quotient is the ratio of the area concentration of occupational employment to the national average concentration. A location quotient greater than one indicates the occupation has a higher share of employment than average, and a location quotient less than one indicates the occupation is less prevalent in the area than average.
Other OEWS estimates and related information:
May 2021 National Occupational Employment and Wage Estimates
May 2021 State Occupational Employment and Wage Estimates
May 2021 Metropolitan and Nonmetropolitan Area Occupational Employment and Wage Estimates
May 2021 National Industry-Specific Occupational Employment and Wage Estimates
Last Modified Date: March 31, 2022