
An official website of the United States government
An official website of the United States government
The .gov means it's official.
Federal government websites often end in .gov or .mil. Before sharing sensitive information,
make sure you're on a federal government site.
The site is secure.
The
https:// ensures that you are connecting to the official website and that any
information you provide is encrypted and transmitted securely.
Mix or apply pesticides, herbicides, fungicides, or insecticides through sprays, dusts, vapors, soil incorporation, or chemical application on trees, shrubs, lawns, or crops. Usually requires specific training and state or federal certification. Crop dusters are included in �Commercial Pilots� (53-2012).
Employment estimate and mean wage estimates for Pesticide Handlers, Sprayers, and Applicators, Vegetation:
| Employment (1) | Employment RSE (3) |
Mean hourly wage |
Mean annual wage (2) |
Wage RSE (3) |
|---|---|---|---|---|
| 25,820 | 4.1 % | $ 19.47 | $ 40,500 | 1.0 % |
Percentile wage estimates for Pesticide Handlers, Sprayers, and Applicators, Vegetation:
| Percentile | 10% | 25% | 50% (Median) |
75% | 90% |
|---|---|---|---|---|---|
| Hourly Wage | $ 13.86 | $ 16.15 | $ 18.40 | $ 22.23 | $ 25.81 |
| Annual Wage (2) | $ 28,820 | $ 33,580 | $ 38,270 | $ 46,240 | $ 53,690 |
Industries with the highest published employment and wages for Pesticide Handlers, Sprayers, and Applicators, Vegetation are provided. For a list of all industries with employment in Pesticide Handlers, Sprayers, and Applicators, Vegetation, see the Create Customized Tables function.
Industries with the highest levels of employment in Pesticide Handlers, Sprayers, and Applicators, Vegetation:
| Industry | Employment (1) | Percent of industry employment | Hourly mean wage | Annual mean wage (2) |
|---|---|---|---|---|
| Services to Buildings and Dwellings | 12,390 | 0.58 | $ 19.81 | $ 41,210 |
| Merchant Wholesalers, Nondurable Goods (4241, 4247, and 4249 only) | 5,730 | 1.09 | $ 19.19 | $ 39,920 |
| Local Government, excluding schools and hospitals (OEWS Designation) | 2,220 | 0.04 | $ 19.87 | $ 41,330 |
| Support Activities for Crop Production | 1,580 | 0.47 | $ 17.76 | $ 36,930 |
| Farm Product Raw Material Merchant Wholesalers | 830 | 1.22 | $ 20.48 | $ 42,590 |
Industries with the highest concentration of employment in Pesticide Handlers, Sprayers, and Applicators, Vegetation:
| Industry | Employment (1) | Percent of industry employment | Hourly mean wage | Annual mean wage (2) |
|---|---|---|---|---|
| Farm Product Raw Material Merchant Wholesalers | 830 | 1.22 | $ 20.48 | $ 42,590 |
| Merchant Wholesalers, Nondurable Goods (4241, 4247, and 4249 only) | 5,730 | 1.09 | $ 19.19 | $ 39,920 |
| Services to Buildings and Dwellings | 12,390 | 0.58 | $ 19.81 | $ 41,210 |
| Support Activities for Crop Production | 1,580 | 0.47 | $ 17.76 | $ 36,930 |
| Lawn and Garden Equipment and Supplies Stores | 390 | 0.21 | $ 19.58 | $ 40,730 |
Top paying industries for Pesticide Handlers, Sprayers, and Applicators, Vegetation:
| Industry | Employment (1) | Percent of industry employment | Hourly mean wage | Annual mean wage (2) |
|---|---|---|---|---|
| General Medical and Surgical Hospitals | 40 | (7) | $ 29.60 | $ 61,560 |
| Wholesale Electronic Markets and Agents and Brokers | 340 | 0.07 | $ 27.30 | $ 56,780 |
| State Government, excluding schools and hospitals (OEWS Designation) | 60 | (7) | $ 21.37 | $ 44,450 |
| Farm Product Raw Material Merchant Wholesalers | 830 | 1.22 | $ 20.48 | $ 42,590 |
| Warehousing and Storage | 120 | 0.01 | $ 20.33 | $ 42,280 |
States and areas with the highest published employment, location quotients, and wages for Pesticide Handlers, Sprayers, and Applicators, Vegetation are provided. For a list of all areas with employment in Pesticide Handlers, Sprayers, and Applicators, Vegetation, see the Create Customized Tables function.
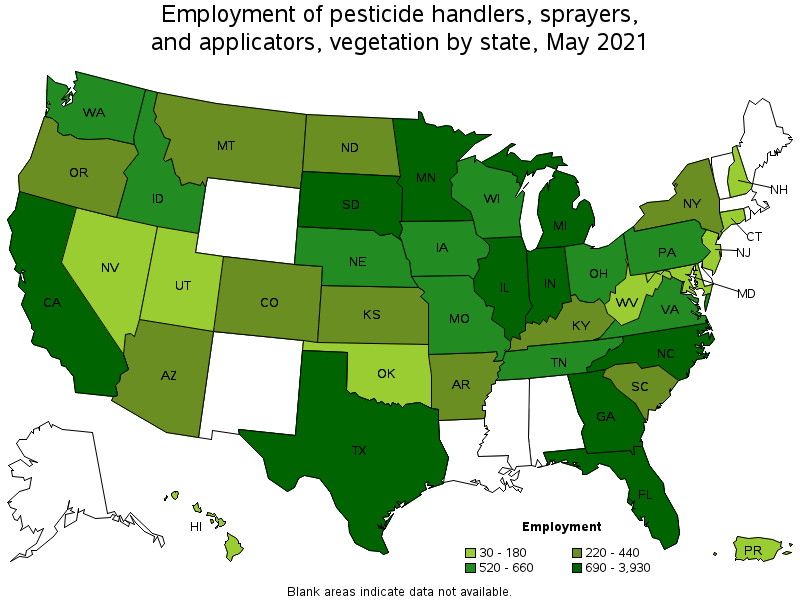
States with the highest employment level in Pesticide Handlers, Sprayers, and Applicators, Vegetation:
| State | Employment (1) | Employment per thousand jobs | Location quotient (9) | Hourly mean wage | Annual mean wage (2) |
|---|---|---|---|---|---|
| Florida | 3,930 | 0.46 | 2.49 | $ 17.84 | $ 37,120 |
| California | 2,300 | 0.14 | 0.76 | $ 20.97 | $ 43,610 |
| Illinois | 1,410 | 0.25 | 1.37 | $ 21.67 | $ 45,070 |
| Minnesota | 1,180 | 0.43 | 2.35 | $ 20.49 | $ 42,630 |
| Texas | 1,020 | 0.08 | 0.46 | $ 21.56 | $ 44,850 |
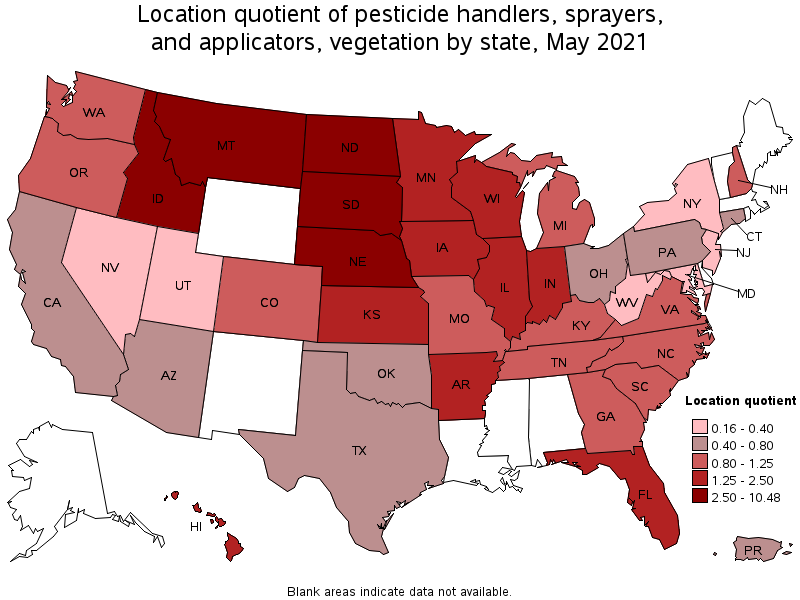
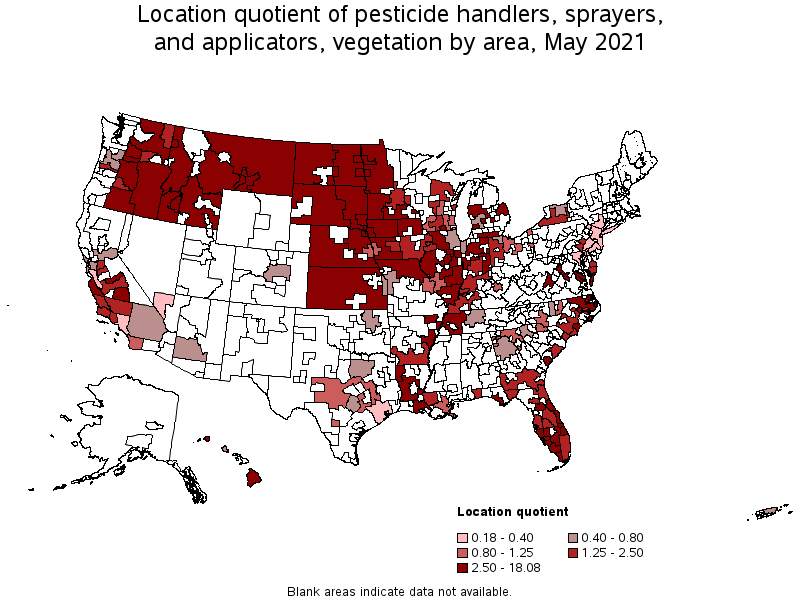
States with the highest concentration of jobs and location quotients in Pesticide Handlers, Sprayers, and Applicators, Vegetation:
| State | Employment (1) | Employment per thousand jobs | Location quotient (9) | Hourly mean wage | Annual mean wage (2) |
|---|---|---|---|---|---|
| South Dakota | 810 | 1.92 | 10.48 | $ 18.36 | $ 38,180 |
| North Dakota | 420 | 1.05 | 5.74 | $ 20.45 | $ 42,540 |
| Montana | 440 | 0.94 | 5.15 | $ 18.33 | $ 38,120 |
| Idaho | 570 | 0.76 | 4.13 | $ 19.68 | $ 40,930 |
| Nebraska | 600 | 0.62 | 3.39 | $ 17.86 | $ 37,140 |
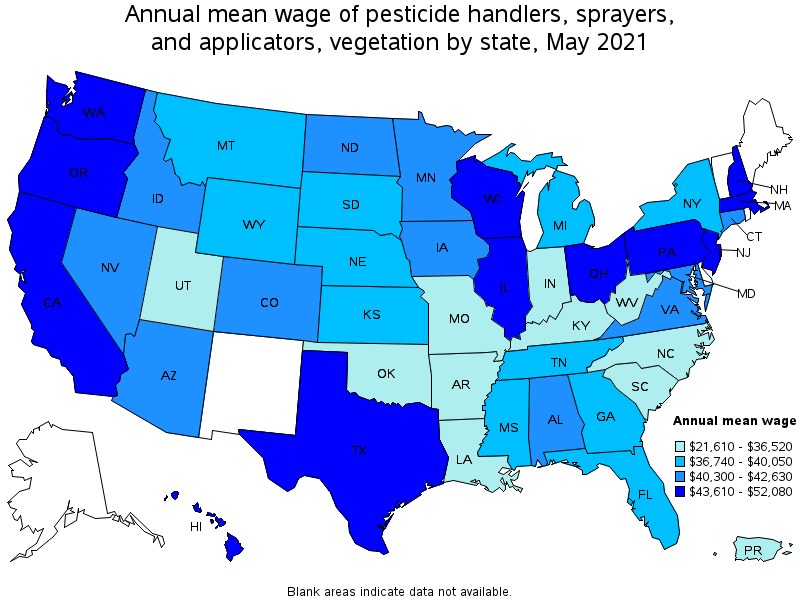
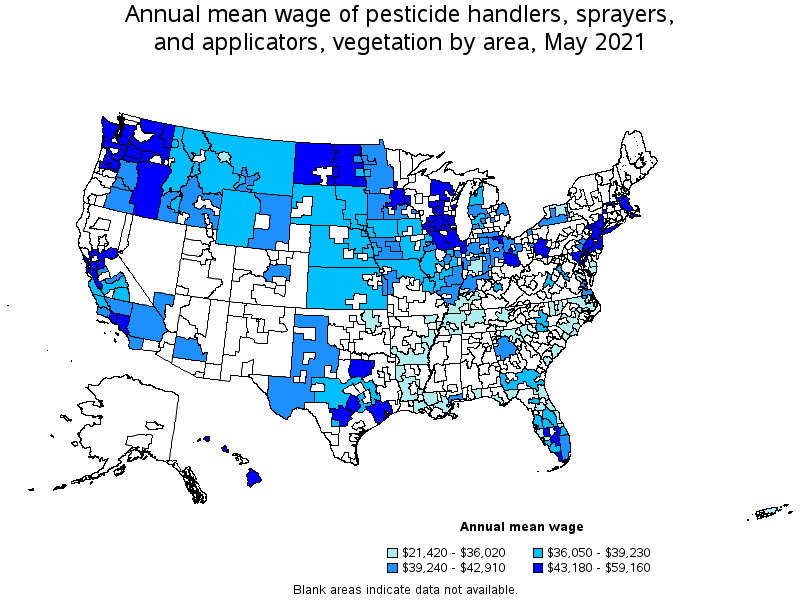
Top paying states for Pesticide Handlers, Sprayers, and Applicators, Vegetation:
| State | Employment (1) | Employment per thousand jobs | Location quotient (9) | Hourly mean wage | Annual mean wage (2) |
|---|---|---|---|---|---|
| New Hampshire | 120 | 0.19 | 1.01 | $ 25.04 | $ 52,080 |
| Massachusetts | (8) | (8) | (8) | $ 24.07 | $ 50,060 |
| New Jersey | 110 | 0.03 | 0.16 | $ 23.88 | $ 49,680 |
| Washington | 630 | 0.20 | 1.07 | $ 23.50 | $ 48,870 |
| Ohio | 540 | 0.10 | 0.57 | $ 22.94 | $ 47,720 |
Metropolitan areas with the highest employment level in Pesticide Handlers, Sprayers, and Applicators, Vegetation:
| Metropolitan area | Employment (1) | Employment per thousand jobs | Location quotient (9) | Hourly mean wage | Annual mean wage (2) |
|---|---|---|---|---|---|
| Miami-Fort Lauderdale-West Palm Beach, FL | 1,060 | 0.43 | 2.36 | $ 19.00 | $ 39,510 |
| Minneapolis-St. Paul-Bloomington, MN-WI | 440 | 0.24 | 1.32 | $ 21.55 | $ 44,830 |
| Orlando-Kissimmee-Sanford, FL | 430 | 0.37 | 2.02 | $ 18.15 | $ 37,750 |
| Los Angeles-Long Beach-Anaheim, CA | 410 | 0.07 | 0.39 | $ 23.18 | $ 48,220 |
| Tampa-St. Petersburg-Clearwater, FL | 400 | 0.31 | 1.71 | $ 18.04 | $ 37,530 |
| Indianapolis-Carmel-Anderson, IN | 390 | 0.39 | 2.10 | $ 14.62 | $ 30,410 |
| Atlanta-Sandy Springs-Roswell, GA | 320 | 0.12 | 0.67 | $ 20.48 | $ 42,600 |
| Chicago-Naperville-Elgin, IL-IN-WI | 310 | 0.07 | 0.40 | $ 21.23 | $ 44,150 |
| North Port-Sarasota-Bradenton, FL | 300 | 1.04 | 5.66 | $ 16.72 | $ 34,770 |
| New York-Newark-Jersey City, NY-NJ-PA | 290 | 0.03 | 0.18 | $ 21.70 | $ 45,130 |
Metropolitan areas with the highest concentration of jobs and location quotients in Pesticide Handlers, Sprayers, and Applicators, Vegetation:
| Metropolitan area | Employment (1) | Employment per thousand jobs | Location quotient (9) | Hourly mean wage | Annual mean wage (2) |
|---|---|---|---|---|---|
| Naples-Immokalee-Marco Island, FL | 230 | 1.60 | 8.72 | $ 18.40 | $ 38,260 |
| Sebastian-Vero Beach, FL | 60 | 1.25 | 6.81 | $ 16.42 | $ 34,160 |
| Salinas, CA | 200 | 1.16 | 6.30 | $ 18.05 | $ 37,540 |
| North Port-Sarasota-Bradenton, FL | 300 | 1.04 | 5.66 | $ 16.72 | $ 34,770 |
| Sioux Falls, SD | 150 | 0.99 | 5.40 | $ 18.34 | $ 38,150 |
| Billings, MT | 80 | 0.96 | 5.22 | $ 18.91 | $ 39,330 |
| Ocala, FL | 100 | 0.92 | 5.02 | $ 15.36 | $ 31,940 |
| Punta Gorda, FL | 40 | 0.87 | 4.77 | $ 16.72 | $ 34,770 |
| Coeur d'Alene, ID | 60 | 0.86 | 4.68 | $ 18.83 | $ 39,160 |
| Boise City, ID | 280 | 0.82 | 4.48 | $ 20.02 | $ 41,640 |
Top paying metropolitan areas for Pesticide Handlers, Sprayers, and Applicators, Vegetation:
| Metropolitan area | Employment (1) | Employment per thousand jobs | Location quotient (9) | Hourly mean wage | Annual mean wage (2) |
|---|---|---|---|---|---|
| Seattle-Tacoma-Bellevue, WA | (8) | (8) | (8) | $ 28.44 | $ 59,160 |
| San Francisco-Oakland-Hayward, CA | 190 | 0.08 | 0.46 | $ 26.30 | $ 54,710 |
| San Antonio-New Braunfels, TX | (8) | (8) | (8) | $ 25.92 | $ 53,920 |
| Boston-Cambridge-Nashua, MA-NH | (8) | (8) | (8) | $ 25.48 | $ 52,990 |
| Houston-The Woodlands-Sugar Land, TX | 200 | 0.07 | 0.38 | $ 24.67 | $ 51,310 |
| Portland-Vancouver-Hillsboro, OR-WA | 140 | 0.13 | 0.68 | $ 24.49 | $ 50,930 |
| Toledo, OH | 40 | 0.14 | 0.76 | $ 24.46 | $ 50,890 |
| Columbus, OH | (8) | (8) | (8) | $ 24.41 | $ 50,780 |
| San Jose-Sunnyvale-Santa Clara, CA | 70 | 0.07 | 0.37 | $ 23.67 | $ 49,230 |
| Austin-Round Rock, TX | 100 | 0.10 | 0.52 | $ 23.25 | $ 48,350 |
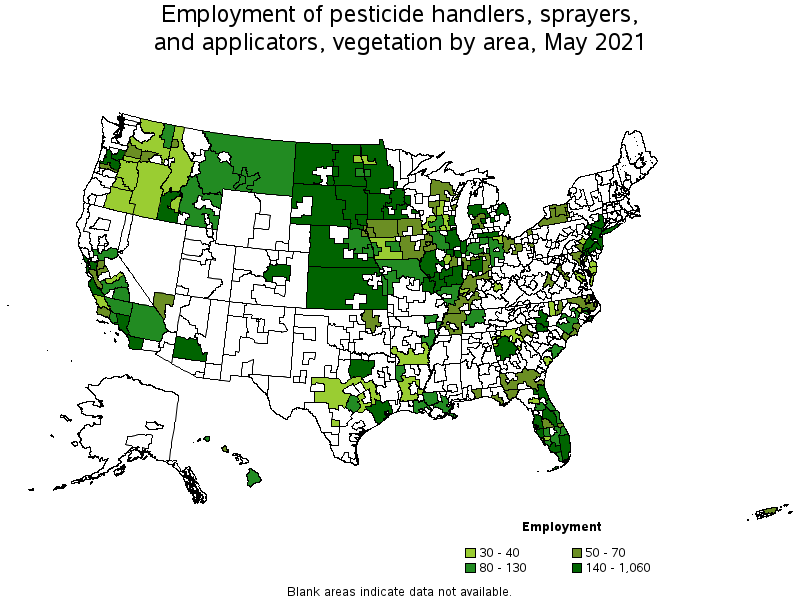
Nonmetropolitan areas with the highest employment in Pesticide Handlers, Sprayers, and Applicators, Vegetation:
| Nonmetropolitan area | Employment (1) | Employment per thousand jobs | Location quotient (9) | Hourly mean wage | Annual mean wage (2) |
|---|---|---|---|---|---|
| East South Dakota nonmetropolitan area | 420 | 3.31 | 18.08 | $ 18.70 | $ 38,900 |
| Southwest Minnesota nonmetropolitan area | 270 | 2.32 | 12.63 | $ 19.84 | $ 41,270 |
| Balance of Lower Peninsula of Michigan nonmetropolitan area | 260 | 1.05 | 5.71 | $ 18.89 | $ 39,290 |
| South Nebraska nonmetropolitan area | 250 | 1.75 | 9.57 | $ 17.85 | $ 37,130 |
| West Central Illinois nonmetropolitan area | 210 | 1.30 | 7.11 | $ 18.75 | $ 38,990 |
Nonmetropolitan areas with the highest concentration of jobs and location quotients in Pesticide Handlers, Sprayers, and Applicators, Vegetation:
| Nonmetropolitan area | Employment (1) | Employment per thousand jobs | Location quotient (9) | Hourly mean wage | Annual mean wage (2) |
|---|---|---|---|---|---|
| East South Dakota nonmetropolitan area | 420 | 3.31 | 18.08 | $ 18.70 | $ 38,900 |
| West South Dakota nonmetropolitan area | 180 | 2.98 | 16.28 | $ 17.55 | $ 36,490 |
| East North Dakota nonmetropolitan area | 140 | 2.35 | 12.84 | $ 21.96 | $ 45,680 |
| Southwest Minnesota nonmetropolitan area | 270 | 2.32 | 12.63 | $ 19.84 | $ 41,270 |
| South Nebraska nonmetropolitan area | 250 | 1.75 | 9.57 | $ 17.85 | $ 37,130 |
Top paying nonmetropolitan areas for Pesticide Handlers, Sprayers, and Applicators, Vegetation:
| Nonmetropolitan area | Employment (1) | Employment per thousand jobs | Location quotient (9) | Hourly mean wage | Annual mean wage (2) |
|---|---|---|---|---|---|
| Massachusetts nonmetropolitan area | (8) | (8) | (8) | $ 26.45 | $ 55,010 |
| South Central Wisconsin nonmetropolitan area | 40 | 0.22 | 1.19 | $ 24.28 | $ 50,510 |
| Eastern Oregon nonmetropolitan area | 30 | 0.48 | 2.60 | $ 22.76 | $ 47,350 |
| Northwest Illinois nonmetropolitan area | 120 | 0.97 | 5.30 | $ 22.41 | $ 46,610 |
| Eastern Washington nonmetropolitan area | 40 | 0.47 | 2.56 | $ 22.39 | $ 46,560 |
These estimates are calculated with data collected from employers in all industry sectors, all metropolitan and nonmetropolitan areas, and all states and the District of Columbia. The top employment and wage figures are provided above. The complete list is available in the downloadable XLS files.
The percentile wage estimate is the value of a wage below which a certain percent of workers fall. The median wage is the 50th percentile wage estimate—50 percent of workers earn less than the median and 50 percent of workers earn more than the median. More about percentile wages.
(1) Estimates for detailed occupations do not sum to the totals because the totals include occupations not shown separately. Estimates do not include self-employed workers.
(2) Annual wages have been calculated by multiplying the hourly mean wage by a "year-round, full-time" hours figure of 2,080 hours; for those occupations where there is not an hourly wage published, the annual wage has been directly calculated from the reported survey data.
(3) The relative standard error (RSE) is a measure of the reliability of a survey statistic. The smaller the relative standard error, the more precise the estimate.
(7) The value is less than .005 percent of industry employment.
(8) Estimate not released.
(9) The location quotient is the ratio of the area concentration of occupational employment to the national average concentration. A location quotient greater than one indicates the occupation has a higher share of employment than average, and a location quotient less than one indicates the occupation is less prevalent in the area than average.
Other OEWS estimates and related information:
May 2021 National Occupational Employment and Wage Estimates
May 2021 State Occupational Employment and Wage Estimates
May 2021 Metropolitan and Nonmetropolitan Area Occupational Employment and Wage Estimates
May 2021 National Industry-Specific Occupational Employment and Wage Estimates
Last Modified Date: March 31, 2022