
An official website of the United States government
An official website of the United States government
The .gov means it's official.
Federal government websites often end in .gov or .mil. Before sharing sensitive information,
make sure you're on a federal government site.
The site is secure.
The
https:// ensures that you are connecting to the official website and that any
information you provide is encrypted and transmitted securely.
Perform a variety of tasks during funeral, such as placing casket in parlor or chapel prior to service, arranging floral offerings or lights around casket, directing or escorting mourners, closing casket, and issuing and storing funeral equipment.
Employment estimate and mean wage estimates for Funeral Attendants:
| Employment (1) | Employment RSE (3) |
Mean hourly wage |
Mean annual wage (2) |
Wage RSE (3) |
|---|---|---|---|---|
| 32,490 | 1.7 % | $ 15.21 | $ 31,630 | 1.1 % |
Percentile wage estimates for Funeral Attendants:
| Percentile | 10% | 25% | 50% (Median) |
75% | 90% |
|---|---|---|---|---|---|
| Hourly Wage | $ 10.75 | $ 11.78 | $ 14.05 | $ 17.23 | $ 21.95 |
| Annual Wage (2) | $ 22,350 | $ 24,490 | $ 29,230 | $ 35,840 | $ 45,660 |
Industries with the highest published employment and wages for Funeral Attendants are provided. For a list of all industries with employment in Funeral Attendants, see the Create Customized Tables function.
Industries with the highest levels of employment in Funeral Attendants:
| Industry | Employment (1) | Percent of industry employment | Hourly mean wage | Annual mean wage (2) |
|---|---|---|---|---|
| Death Care Services | 32,360 | 24.47 | $ 15.21 | $ 31,630 |
Industries with the highest concentration of employment in Funeral Attendants:
| Industry | Employment (1) | Percent of industry employment | Hourly mean wage | Annual mean wage (2) |
|---|---|---|---|---|
| Death Care Services | 32,360 | 24.47 | $ 15.21 | $ 31,630 |
Top paying industries for Funeral Attendants:
| Industry | Employment (1) | Percent of industry employment | Hourly mean wage | Annual mean wage (2) |
|---|---|---|---|---|
| Death Care Services | 32,360 | 24.47 | $ 15.21 | $ 31,630 |
States and areas with the highest published employment, location quotients, and wages for Funeral Attendants are provided. For a list of all areas with employment in Funeral Attendants, see the Create Customized Tables function.
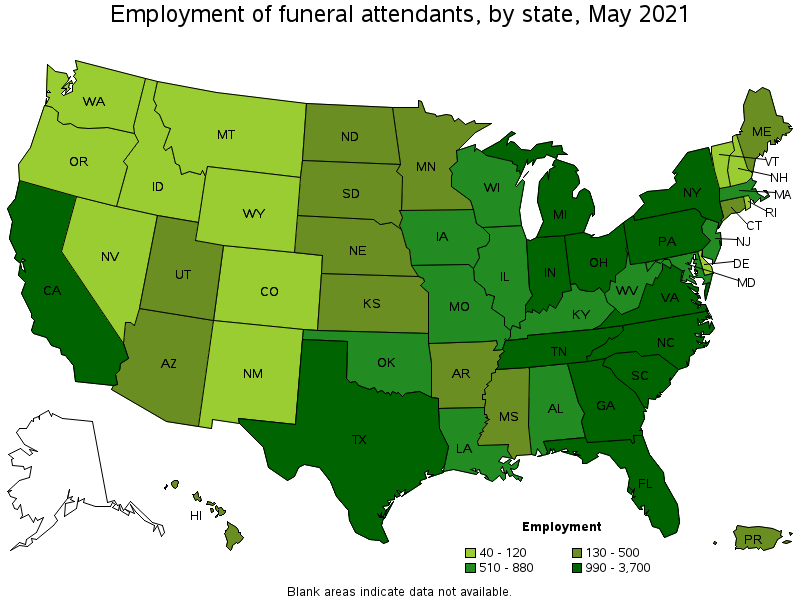
States with the highest employment level in Funeral Attendants:
| State | Employment (1) | Employment per thousand jobs | Location quotient (9) | Hourly mean wage | Annual mean wage (2) |
|---|---|---|---|---|---|
| Texas | 3,700 | 0.30 | 1.31 | $ 13.09 | $ 27,230 |
| Florida | 1,780 | 0.21 | 0.89 | $ 13.69 | $ 28,470 |
| California | 1,700 | 0.10 | 0.45 | $ 18.75 | $ 39,000 |
| Pennsylvania | 1,620 | 0.29 | 1.26 | $ 16.43 | $ 34,160 |
| Ohio | 1,510 | 0.29 | 1.26 | $ 14.68 | $ 30,540 |
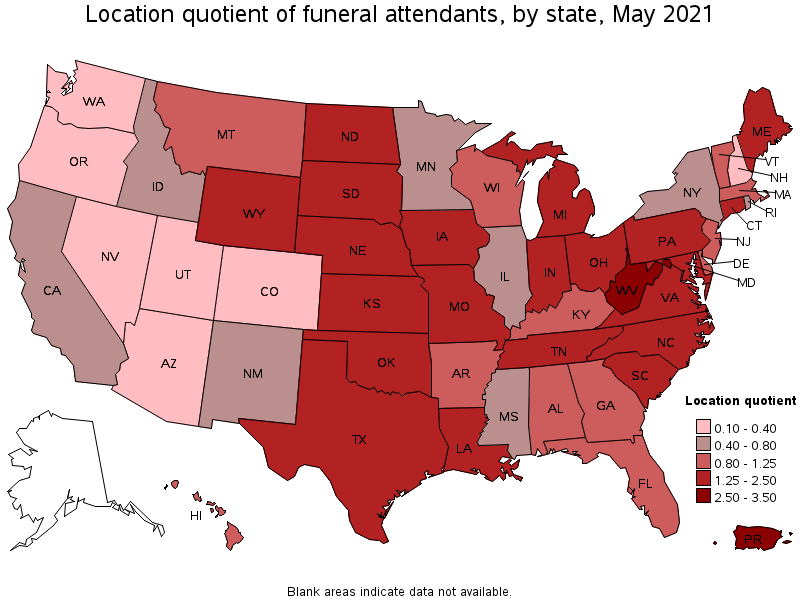
States with the highest concentration of jobs and location quotients in Funeral Attendants:
| State | Employment (1) | Employment per thousand jobs | Location quotient (9) | Hourly mean wage | Annual mean wage (2) |
|---|---|---|---|---|---|
| West Virginia | 530 | 0.80 | 3.47 | $ 12.91 | $ 26,850 |
| South Carolina | 990 | 0.48 | 2.08 | $ 14.21 | $ 29,550 |
| Indiana | 1,280 | 0.43 | 1.86 | $ 13.96 | $ 29,030 |
| North Dakota | 160 | 0.41 | 1.76 | $ 15.17 | $ 31,550 |
| Tennessee | 1,170 | 0.39 | 1.70 | $ 17.84 | $ 37,110 |
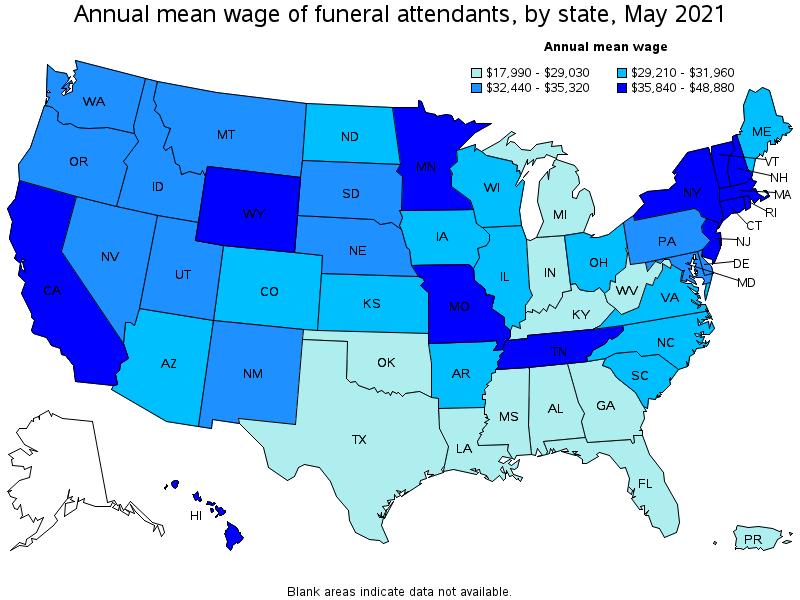
Top paying states for Funeral Attendants:
| State | Employment (1) | Employment per thousand jobs | Location quotient (9) | Hourly mean wage | Annual mean wage (2) |
|---|---|---|---|---|---|
| Rhode Island | 80 | 0.17 | 0.72 | $ 23.50 | $ 48,880 |
| New Jersey | 870 | 0.23 | 0.98 | $ 21.36 | $ 44,420 |
| New Hampshire | 50 | 0.09 | 0.37 | $ 20.40 | $ 42,430 |
| California | 1,700 | 0.10 | 0.45 | $ 18.75 | $ 39,000 |
| Massachusetts | 880 | 0.26 | 1.13 | $ 18.67 | $ 38,840 |
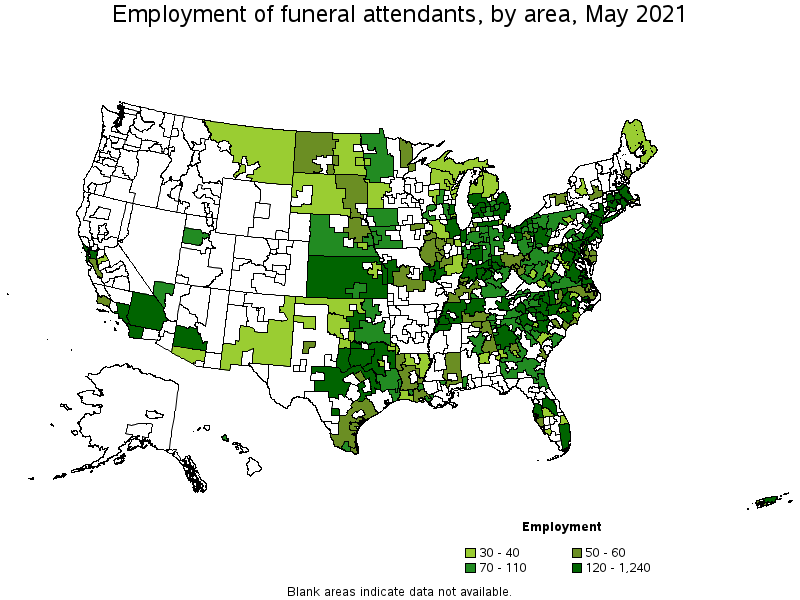
Metropolitan areas with the highest employment level in Funeral Attendants:
| Metropolitan area | Employment (1) | Employment per thousand jobs | Location quotient (9) | Hourly mean wage | Annual mean wage (2) |
|---|---|---|---|---|---|
| New York-Newark-Jersey City, NY-NJ-PA | 1,240 | 0.14 | 0.62 | $ 19.89 | $ 41,370 |
| Dallas-Fort Worth-Arlington, TX | 770 | 0.22 | 0.94 | $ 13.60 | $ 28,290 |
| Los Angeles-Long Beach-Anaheim, CA | 740 | 0.13 | 0.56 | $ 18.51 | $ 38,490 |
| Detroit-Warren-Dearborn, MI | 580 | 0.32 | 1.39 | $ 13.79 | $ 28,680 |
| Atlanta-Sandy Springs-Roswell, GA | 560 | 0.22 | 0.94 | $ 14.23 | $ 29,590 |
| Miami-Fort Lauderdale-West Palm Beach, FL | 550 | 0.22 | 0.97 | $ 14.11 | $ 29,350 |
| Chicago-Naperville-Elgin, IL-IN-WI | 500 | 0.12 | 0.51 | $ 15.85 | $ 32,960 |
| Washington-Arlington-Alexandria, DC-VA-MD-WV | 480 | 0.16 | 0.71 | $ 17.15 | $ 35,670 |
| Boston-Cambridge-Nashua, MA-NH | 480 | 0.18 | 0.80 | $ 20.20 | $ 42,020 |
| Philadelphia-Camden-Wilmington, PA-NJ-DE-MD | 470 | 0.18 | 0.77 | $ 18.44 | $ 38,340 |
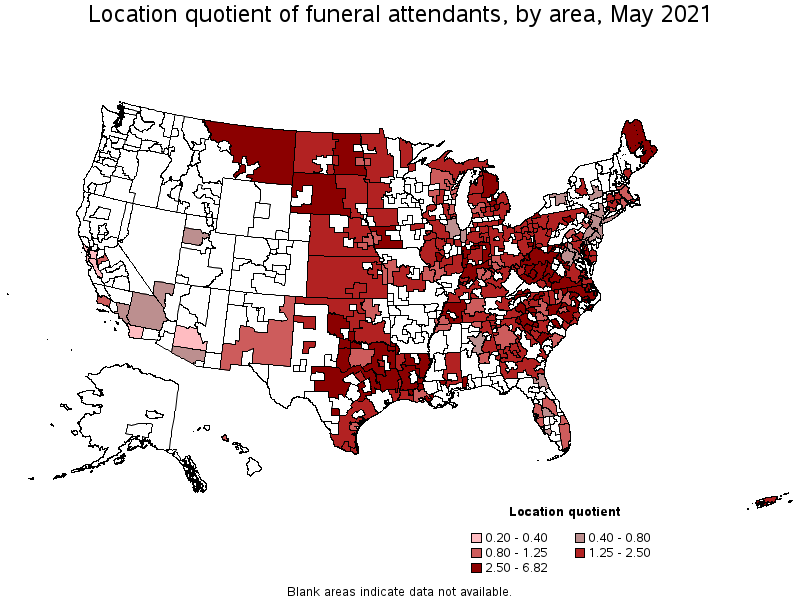
Metropolitan areas with the highest concentration of jobs and location quotients in Funeral Attendants:
| Metropolitan area | Employment (1) | Employment per thousand jobs | Location quotient (9) | Hourly mean wage | Annual mean wage (2) |
|---|---|---|---|---|---|
| Parkersburg-Vienna, WV | 50 | 1.57 | 6.82 | $ 12.95 | $ 26,930 |
| Wheeling, WV-OH | 70 | 1.25 | 5.42 | $ 12.33 | $ 25,640 |
| Cumberland, MD-WV | 40 | 1.19 | 5.16 | $ 14.16 | $ 29,440 |
| Springfield, OH | 50 | 1.19 | 5.15 | $ 13.21 | $ 27,470 |
| Saginaw, MI | 90 | 1.19 | 5.15 | $ 12.88 | $ 26,800 |
| Roanoke, VA | 170 | 1.17 | 5.07 | $ 13.27 | $ 27,590 |
| Kokomo, IN | 40 | 1.06 | 4.61 | $ 13.08 | $ 27,210 |
| Monroe, MI | 40 | 0.99 | 4.28 | $ 12.81 | $ 26,640 |
| Kingsport-Bristol-Bristol, TN-VA | 110 | 0.98 | 4.26 | $ 14.15 | $ 29,420 |
| Waterbury, CT | 60 | 0.96 | 4.17 | $ 16.75 | $ 34,840 |
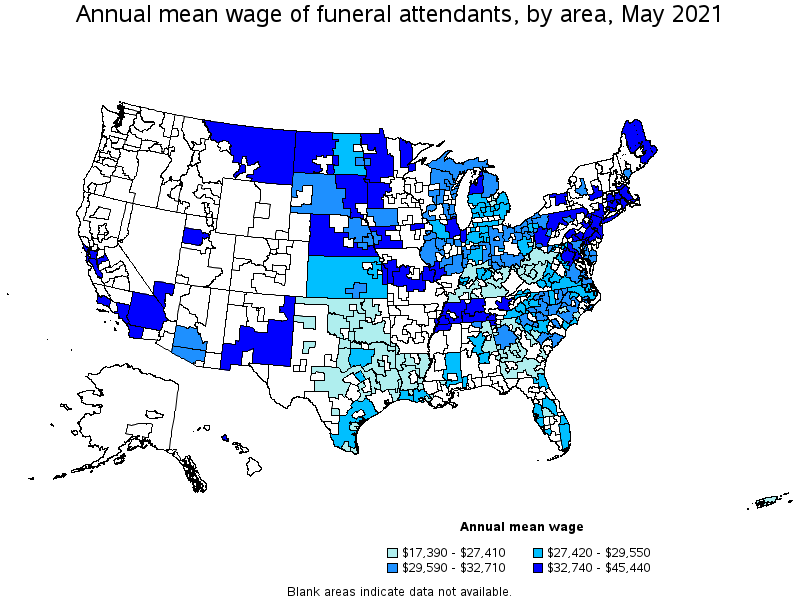
Top paying metropolitan areas for Funeral Attendants:
| Metropolitan area | Employment (1) | Employment per thousand jobs | Location quotient (9) | Hourly mean wage | Annual mean wage (2) |
|---|---|---|---|---|---|
| San Francisco-Oakland-Hayward, CA | 180 | 0.08 | 0.34 | $ 21.84 | $ 45,440 |
| San Jose-Sunnyvale-Santa Clara, CA | 60 | 0.05 | 0.22 | $ 21.76 | $ 45,270 |
| Trenton, NJ | 40 | 0.19 | 0.81 | $ 21.03 | $ 43,730 |
| Boston-Cambridge-Nashua, MA-NH | 480 | 0.18 | 0.80 | $ 20.20 | $ 42,020 |
| New York-Newark-Jersey City, NY-NJ-PA | 1,240 | 0.14 | 0.62 | $ 19.89 | $ 41,370 |
| Barnstable Town, MA | 50 | 0.49 | 2.11 | $ 19.64 | $ 40,840 |
| Providence-Warwick, RI-MA | 140 | 0.27 | 1.16 | $ 19.57 | $ 40,710 |
| Nashville-Davidson--Murfreesboro--Franklin, TN | 270 | 0.27 | 1.19 | $ 18.88 | $ 39,270 |
| Knoxville, TN | 170 | 0.43 | 1.88 | $ 18.78 | $ 39,070 |
| Los Angeles-Long Beach-Anaheim, CA | 740 | 0.13 | 0.56 | $ 18.51 | $ 38,490 |
Nonmetropolitan areas with the highest employment in Funeral Attendants:
| Nonmetropolitan area | Employment (1) | Employment per thousand jobs | Location quotient (9) | Hourly mean wage | Annual mean wage (2) |
|---|---|---|---|---|---|
| North Texas Region of Texas nonmetropolitan area | 230 | 0.88 | 3.80 | $ 12.88 | $ 26,790 |
| Kansas nonmetropolitan area | 200 | 0.53 | 2.31 | $ 13.35 | $ 27,760 |
| Piedmont North Carolina nonmetropolitan area | 160 | 0.67 | 2.89 | $ 14.26 | $ 29,650 |
| Southeast Coastal North Carolina nonmetropolitan area | 150 | 0.64 | 2.77 | $ 15.02 | $ 31,250 |
| West Tennessee nonmetropolitan area | 140 | 1.12 | 4.86 | $ 16.74 | $ 34,820 |
Nonmetropolitan areas with the highest concentration of jobs and location quotients in Funeral Attendants:
| Nonmetropolitan area | Employment (1) | Employment per thousand jobs | Location quotient (9) | Hourly mean wage | Annual mean wage (2) |
|---|---|---|---|---|---|
| Southern West Virginia nonmetropolitan area | 80 | 1.18 | 5.11 | $ 12.74 | $ 26,500 |
| Maryland nonmetropolitan area | 60 | 1.14 | 4.93 | $ 14.96 | $ 31,110 |
| Upper Savannah South Carolina nonmetropolitan area | 90 | 1.13 | 4.90 | $ 14.11 | $ 29,350 |
| West Tennessee nonmetropolitan area | 140 | 1.12 | 4.86 | $ 16.74 | $ 34,820 |
| Southside Virginia nonmetropolitan area | 100 | 1.04 | 4.49 | $ 13.34 | $ 27,750 |
Top paying nonmetropolitan areas for Funeral Attendants:
| Nonmetropolitan area | Employment (1) | Employment per thousand jobs | Location quotient (9) | Hourly mean wage | Annual mean wage (2) |
|---|---|---|---|---|---|
| Central Missouri nonmetropolitan area | 50 | 0.29 | 1.28 | $ 20.28 | $ 42,180 |
| Northwest Minnesota nonmetropolitan area | 70 | 0.38 | 1.64 | $ 17.31 | $ 36,000 |
| South Nebraska nonmetropolitan area | 70 | 0.51 | 2.22 | $ 17.24 | $ 35,860 |
| Southwest Minnesota nonmetropolitan area | 40 | 0.39 | 1.68 | $ 17.08 | $ 35,520 |
| West Tennessee nonmetropolitan area | 140 | 1.12 | 4.86 | $ 16.74 | $ 34,820 |
These estimates are calculated with data collected from employers in all industry sectors, all metropolitan and nonmetropolitan areas, and all states and the District of Columbia. The top employment and wage figures are provided above. The complete list is available in the downloadable XLS files.
The percentile wage estimate is the value of a wage below which a certain percent of workers fall. The median wage is the 50th percentile wage estimate—50 percent of workers earn less than the median and 50 percent of workers earn more than the median. More about percentile wages.
(1) Estimates for detailed occupations do not sum to the totals because the totals include occupations not shown separately. Estimates do not include self-employed workers.
(2) Annual wages have been calculated by multiplying the hourly mean wage by a "year-round, full-time" hours figure of 2,080 hours; for those occupations where there is not an hourly wage published, the annual wage has been directly calculated from the reported survey data.
(3) The relative standard error (RSE) is a measure of the reliability of a survey statistic. The smaller the relative standard error, the more precise the estimate.
(9) The location quotient is the ratio of the area concentration of occupational employment to the national average concentration. A location quotient greater than one indicates the occupation has a higher share of employment than average, and a location quotient less than one indicates the occupation is less prevalent in the area than average.
Other OEWS estimates and related information:
May 2021 National Occupational Employment and Wage Estimates
May 2021 State Occupational Employment and Wage Estimates
May 2021 Metropolitan and Nonmetropolitan Area Occupational Employment and Wage Estimates
May 2021 National Industry-Specific Occupational Employment and Wage Estimates
Last Modified Date: March 31, 2022