
An official website of the United States government
An official website of the United States government
The .gov means it's official.
Federal government websites often end in .gov or .mil. Before sharing sensitive information,
make sure you're on a federal government site.
The site is secure.
The
https:// ensures that you are connecting to the official website and that any
information you provide is encrypted and transmitted securely.
Provide beauty services, such as cutting, coloring, and styling hair, and massaging and treating scalp. May shampoo hair, apply makeup, dress wigs, remove hair, and provide nail and skincare services. Excludes �Makeup Artists, Theatrical and Performance� (39-5091), �Manicurists and Pedicurists� (39-5092), and �Skincare Specialists� (39-5094).
Employment estimate and mean wage estimates for Hairdressers, Hairstylists, and Cosmetologists:
| Employment (1) | Employment RSE (3) |
Mean hourly wage |
Mean annual wage (2) |
Wage RSE (3) |
|---|---|---|---|---|
| 285,980 | 1.6 % | $ 17.30 | $ 35,990 | 1.3 % |
Percentile wage estimates for Hairdressers, Hairstylists, and Cosmetologists:
| Percentile | 10% | 25% | 50% (Median) |
75% | 90% |
|---|---|---|---|---|---|
| Hourly Wage | $ 10.03 | $ 11.52 | $ 14.26 | $ 18.65 | $ 28.40 |
| Annual Wage (2) | $ 20,860 | $ 23,960 | $ 29,670 | $ 38,790 | $ 59,070 |
Industries with the highest published employment and wages for Hairdressers, Hairstylists, and Cosmetologists are provided. For a list of all industries with employment in Hairdressers, Hairstylists, and Cosmetologists, see the Create Customized Tables function.
Industries with the highest levels of employment in Hairdressers, Hairstylists, and Cosmetologists:
| Industry | Employment (1) | Percent of industry employment | Hourly mean wage | Annual mean wage (2) |
|---|---|---|---|---|
| Personal Care Services | 253,060 | 38.88 | $ 17.34 | $ 36,080 |
| General Merchandise Stores | 13,790 | 0.45 | $ 17.68 | $ 36,770 |
| Health and Personal Care Stores | 11,690 | 1.16 | $ 13.59 | $ 28,260 |
| Motion Picture and Video Industries | 910 | 0.29 | $ 36.86 | $ 76,670 |
| Employment Services | 900 | 0.03 | $ 23.35 | $ 48,570 |
Industries with the highest concentration of employment in Hairdressers, Hairstylists, and Cosmetologists:
| Industry | Employment (1) | Percent of industry employment | Hourly mean wage | Annual mean wage (2) |
|---|---|---|---|---|
| Personal Care Services | 253,060 | 38.88 | $ 17.34 | $ 36,080 |
| Health and Personal Care Stores | 11,690 | 1.16 | $ 13.59 | $ 28,260 |
| General Merchandise Stores | 13,790 | 0.45 | $ 17.68 | $ 36,770 |
| Motion Picture and Video Industries | 910 | 0.29 | $ 36.86 | $ 76,670 |
| Death Care Services | 180 | 0.14 | $ 20.28 | $ 42,170 |
Top paying industries for Hairdressers, Hairstylists, and Cosmetologists:
| Industry | Employment (1) | Percent of industry employment | Hourly mean wage | Annual mean wage (2) |
|---|---|---|---|---|
| Motion Picture and Video Industries | 910 | 0.29 | $ 36.86 | $ 76,670 |
| Other Professional, Scientific, and Technical Services | 30 | (7) | $ 28.04 | $ 58,320 |
| Employment Services | 900 | 0.03 | $ 23.35 | $ 48,570 |
| Offices of Physicians | (8) | (8) | $ 22.35 | $ 46,490 |
| Other Amusement and Recreation Industries | 440 | 0.04 | $ 21.41 | $ 44,530 |
States and areas with the highest published employment, location quotients, and wages for Hairdressers, Hairstylists, and Cosmetologists are provided. For a list of all areas with employment in Hairdressers, Hairstylists, and Cosmetologists, see the Create Customized Tables function.
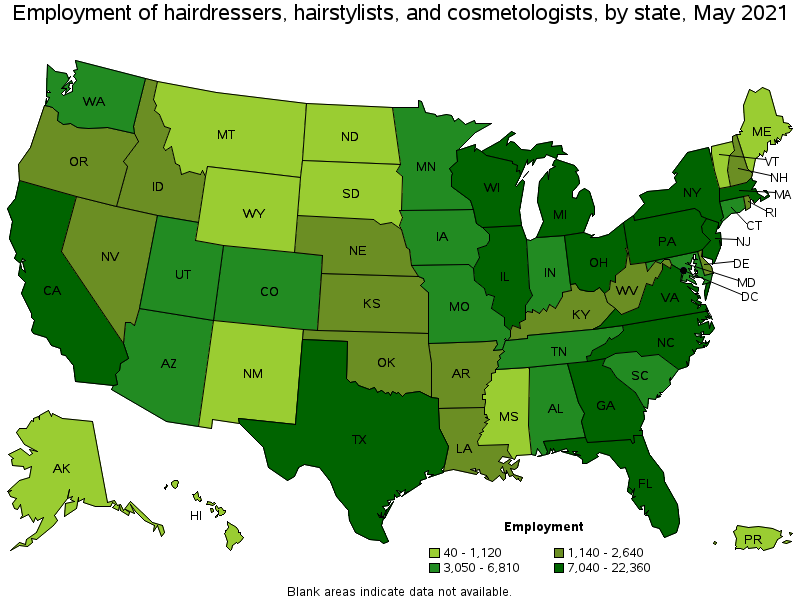
States with the highest employment level in Hairdressers, Hairstylists, and Cosmetologists:
| State | Employment (1) | Employment per thousand jobs | Location quotient (9) | Hourly mean wage | Annual mean wage (2) |
|---|---|---|---|---|---|
| Texas | 22,360 | 1.83 | 0.90 | $ 14.27 | $ 29,680 |
| Pennsylvania | 20,330 | 3.64 | 1.79 | $ 16.54 | $ 34,400 |
| California | 18,630 | 1.13 | 0.56 | $ 18.65 | $ 38,790 |
| Florida | 18,540 | 2.15 | 1.06 | $ 16.19 | $ 33,680 |
| New York | 16,650 | 1.92 | 0.95 | $ 19.39 | $ 40,330 |
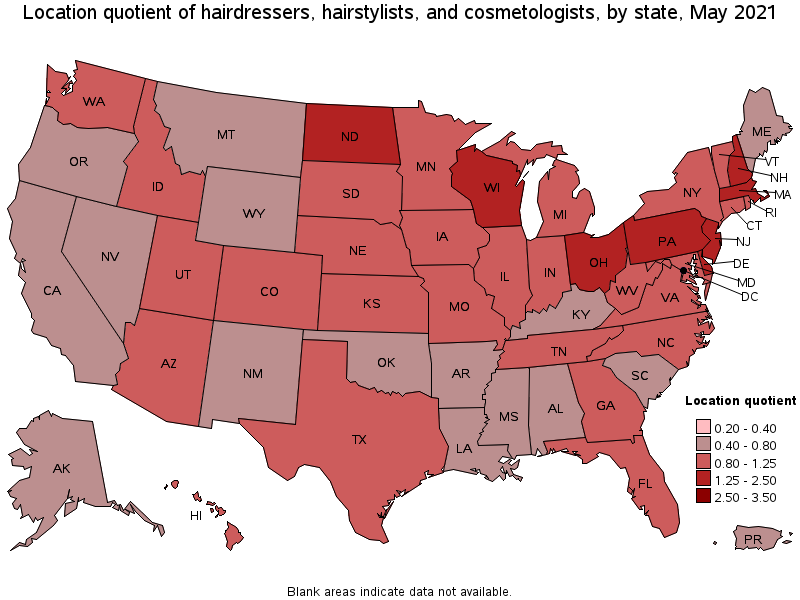
States with the highest concentration of jobs and location quotients in Hairdressers, Hairstylists, and Cosmetologists:
| State | Employment (1) | Employment per thousand jobs | Location quotient (9) | Hourly mean wage | Annual mean wage (2) |
|---|---|---|---|---|---|
| Delaware | 1,680 | 3.86 | 1.90 | $ 17.62 | $ 36,650 |
| Pennsylvania | 20,330 | 3.64 | 1.79 | $ 16.54 | $ 34,400 |
| New Jersey | 13,960 | 3.63 | 1.79 | $ 18.93 | $ 39,370 |
| New Hampshire | 1,860 | 2.93 | 1.44 | $ 16.42 | $ 34,140 |
| Massachusetts | 9,930 | 2.92 | 1.44 | $ 21.27 | $ 44,240 |
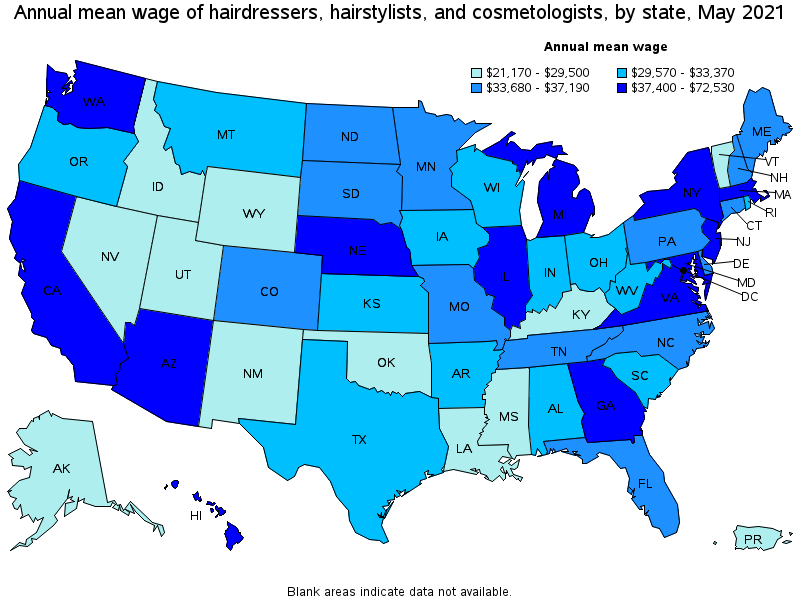
Top paying states for Hairdressers, Hairstylists, and Cosmetologists:
| State | Employment (1) | Employment per thousand jobs | Location quotient (9) | Hourly mean wage | Annual mean wage (2) |
|---|---|---|---|---|---|
| District of Columbia | 550 | 0.83 | 0.41 | $ 34.87 | $ 72,530 |
| Massachusetts | 9,930 | 2.92 | 1.44 | $ 21.27 | $ 44,240 |
| Michigan | 8,300 | 2.05 | 1.01 | $ 21.19 | $ 44,070 |
| Washington | 6,710 | 2.09 | 1.03 | $ 20.96 | $ 43,590 |
| Hawaii | 1,120 | 2.04 | 1.00 | $ 20.85 | $ 43,370 |
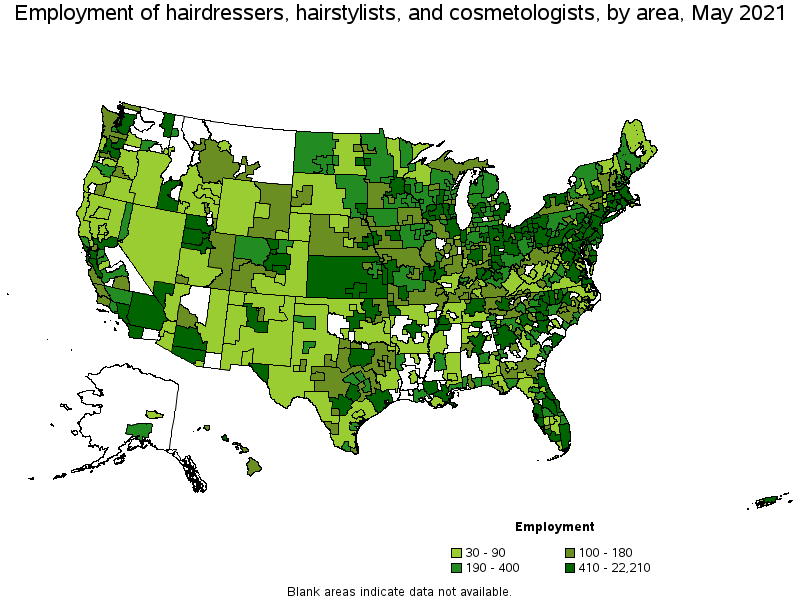
Metropolitan areas with the highest employment level in Hairdressers, Hairstylists, and Cosmetologists:
| Metropolitan area | Employment (1) | Employment per thousand jobs | Location quotient (9) | Hourly mean wage | Annual mean wage (2) |
|---|---|---|---|---|---|
| New York-Newark-Jersey City, NY-NJ-PA | 22,210 | 2.56 | 1.26 | $ 19.67 | $ 40,920 |
| Chicago-Naperville-Elgin, IL-IN-WI | 11,920 | 2.81 | 1.39 | $ 20.39 | $ 42,400 |
| Philadelphia-Camden-Wilmington, PA-NJ-DE-MD | 9,820 | 3.70 | 1.82 | $ 17.53 | $ 36,460 |
| Boston-Cambridge-Nashua, MA-NH | 8,600 | 3.32 | 1.64 | $ 20.90 | $ 43,480 |
| Dallas-Fort Worth-Arlington, TX | 7,130 | 1.99 | 0.98 | $ 15.05 | $ 31,310 |
| Los Angeles-Long Beach-Anaheim, CA | 6,090 | 1.07 | 0.52 | $ 20.20 | $ 42,010 |
| Washington-Arlington-Alexandria, DC-VA-MD-WV | 5,820 | 1.99 | 0.98 | $ 21.83 | $ 45,400 |
| Houston-The Woodlands-Sugar Land, TX | 5,630 | 1.94 | 0.96 | $ 13.99 | $ 29,090 |
| Phoenix-Mesa-Scottsdale, AZ | 5,500 | 2.60 | 1.28 | $ 19.51 | $ 40,590 |
| Atlanta-Sandy Springs-Roswell, GA | 5,460 | 2.11 | 1.04 | $ 19.05 | $ 39,620 |
Metropolitan areas with the highest concentration of jobs and location quotients in Hairdressers, Hairstylists, and Cosmetologists:
| Metropolitan area | Employment (1) | Employment per thousand jobs | Location quotient (9) | Hourly mean wage | Annual mean wage (2) |
|---|---|---|---|---|---|
| Altoona, PA | 320 | 5.60 | 2.76 | $ 15.00 | $ 31,200 |
| Ocean City, NJ | 200 | 5.07 | 2.50 | $ 17.90 | $ 37,230 |
| Johnstown, PA | 240 | 5.05 | 2.49 | $ 15.88 | $ 33,030 |
| Sebastian-Vero Beach, FL | 230 | 4.43 | 2.18 | $ 17.17 | $ 35,710 |
| Pittsburgh, PA | 4,580 | 4.39 | 2.16 | $ 16.62 | $ 34,570 |
| Reading, PA | 710 | 4.37 | 2.16 | $ 16.94 | $ 35,240 |
| East Stroudsburg, PA | 230 | 4.35 | 2.14 | $ 15.31 | $ 31,840 |
| Homosassa Springs, FL | 140 | 4.35 | 2.14 | $ 15.45 | $ 32,140 |
| Allentown-Bethlehem-Easton, PA-NJ | 1,510 | 4.35 | 2.14 | $ 16.51 | $ 34,340 |
| Naples-Immokalee-Marco Island, FL | 620 | 4.27 | 2.10 | $ 19.36 | $ 40,260 |
Top paying metropolitan areas for Hairdressers, Hairstylists, and Cosmetologists:
| Metropolitan area | Employment (1) | Employment per thousand jobs | Location quotient (9) | Hourly mean wage | Annual mean wage (2) |
|---|---|---|---|---|---|
| Kalamazoo-Portage, MI | 280 | 2.07 | 1.02 | $ 25.78 | $ 53,630 |
| Lansing-East Lansing, MI | 380 | 1.91 | 0.94 | $ 25.71 | $ 53,470 |
| Barnstable Town, MA | 330 | 3.40 | 1.68 | $ 25.30 | $ 52,630 |
| Muskegon, MI | 120 | 2.03 | 1.00 | $ 23.80 | $ 49,500 |
| Kahului-Wailuku-Lahaina, HI | 100 | 1.62 | 0.80 | $ 22.25 | $ 46,290 |
| Grand Rapids-Wyoming, MI | 1,250 | 2.47 | 1.22 | $ 22.15 | $ 46,070 |
| Washington-Arlington-Alexandria, DC-VA-MD-WV | 5,820 | 1.99 | 0.98 | $ 21.83 | $ 45,400 |
| Durham-Chapel Hill, NC | 410 | 1.32 | 0.65 | $ 21.62 | $ 44,960 |
| Bremerton-Silverdale, WA | 210 | 2.48 | 1.22 | $ 21.38 | $ 44,460 |
| Worcester, MA-CT | 530 | 1.97 | 0.97 | $ 21.33 | $ 44,370 |
Nonmetropolitan areas with the highest employment in Hairdressers, Hairstylists, and Cosmetologists:
| Nonmetropolitan area | Employment (1) | Employment per thousand jobs | Location quotient (9) | Hourly mean wage | Annual mean wage (2) |
|---|---|---|---|---|---|
| North Northeastern Ohio nonmetropolitan area (noncontiguous) | 770 | 2.45 | 1.21 | $ 12.33 | $ 25,650 |
| Western Pennsylvania nonmetropolitan area | 560 | 4.04 | 1.99 | $ 15.91 | $ 33,090 |
| Southern Pennsylvania nonmetropolitan area | 520 | 2.86 | 1.41 | $ 14.60 | $ 30,360 |
| South Central Wisconsin nonmetropolitan area | 470 | 2.34 | 1.15 | $ 13.85 | $ 28,800 |
| Kansas nonmetropolitan area | 460 | 1.21 | 0.60 | $ 13.83 | $ 28,760 |
Nonmetropolitan areas with the highest concentration of jobs and location quotients in Hairdressers, Hairstylists, and Cosmetologists:
| Nonmetropolitan area | Employment (1) | Employment per thousand jobs | Location quotient (9) | Hourly mean wage | Annual mean wage (2) |
|---|---|---|---|---|---|
| Western Pennsylvania nonmetropolitan area | 560 | 4.04 | 1.99 | $ 15.91 | $ 33,090 |
| Eastern Ohio nonmetropolitan area | 390 | 3.05 | 1.50 | $ 12.69 | $ 26,400 |
| Southern Pennsylvania nonmetropolitan area | 520 | 2.86 | 1.41 | $ 14.60 | $ 30,360 |
| Northeast Lower Peninsula of Michigan nonmetropolitan area | 200 | 2.79 | 1.37 | $ 17.21 | $ 35,800 |
| Northern Pennsylvania nonmetropolitan area | 360 | 2.45 | 1.21 | $ 14.99 | $ 31,180 |
Top paying nonmetropolitan areas for Hairdressers, Hairstylists, and Cosmetologists:
| Nonmetropolitan area | Employment (1) | Employment per thousand jobs | Location quotient (9) | Hourly mean wage | Annual mean wage (2) |
|---|---|---|---|---|---|
| Upper Peninsula of Michigan nonmetropolitan area | 160 | 1.56 | 0.77 | $ 22.67 | $ 47,150 |
| Massachusetts nonmetropolitan area | 90 | 1.58 | 0.78 | $ 22.48 | $ 46,750 |
| Western Washington nonmetropolitan area | 140 | 1.17 | 0.58 | $ 21.13 | $ 43,950 |
| Arizona nonmetropolitan area | 40 | 0.41 | 0.20 | $ 19.00 | $ 39,520 |
| North Valley-Northern Mountains Region of California nonmetropolitan area | 50 | 0.47 | 0.23 | $ 18.74 | $ 38,990 |
These estimates are calculated with data collected from employers in all industry sectors, all metropolitan and nonmetropolitan areas, and all states and the District of Columbia. The top employment and wage figures are provided above. The complete list is available in the downloadable XLS files.
The percentile wage estimate is the value of a wage below which a certain percent of workers fall. The median wage is the 50th percentile wage estimate—50 percent of workers earn less than the median and 50 percent of workers earn more than the median. More about percentile wages.
(1) Estimates for detailed occupations do not sum to the totals because the totals include occupations not shown separately. Estimates do not include self-employed workers.
(2) Annual wages have been calculated by multiplying the hourly mean wage by a "year-round, full-time" hours figure of 2,080 hours; for those occupations where there is not an hourly wage published, the annual wage has been directly calculated from the reported survey data.
(3) The relative standard error (RSE) is a measure of the reliability of a survey statistic. The smaller the relative standard error, the more precise the estimate.
(7) The value is less than .005 percent of industry employment.
(8) Estimate not released.
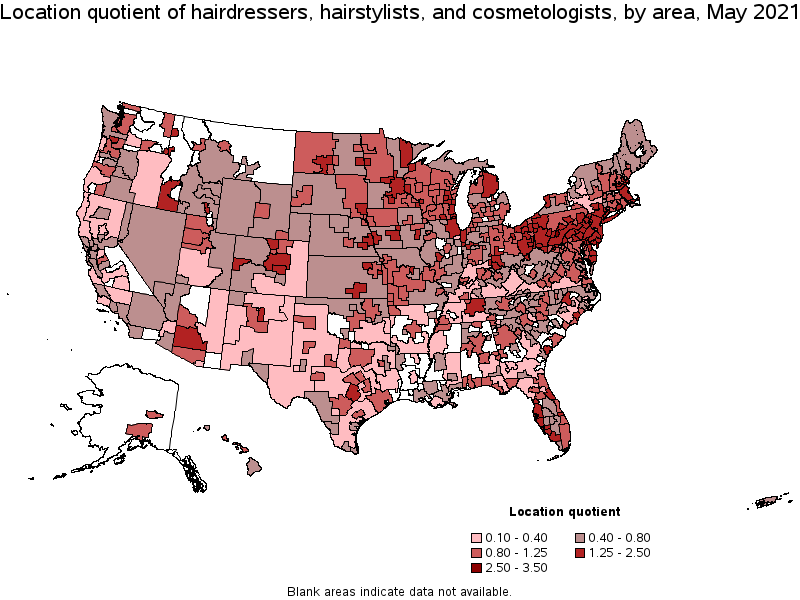
(9) The location quotient is the ratio of the area concentration of occupational employment to the national average concentration. A location quotient greater than one indicates the occupation has a higher share of employment than average, and a location quotient less than one indicates the occupation is less prevalent in the area than average.
Other OEWS estimates and related information:
May 2021 National Occupational Employment and Wage Estimates
May 2021 State Occupational Employment and Wage Estimates
May 2021 Metropolitan and Nonmetropolitan Area Occupational Employment and Wage Estimates
May 2021 National Industry-Specific Occupational Employment and Wage Estimates
Last Modified Date: March 31, 2022