
An official website of the United States government
An official website of the United States government
The .gov means it's official.
Federal government websites often end in .gov or .mil. Before sharing sensitive information,
make sure you're on a federal government site.
The site is secure.
The
https:// ensures that you are connecting to the official website and that any
information you provide is encrypted and transmitted securely.
Provide skincare treatments to face and body to enhance an individual�s appearance. Includes electrologists and laser hair removal specialists.
Employment estimate and mean wage estimates for Skincare Specialists:
| Employment (1) | Employment RSE (3) |
Mean hourly wage |
Mean annual wage (2) |
Wage RSE (3) |
|---|---|---|---|---|
| 50,580 | 9.1 % | $ 20.05 | $ 41,700 | 2.4 % |
Percentile wage estimates for Skincare Specialists:
| Percentile | 10% | 25% | 50% (Median) |
75% | 90% |
|---|---|---|---|---|---|
| Hourly Wage | $ 11.10 | $ 14.06 | $ 17.93 | $ 22.83 | $ 31.58 |
| Annual Wage (2) | $ 23,100 | $ 29,240 | $ 37,300 | $ 47,490 | $ 65,680 |
Industries with the highest published employment and wages for Skincare Specialists are provided. For a list of all industries with employment in Skincare Specialists, see the Create Customized Tables function.
Industries with the highest levels of employment in Skincare Specialists:
| Industry | Employment (1) | Percent of industry employment | Hourly mean wage | Annual mean wage (2) |
|---|---|---|---|---|
| Personal Care Services | 33,440 | 5.14 | $ 20.29 | $ 42,190 |
| Offices of Physicians | 5,730 | 0.21 | $ 21.25 | $ 44,190 |
| Health and Personal Care Stores | 5,640 | 0.56 | $ 16.92 | $ 35,180 |
| Offices of Other Health Practitioners | 1,620 | 0.17 | $ 20.59 | $ 42,840 |
| Traveler Accommodation | 1,280 | 0.09 | $ 16.40 | $ 34,120 |
Industries with the highest concentration of employment in Skincare Specialists:
| Industry | Employment (1) | Percent of industry employment | Hourly mean wage | Annual mean wage (2) |
|---|---|---|---|---|
| Personal Care Services | 33,440 | 5.14 | $ 20.29 | $ 42,190 |
| Health and Personal Care Stores | 5,640 | 0.56 | $ 16.92 | $ 35,180 |
| Offices of Physicians | 5,730 | 0.21 | $ 21.25 | $ 44,190 |
| Offices of Other Health Practitioners | 1,620 | 0.17 | $ 20.59 | $ 42,840 |
| Traveler Accommodation | 1,280 | 0.09 | $ 16.40 | $ 34,120 |
Top paying industries for Skincare Specialists:
| Industry | Employment (1) | Percent of industry employment | Hourly mean wage | Annual mean wage (2) |
|---|---|---|---|---|
| Other Amusement and Recreation Industries | 750 | 0.07 | $ 32.87 | $ 68,370 |
| Employment Services | 130 | (7) | $ 23.29 | $ 48,440 |
| General Medical and Surgical Hospitals | 140 | (7) | $ 21.96 | $ 45,670 |
| Outpatient Care Centers | 240 | 0.02 | $ 21.30 | $ 44,300 |
| Offices of Physicians | 5,730 | 0.21 | $ 21.25 | $ 44,190 |
States and areas with the highest published employment, location quotients, and wages for Skincare Specialists are provided. For a list of all areas with employment in Skincare Specialists, see the Create Customized Tables function.
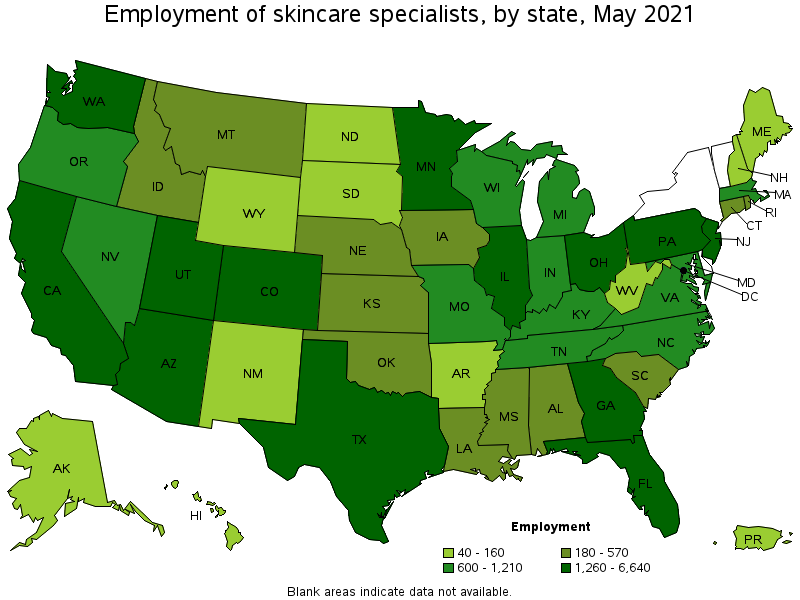
States with the highest employment level in Skincare Specialists:
| State | Employment (1) | Employment per thousand jobs | Location quotient (9) | Hourly mean wage | Annual mean wage (2) |
|---|---|---|---|---|---|
| California | 6,640 | 0.40 | 1.12 | $ 21.55 | $ 44,830 |
| Florida | 4,690 | 0.55 | 1.52 | $ 19.75 | $ 41,090 |
| Texas | 4,340 | 0.35 | 0.99 | $ 17.74 | $ 36,890 |
| Washington | 1,680 | 0.52 | 1.46 | $ 30.27 | $ 62,960 |
| Arizona | 1,660 | 0.58 | 1.61 | $ 18.81 | $ 39,130 |
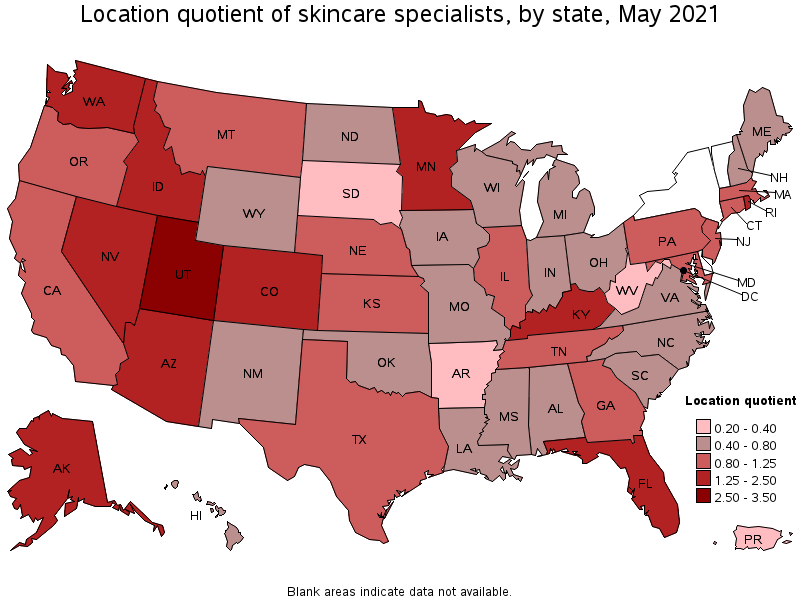
States with the highest concentration of jobs and location quotients in Skincare Specialists:
| State | Employment (1) | Employment per thousand jobs | Location quotient (9) | Hourly mean wage | Annual mean wage (2) |
|---|---|---|---|---|---|
| Utah | 1,440 | 0.92 | 2.57 | $ 20.75 | $ 43,150 |
| Nevada | 1,020 | 0.79 | 2.21 | $ 15.97 | $ 33,220 |
| Idaho | 570 | 0.75 | 2.10 | $ 18.84 | $ 39,180 |
| Rhode Island | 320 | 0.69 | 1.92 | $ 16.38 | $ 34,070 |
| Arizona | 1,660 | 0.58 | 1.61 | $ 18.81 | $ 39,130 |
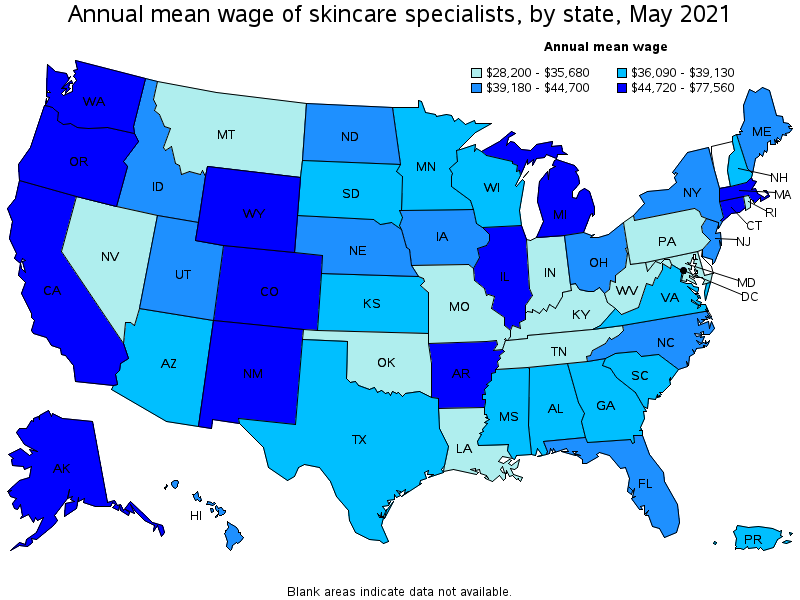
Top paying states for Skincare Specialists:
| State | Employment (1) | Employment per thousand jobs | Location quotient (9) | Hourly mean wage | Annual mean wage (2) |
|---|---|---|---|---|---|
| District of Columbia | 160 | 0.24 | 0.68 | $ 37.29 | $ 77,560 |
| Connecticut | 560 | 0.36 | 0.99 | $ 30.74 | $ 63,940 |
| Washington | 1,680 | 0.52 | 1.46 | $ 30.27 | $ 62,960 |
| Illinois | 1,630 | 0.29 | 0.81 | $ 25.72 | $ 53,490 |
| New Mexico | 140 | 0.18 | 0.49 | $ 25.32 | $ 52,660 |
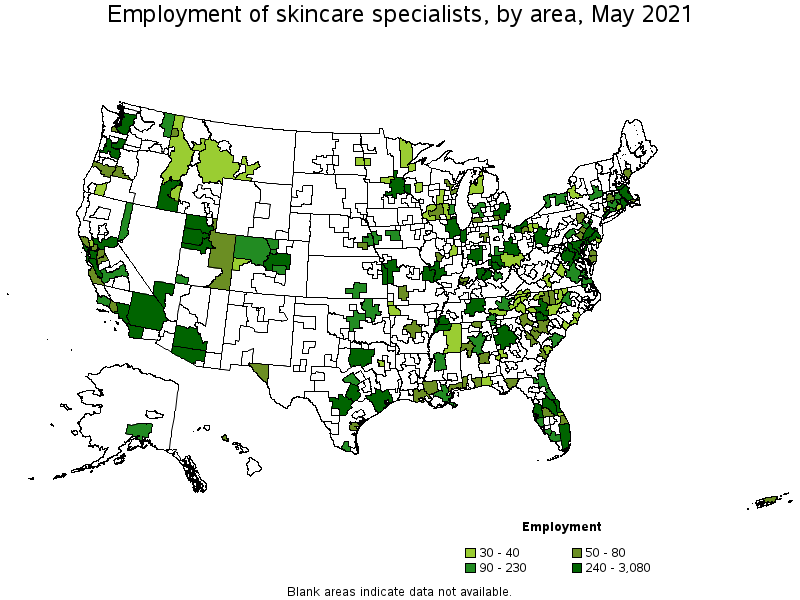
Metropolitan areas with the highest employment level in Skincare Specialists:
| Metropolitan area | Employment (1) | Employment per thousand jobs | Location quotient (9) | Hourly mean wage | Annual mean wage (2) |
|---|---|---|---|---|---|
| Los Angeles-Long Beach-Anaheim, CA | 3,080 | 0.54 | 1.50 | $ 19.77 | $ 41,130 |
| Miami-Fort Lauderdale-West Palm Beach, FL | 1,930 | 0.79 | 2.19 | $ 19.22 | $ 39,980 |
| Chicago-Naperville-Elgin, IL-IN-WI | 1,400 | 0.33 | 0.92 | $ 26.74 | $ 55,620 |
| Seattle-Tacoma-Bellevue, WA | 1,230 | 0.64 | 1.79 | $ 31.03 | $ 64,550 |
| Houston-The Woodlands-Sugar Land, TX | 1,210 | 0.42 | 1.17 | $ 18.19 | $ 37,830 |
| Phoenix-Mesa-Scottsdale, AZ | 1,200 | 0.57 | 1.58 | $ 19.11 | $ 39,760 |
| San Francisco-Oakland-Hayward, CA | 1,140 | 0.51 | 1.41 | $ 22.63 | $ 47,060 |
| Minneapolis-St. Paul-Bloomington, MN-WI | 1,070 | 0.59 | 1.64 | $ 18.27 | $ 38,010 |
| Dallas-Fort Worth-Arlington, TX | 1,040 | 0.29 | 0.81 | $ 18.52 | $ 38,510 |
| Philadelphia-Camden-Wilmington, PA-NJ-DE-MD | 1,030 | 0.39 | 1.08 | $ 17.94 | $ 37,310 |
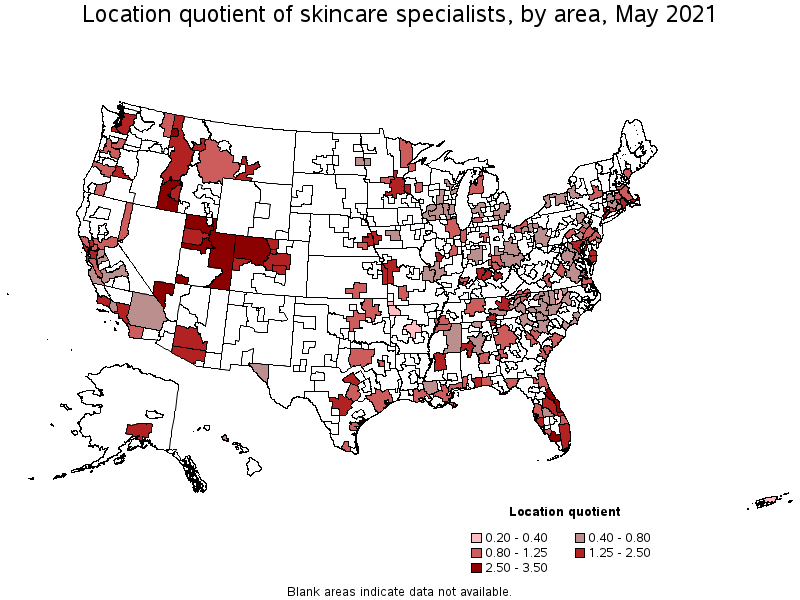
Metropolitan areas with the highest concentration of jobs and location quotients in Skincare Specialists:
| Metropolitan area | Employment (1) | Employment per thousand jobs | Location quotient (9) | Hourly mean wage | Annual mean wage (2) |
|---|---|---|---|---|---|
| Palm Bay-Melbourne-Titusville, FL | 270 | 1.20 | 3.34 | $ 20.42 | $ 42,480 |
| Provo-Orem, UT | 320 | 1.18 | 3.29 | $ 21.82 | $ 45,390 |
| St. George, UT | 90 | 1.14 | 3.17 | $ 22.36 | $ 46,520 |
| Ogden-Clearfield, UT | 300 | 1.11 | 3.09 | $ 21.39 | $ 44,480 |
| Deltona-Daytona Beach-Ormond Beach, FL | 210 | 1.07 | 2.98 | $ 14.28 | $ 29,700 |
| Coeur d'Alene, ID | 70 | 1.05 | 2.92 | $ 18.59 | $ 38,660 |
| Naples-Immokalee-Marco Island, FL | 140 | 0.99 | 2.75 | $ 22.85 | $ 47,530 |
| Las Vegas-Henderson-Paradise, NV | 900 | 0.98 | 2.73 | $ 16.03 | $ 33,330 |
| Boise City, ID | 310 | 0.92 | 2.57 | $ 19.06 | $ 39,650 |
| Sebastian-Vero Beach, FL | 40 | 0.87 | 2.42 | $ 21.81 | $ 45,370 |
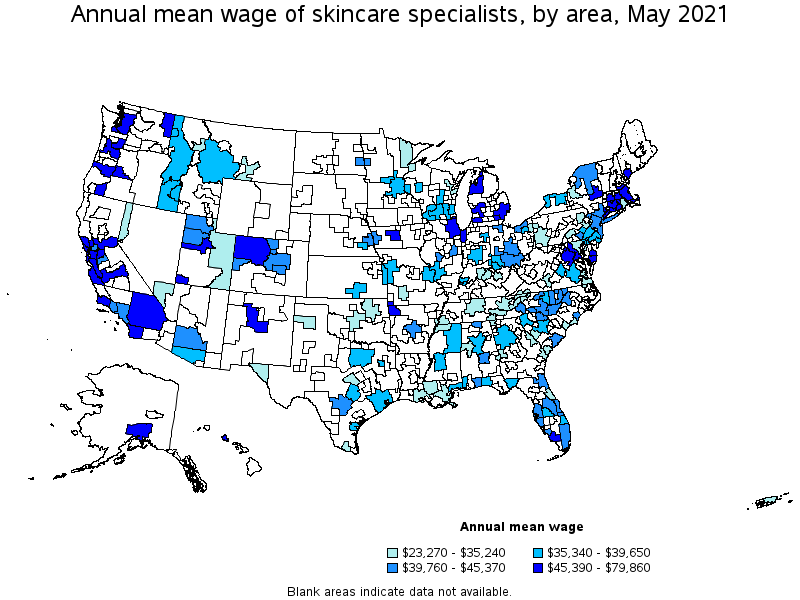
Top paying metropolitan areas for Skincare Specialists:
| Metropolitan area | Employment (1) | Employment per thousand jobs | Location quotient (9) | Hourly mean wage | Annual mean wage (2) |
|---|---|---|---|---|---|
| Olympia-Tumwater, WA | 70 | 0.63 | 1.75 | $ 38.40 | $ 79,860 |
| Hartford-West Hartford-East Hartford, CT | 110 | 0.20 | 0.55 | $ 32.57 | $ 67,750 |
| Danbury, CT | 30 | 0.48 | 1.34 | $ 32.44 | $ 67,480 |
| Seattle-Tacoma-Bellevue, WA | 1,230 | 0.64 | 1.79 | $ 31.03 | $ 64,550 |
| Bridgeport-Stamford-Norwalk, CT | 260 | 0.70 | 1.96 | $ 30.55 | $ 63,540 |
| New Haven, CT | 100 | 0.37 | 1.03 | $ 30.28 | $ 62,990 |
| Albuquerque, NM | (8) | (8) | (8) | $ 27.01 | $ 56,180 |
| Grand Rapids-Wyoming, MI | 90 | 0.18 | 0.49 | $ 26.98 | $ 56,110 |
| Santa Maria-Santa Barbara, CA | 100 | 0.49 | 1.37 | $ 26.85 | $ 55,840 |
| Chicago-Naperville-Elgin, IL-IN-WI | 1,400 | 0.33 | 0.92 | $ 26.74 | $ 55,620 |
Nonmetropolitan areas with the highest employment in Skincare Specialists:
| Nonmetropolitan area | Employment (1) | Employment per thousand jobs | Location quotient (9) | Hourly mean wage | Annual mean wage (2) |
|---|---|---|---|---|---|
| Northwest Colorado nonmetropolitan area | 110 | 0.94 | 2.62 | $ 23.89 | $ 49,680 |
| Eastern Utah nonmetropolitan area | 80 | 0.95 | 2.65 | $ 16.16 | $ 33,620 |
| Southwest Montana nonmetropolitan area | 40 | 0.30 | 0.84 | $ 17.77 | $ 36,950 |
| Northwest Lower Peninsula of Michigan nonmetropolitan area | 40 | 0.36 | 0.99 | $ 22.28 | $ 46,340 |
| Northwestern Idaho nonmetropolitan area | 40 | 0.56 | 1.56 | $ 17.37 | $ 36,140 |
Nonmetropolitan areas with the highest concentration of jobs and location quotients in Skincare Specialists:
| Nonmetropolitan area | Employment (1) | Employment per thousand jobs | Location quotient (9) | Hourly mean wage | Annual mean wage (2) |
|---|---|---|---|---|---|
| Eastern Utah nonmetropolitan area | 80 | 0.95 | 2.65 | $ 16.16 | $ 33,620 |
| Northwest Colorado nonmetropolitan area | 110 | 0.94 | 2.62 | $ 23.89 | $ 49,680 |
| Northwestern Idaho nonmetropolitan area | 40 | 0.56 | 1.56 | $ 17.37 | $ 36,140 |
| Northwest Lower Peninsula of Michigan nonmetropolitan area | 40 | 0.36 | 0.99 | $ 22.28 | $ 46,340 |
| Southwest Montana nonmetropolitan area | 40 | 0.30 | 0.84 | $ 17.77 | $ 36,950 |
Top paying nonmetropolitan areas for Skincare Specialists:
| Nonmetropolitan area | Employment (1) | Employment per thousand jobs | Location quotient (9) | Hourly mean wage | Annual mean wage (2) |
|---|---|---|---|---|---|
| Northwest Colorado nonmetropolitan area | 110 | 0.94 | 2.62 | $ 23.89 | $ 49,680 |
| Northwest Lower Peninsula of Michigan nonmetropolitan area | 40 | 0.36 | 0.99 | $ 22.28 | $ 46,340 |
| Capital/Northern New York nonmetropolitan area | (8) | (8) | (8) | $ 20.72 | $ 43,110 |
| Piedmont North Carolina nonmetropolitan area | 40 | 0.14 | 0.40 | $ 20.42 | $ 42,480 |
| Southern Ohio nonmetropolitan area | 40 | 0.24 | 0.66 | $ 20.32 | $ 42,270 |
These estimates are calculated with data collected from employers in all industry sectors, all metropolitan and nonmetropolitan areas, and all states and the District of Columbia. The top employment and wage figures are provided above. The complete list is available in the downloadable XLS files.
The percentile wage estimate is the value of a wage below which a certain percent of workers fall. The median wage is the 50th percentile wage estimate—50 percent of workers earn less than the median and 50 percent of workers earn more than the median. More about percentile wages.
(1) Estimates for detailed occupations do not sum to the totals because the totals include occupations not shown separately. Estimates do not include self-employed workers.
(2) Annual wages have been calculated by multiplying the hourly mean wage by a "year-round, full-time" hours figure of 2,080 hours; for those occupations where there is not an hourly wage published, the annual wage has been directly calculated from the reported survey data.
(3) The relative standard error (RSE) is a measure of the reliability of a survey statistic. The smaller the relative standard error, the more precise the estimate.
(7) The value is less than .005 percent of industry employment.
(8) Estimate not released.
(9) The location quotient is the ratio of the area concentration of occupational employment to the national average concentration. A location quotient greater than one indicates the occupation has a higher share of employment than average, and a location quotient less than one indicates the occupation is less prevalent in the area than average.
Other OEWS estimates and related information:
May 2021 National Occupational Employment and Wage Estimates
May 2021 State Occupational Employment and Wage Estimates
May 2021 Metropolitan and Nonmetropolitan Area Occupational Employment and Wage Estimates
May 2021 National Industry-Specific Occupational Employment and Wage Estimates
Last Modified Date: March 31, 2022