
An official website of the United States government
An official website of the United States government
The .gov means it's official.
Federal government websites often end in .gov or .mil. Before sharing sensitive information,
make sure you're on a federal government site.
The site is secure.
The
https:// ensures that you are connecting to the official website and that any
information you provide is encrypted and transmitted securely.
This occupation includes the 2018 SOC occupations 39-7011 Tour Guides and Escorts and 39-7012 Travel Guides.
Employment estimate and mean wage estimates for Tour and Travel Guides:
| Employment (1) | Employment RSE (3) |
Mean hourly wage |
Mean annual wage (2) |
Wage RSE (3) |
|---|---|---|---|---|
| 30,980 | 3.1 % | $ 15.96 | $ 33,200 | 1.7 % |
Percentile wage estimates for Tour and Travel Guides:
| Percentile | 10% | 25% | 50% (Median) |
75% | 90% |
|---|---|---|---|---|---|
| Hourly Wage | $ 10.07 | $ 11.68 | $ 14.32 | $ 18.11 | $ 22.98 |
| Annual Wage (2) | $ 20,950 | $ 24,300 | $ 29,780 | $ 37,670 | $ 47,800 |
Industries with the highest published employment and wages for Tour and Travel Guides are provided. For a list of all industries with employment in Tour and Travel Guides, see the Create Customized Tables function.
Industries with the highest levels of employment in Tour and Travel Guides:
| Industry | Employment (1) | Percent of industry employment | Hourly mean wage | Annual mean wage (2) |
|---|---|---|---|---|
| Museums, Historical Sites, and Similar Institutions | 10,320 | 7.83 | $ 14.13 | $ 29,380 |
| Other Amusement and Recreation Industries | 5,840 | 0.53 | $ 17.24 | $ 35,860 |
| Travel Arrangement and Reservation Services | 4,040 | 3.05 | $ 18.53 | $ 38,540 |
| Local Government, excluding schools and hospitals (OEWS Designation) | 1,180 | 0.02 | $ 13.81 | $ 28,730 |
| Scenic and Sightseeing Transportation, Land | 1,080 | 15.51 | $ 15.38 | $ 31,990 |
Industries with the highest concentration of employment in Tour and Travel Guides:
| Industry | Employment (1) | Percent of industry employment | Hourly mean wage | Annual mean wage (2) |
|---|---|---|---|---|
| Scenic and Sightseeing Transportation, Land | 1,080 | 15.51 | $ 15.38 | $ 31,990 |
| Museums, Historical Sites, and Similar Institutions | 10,320 | 7.83 | $ 14.13 | $ 29,380 |
| Scenic and Sightseeing Transportation, Water | 540 | 4.81 | $ 17.74 | $ 36,900 |
| Travel Arrangement and Reservation Services | 4,040 | 3.05 | $ 18.53 | $ 38,540 |
| RV (Recreational Vehicle) Parks and Recreational Camps | 390 | 0.70 | $ 18.88 | $ 39,270 |
Top paying industries for Tour and Travel Guides:
| Industry | Employment (1) | Percent of industry employment | Hourly mean wage | Annual mean wage (2) |
|---|---|---|---|---|
| Deep Sea, Coastal, and Great Lakes Water Transportation | 90 | 0.27 | $ 26.07 | $ 54,230 |
| Sporting Goods, Hobby, and Musical Instrument Stores | 300 | 0.07 | $ 23.50 | $ 48,880 |
| Performing Arts Companies | 80 | 0.12 | $ 20.07 | $ 41,750 |
| Social Advocacy Organizations | 80 | 0.03 | $ 18.99 | $ 39,490 |
| RV (Recreational Vehicle) Parks and Recreational Camps | 390 | 0.70 | $ 18.88 | $ 39,270 |
States and areas with the highest published employment, location quotients, and wages for Tour and Travel Guides are provided. For a list of all areas with employment in Tour and Travel Guides, see the Create Customized Tables function.
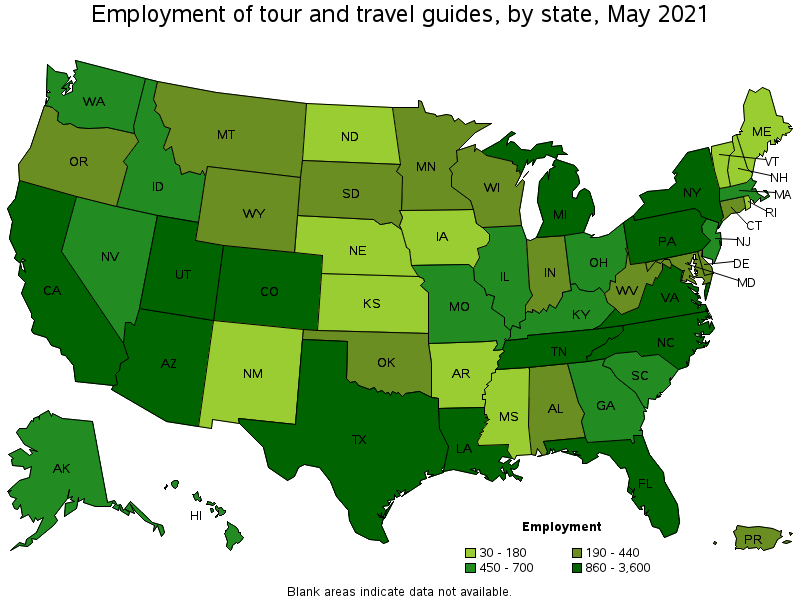
States with the highest employment level in Tour and Travel Guides:
| State | Employment (1) | Employment per thousand jobs | Location quotient (9) | Hourly mean wage | Annual mean wage (2) |
|---|---|---|---|---|---|
| California | 3,600 | 0.22 | 0.99 | $ 18.74 | $ 38,980 |
| Florida | 1,820 | 0.21 | 0.96 | $ 15.79 | $ 32,850 |
| Colorado | 1,440 | 0.55 | 2.50 | $ 18.64 | $ 38,760 |
| Virginia | 1,430 | 0.38 | 1.73 | $ 15.45 | $ 32,130 |
| Texas | 1,420 | 0.12 | 0.53 | $ 16.11 | $ 33,510 |
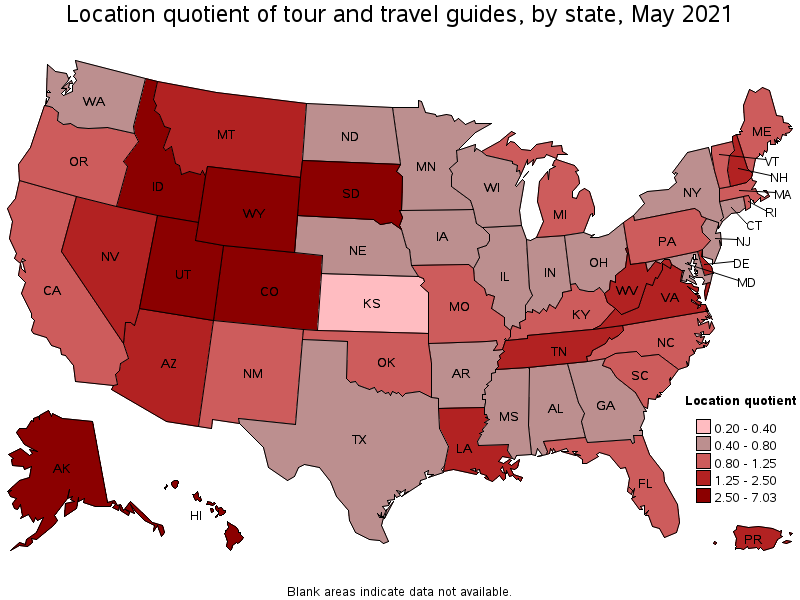
States with the highest concentration of jobs and location quotients in Tour and Travel Guides:
| State | Employment (1) | Employment per thousand jobs | Location quotient (9) | Hourly mean wage | Annual mean wage (2) |
|---|---|---|---|---|---|
| Alaska | 460 | 1.55 | 7.03 | $ 18.48 | $ 38,450 |
| Wyoming | 340 | 1.30 | 5.91 | $ 17.53 | $ 36,460 |
| Hawaii | 490 | 0.89 | 4.06 | $ 16.30 | $ 33,910 |
| South Dakota | 350 | 0.84 | 3.83 | $ 14.16 | $ 29,450 |
| Utah | 1,120 | 0.72 | 3.27 | $ 15.24 | $ 31,710 |
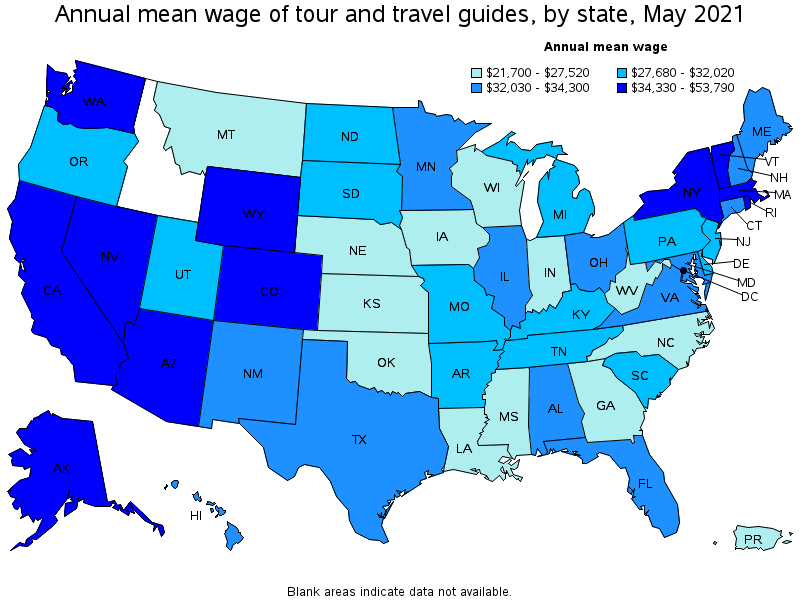
Top paying states for Tour and Travel Guides:
| State | Employment (1) | Employment per thousand jobs | Location quotient (9) | Hourly mean wage | Annual mean wage (2) |
|---|---|---|---|---|---|
| Washington | 540 | 0.17 | 0.76 | $ 22.58 | $ 46,960 |
| District of Columbia | (8) | (8) | (8) | $ 22.54 | $ 46,890 |
| New York | 1,080 | 0.12 | 0.56 | $ 19.31 | $ 40,160 |
| Vermont | 80 | 0.27 | 1.24 | $ 18.86 | $ 39,240 |
| California | 3,600 | 0.22 | 0.99 | $ 18.74 | $ 38,980 |
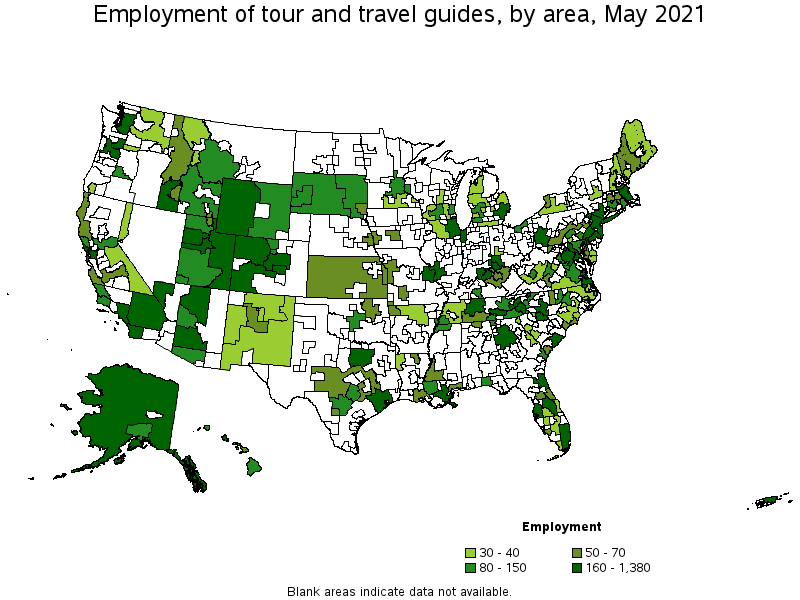
Metropolitan areas with the highest employment level in Tour and Travel Guides:
| Metropolitan area | Employment (1) | Employment per thousand jobs | Location quotient (9) | Hourly mean wage | Annual mean wage (2) |
|---|---|---|---|---|---|
| Los Angeles-Long Beach-Anaheim, CA | 1,380 | 0.24 | 1.10 | $ 17.18 | $ 35,720 |
| New York-Newark-Jersey City, NY-NJ-PA | 1,130 | 0.13 | 0.59 | $ 18.87 | $ 39,250 |
| Philadelphia-Camden-Wilmington, PA-NJ-DE-MD | 660 | 0.25 | 1.13 | $ 15.09 | $ 31,400 |
| Virginia Beach-Norfolk-Newport News, VA-NC | 620 | 0.87 | 3.98 | $ 14.12 | $ 29,370 |
| Dallas-Fort Worth-Arlington, TX | 600 | 0.17 | 0.76 | $ 17.18 | $ 35,730 |
| San Diego-Carlsbad, CA | 520 | 0.38 | 1.71 | $ 20.74 | $ 43,130 |
| Chicago-Naperville-Elgin, IL-IN-WI | 500 | 0.12 | 0.54 | $ 15.97 | $ 33,210 |
| San Francisco-Oakland-Hayward, CA | 490 | 0.22 | 0.99 | $ 21.40 | $ 44,510 |
| Boston-Cambridge-Nashua, MA-NH | 480 | 0.19 | 0.85 | $ 17.62 | $ 36,640 |
| Washington-Arlington-Alexandria, DC-VA-MD-WV | 470 | 0.16 | 0.73 | $ 18.28 | $ 38,030 |
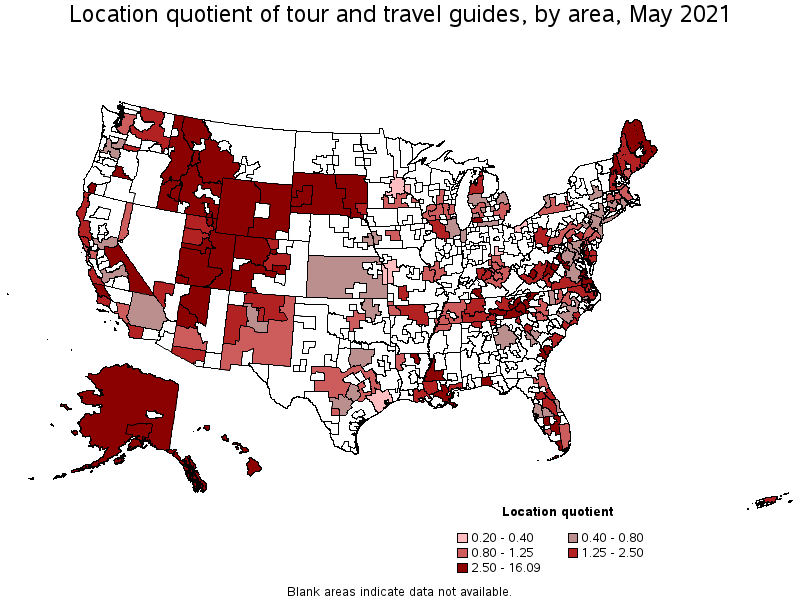
Metropolitan areas with the highest concentration of jobs and location quotients in Tour and Travel Guides:
| Metropolitan area | Employment (1) | Employment per thousand jobs | Location quotient (9) | Hourly mean wage | Annual mean wage (2) |
|---|---|---|---|---|---|
| Flagstaff, AZ | 190 | 3.32 | 15.12 | $ 16.24 | $ 33,780 |
| Beckley, WV | 120 | 3.09 | 14.06 | $ 11.70 | $ 24,340 |
| Prescott, AZ | 100 | 1.54 | 7.00 | $ 18.83 | $ 39,170 |
| Asheville, NC | 280 | 1.51 | 6.86 | $ 14.28 | $ 29,710 |
| Rapid City, SD | 100 | 1.44 | 6.54 | $ 13.46 | $ 28,000 |
| St. George, UT | 100 | 1.38 | 6.28 | $ 14.85 | $ 30,890 |
| Gettysburg, PA | 40 | 1.24 | 5.64 | $ 13.11 | $ 27,270 |
| Grants Pass, OR | 30 | 1.14 | 5.20 | $ 13.26 | $ 27,570 |
| Bowling Green, KY | 80 | 1.09 | 4.95 | $ 15.93 | $ 33,140 |
| Kahului-Wailuku-Lahaina, HI | 70 | 1.07 | 4.88 | $ 18.28 | $ 38,020 |
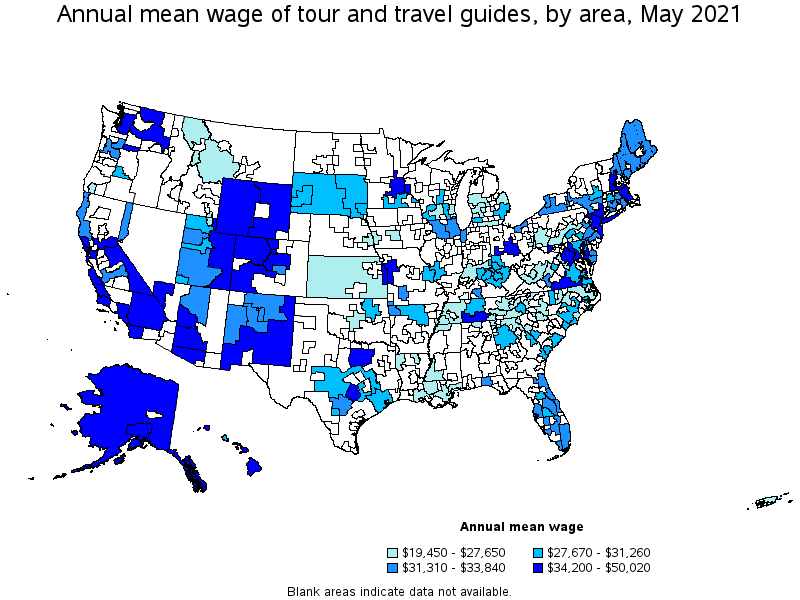
Top paying metropolitan areas for Tour and Travel Guides:
| Metropolitan area | Employment (1) | Employment per thousand jobs | Location quotient (9) | Hourly mean wage | Annual mean wage (2) |
|---|---|---|---|---|---|
| Seattle-Tacoma-Bellevue, WA | 390 | 0.20 | 0.92 | $ 24.05 | $ 50,020 |
| San Luis Obispo-Paso Robles-Arroyo Grande, CA | 110 | 0.99 | 4.49 | $ 23.20 | $ 48,260 |
| San Francisco-Oakland-Hayward, CA | 490 | 0.22 | 0.99 | $ 21.40 | $ 44,510 |
| San Diego-Carlsbad, CA | 520 | 0.38 | 1.71 | $ 20.74 | $ 43,130 |
| Columbus, OH | (8) | (8) | (8) | $ 19.90 | $ 41,400 |
| Sacramento--Roseville--Arden-Arcade, CA | 110 | 0.11 | 0.49 | $ 19.89 | $ 41,370 |
| Boulder, CO | 120 | 0.68 | 3.07 | $ 19.17 | $ 39,870 |
| New York-Newark-Jersey City, NY-NJ-PA | 1,130 | 0.13 | 0.59 | $ 18.87 | $ 39,250 |
| Prescott, AZ | 100 | 1.54 | 7.00 | $ 18.83 | $ 39,170 |
| Denver-Aurora-Lakewood, CO | 430 | 0.29 | 1.33 | $ 18.33 | $ 38,120 |
Nonmetropolitan areas with the highest employment in Tour and Travel Guides:
| Nonmetropolitan area | Employment (1) | Employment per thousand jobs | Location quotient (9) | Hourly mean wage | Annual mean wage (2) |
|---|---|---|---|---|---|
| East Tennessee nonmetropolitan area | 420 | 3.16 | 14.37 | $ 12.99 | $ 27,020 |
| Alaska nonmetropolitan area | 290 | 2.97 | 13.53 | $ 18.72 | $ 38,940 |
| Eastern Utah nonmetropolitan area | 280 | 3.54 | 16.09 | $ 16.63 | $ 34,580 |
| Northwest Colorado nonmetropolitan area | 270 | 2.34 | 10.66 | $ 22.55 | $ 46,900 |
| Southwest Colorado nonmetropolitan area | 270 | 2.74 | 12.48 | $ 17.74 | $ 36,900 |
Nonmetropolitan areas with the highest concentration of jobs and location quotients in Tour and Travel Guides:
| Nonmetropolitan area | Employment (1) | Employment per thousand jobs | Location quotient (9) | Hourly mean wage | Annual mean wage (2) |
|---|---|---|---|---|---|
| Eastern Utah nonmetropolitan area | 280 | 3.54 | 16.09 | $ 16.63 | $ 34,580 |
| East Tennessee nonmetropolitan area | 420 | 3.16 | 14.37 | $ 12.99 | $ 27,020 |
| Alaska nonmetropolitan area | 290 | 2.97 | 13.53 | $ 18.72 | $ 38,940 |
| Southwest Colorado nonmetropolitan area | 270 | 2.74 | 12.48 | $ 17.74 | $ 36,900 |
| Northwest Colorado nonmetropolitan area | 270 | 2.34 | 10.66 | $ 22.55 | $ 46,900 |
Top paying nonmetropolitan areas for Tour and Travel Guides:
| Nonmetropolitan area | Employment (1) | Employment per thousand jobs | Location quotient (9) | Hourly mean wage | Annual mean wage (2) |
|---|---|---|---|---|---|
| Northwest Colorado nonmetropolitan area | 270 | 2.34 | 10.66 | $ 22.55 | $ 46,900 |
| South Central Tennessee nonmetropolitan area | 50 | 0.48 | 2.18 | $ 19.06 | $ 39,640 |
| Eastern Washington nonmetropolitan area | 30 | 0.34 | 1.57 | $ 18.77 | $ 39,040 |
| Alaska nonmetropolitan area | 290 | 2.97 | 13.53 | $ 18.72 | $ 38,940 |
| Hawaii / Kauai nonmetropolitan area | 150 | 1.67 | 7.60 | $ 17.88 | $ 37,200 |
These estimates are calculated with data collected from employers in all industry sectors, all metropolitan and nonmetropolitan areas, and all states and the District of Columbia. The top employment and wage figures are provided above. The complete list is available in the downloadable XLS files.
The percentile wage estimate is the value of a wage below which a certain percent of workers fall. The median wage is the 50th percentile wage estimate—50 percent of workers earn less than the median and 50 percent of workers earn more than the median. More about percentile wages.
(1) Estimates for detailed occupations do not sum to the totals because the totals include occupations not shown separately. Estimates do not include self-employed workers.
(2) Annual wages have been calculated by multiplying the hourly mean wage by a "year-round, full-time" hours figure of 2,080 hours; for those occupations where there is not an hourly wage published, the annual wage has been directly calculated from the reported survey data.
(3) The relative standard error (RSE) is a measure of the reliability of a survey statistic. The smaller the relative standard error, the more precise the estimate.
(8) Estimate not released.
(9) The location quotient is the ratio of the area concentration of occupational employment to the national average concentration. A location quotient greater than one indicates the occupation has a higher share of employment than average, and a location quotient less than one indicates the occupation is less prevalent in the area than average.
Other OEWS estimates and related information:
May 2021 National Occupational Employment and Wage Estimates
May 2021 State Occupational Employment and Wage Estimates
May 2021 Metropolitan and Nonmetropolitan Area Occupational Employment and Wage Estimates
May 2021 National Industry-Specific Occupational Employment and Wage Estimates
Last Modified Date: March 31, 2022