
An official website of the United States government
An official website of the United States government
The .gov means it's official.
Federal government websites often end in .gov or .mil. Before sharing sensitive information,
make sure you're on a federal government site.
The site is secure.
The
https:// ensures that you are connecting to the official website and that any
information you provide is encrypted and transmitted securely.
Attend to children at schools, businesses, private households, and childcare institutions. Perform a variety of tasks, such as dressing, feeding, bathing, and overseeing play. Excludes �Preschool Teachers, Except Special Education� (25-2011) and �Teaching Assistants, Preschool, Elementary, Middle, and Secondary School, Except Special Education� (25-9042).
Employment estimate and mean wage estimates for Childcare Workers:
| Employment (1) | Employment RSE (3) |
Mean hourly wage |
Mean annual wage (2) |
Wage RSE (3) |
|---|---|---|---|---|
| 438,520 | 1.6 % | $ 13.31 | $ 27,680 | 0.5 % |
Percentile wage estimates for Childcare Workers:
| Percentile | 10% | 25% | 50% (Median) |
75% | 90% |
|---|---|---|---|---|---|
| Hourly Wage | $ 8.91 | $ 10.88 | $ 13.22 | $ 14.47 | $ 17.99 |
| Annual Wage (2) | $ 18,540 | $ 22,640 | $ 27,490 | $ 30,100 | $ 37,430 |
Industries with the highest published employment and wages for Childcare Workers are provided. For a list of all industries with employment in Childcare Workers, see the Create Customized Tables function.
Industries with the highest levels of employment in Childcare Workers:
| Industry | Employment (1) | Percent of industry employment | Hourly mean wage | Annual mean wage (2) |
|---|---|---|---|---|
| Child Day Care Services | 236,360 | 29.37 | $ 12.40 | $ 25,790 |
| Elementary and Secondary Schools | 93,210 | 1.15 | $ 15.07 | $ 31,350 |
| Other Amusement and Recreation Industries | 19,590 | 1.76 | $ 11.34 | $ 23,590 |
| Civic and Social Organizations | 16,070 | 6.15 | $ 12.35 | $ 25,690 |
| Individual and Family Services | 12,790 | 0.48 | $ 14.15 | $ 29,440 |
Industries with the highest concentration of employment in Childcare Workers:
| Industry | Employment (1) | Percent of industry employment | Hourly mean wage | Annual mean wage (2) |
|---|---|---|---|---|
| Child Day Care Services | 236,360 | 29.37 | $ 12.40 | $ 25,790 |
| Other Residential Care Facilities | 12,330 | 8.17 | $ 14.89 | $ 30,970 |
| Civic and Social Organizations | 16,070 | 6.15 | $ 12.35 | $ 25,690 |
| Religious Organizations | 4,040 | 2.25 | $ 14.25 | $ 29,630 |
| Other Amusement and Recreation Industries | 19,590 | 1.76 | $ 11.34 | $ 23,590 |
Top paying industries for Childcare Workers:
| Industry | Employment (1) | Percent of industry employment | Hourly mean wage | Annual mean wage (2) |
|---|---|---|---|---|
| Psychiatric and Substance Abuse Hospitals | 120 | 0.05 | $ 24.07 | $ 50,070 |
| Scientific Research and Development Services | 120 | 0.02 | $ 19.64 | $ 40,860 |
| Business Schools and Computer and Management Training | 70 | 0.10 | $ 17.63 | $ 36,670 |
| Real Estate | (8) | (8) | $ 17.52 | $ 36,450 |
| Management, Scientific, and Technical Consulting Services | (8) | (8) | $ 17.50 | $ 36,410 |
States and areas with the highest published employment, location quotients, and wages for Childcare Workers are provided. For a list of all areas with employment in Childcare Workers, see the Create Customized Tables function.
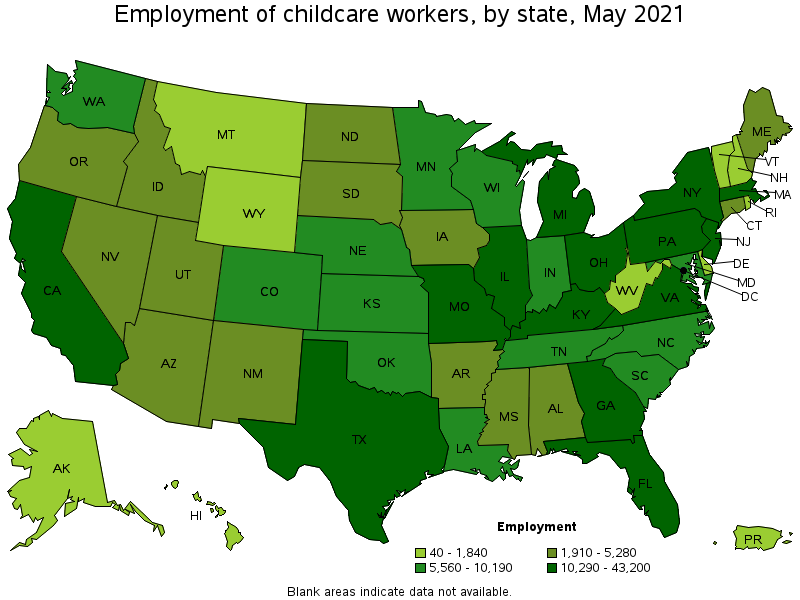
States with the highest employment level in Childcare Workers:
| State | Employment (1) | Employment per thousand jobs | Location quotient (9) | Hourly mean wage | Annual mean wage (2) |
|---|---|---|---|---|---|
| Texas | 43,200 | 3.53 | 1.14 | $ 11.43 | $ 23,770 |
| New York | 41,720 | 4.81 | 1.55 | $ 15.89 | $ 33,060 |
| California | 28,240 | 1.71 | 0.55 | $ 17.02 | $ 35,390 |
| Florida | 27,740 | 3.22 | 1.04 | $ 13.25 | $ 27,560 |
| Georgia | 17,600 | 4.02 | 1.29 | $ 11.48 | $ 23,880 |
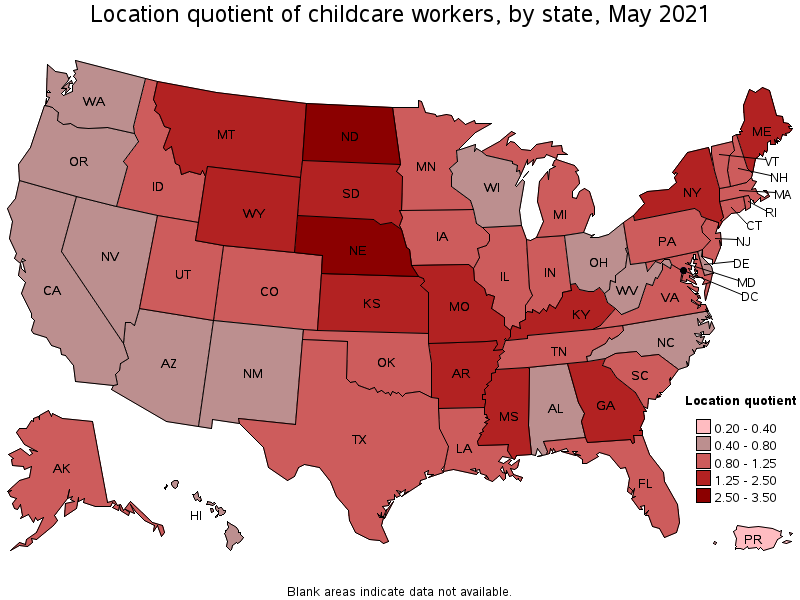
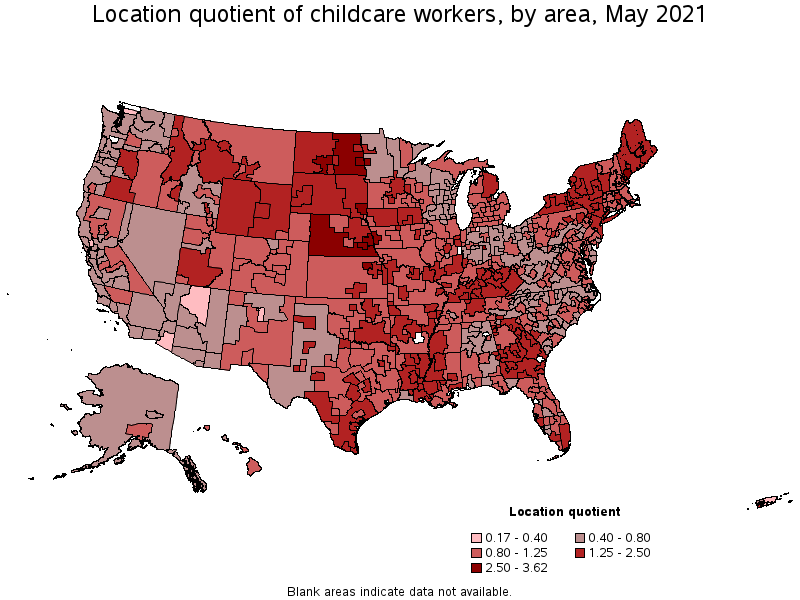
States with the highest concentration of jobs and location quotients in Childcare Workers:
| State | Employment (1) | Employment per thousand jobs | Location quotient (9) | Hourly mean wage | Annual mean wage (2) |
|---|---|---|---|---|---|
| North Dakota | 3,730 | 9.44 | 3.03 | $ 12.22 | $ 25,410 |
| Nebraska | 7,600 | 7.93 | 2.55 | $ 12.31 | $ 25,610 |
| Maine | 4,190 | 7.08 | 2.28 | $ 14.90 | $ 31,000 |
| South Dakota | 2,780 | 6.61 | 2.12 | $ 11.41 | $ 23,720 |
| Kentucky | 10,930 | 5.94 | 1.91 | $ 11.62 | $ 24,170 |
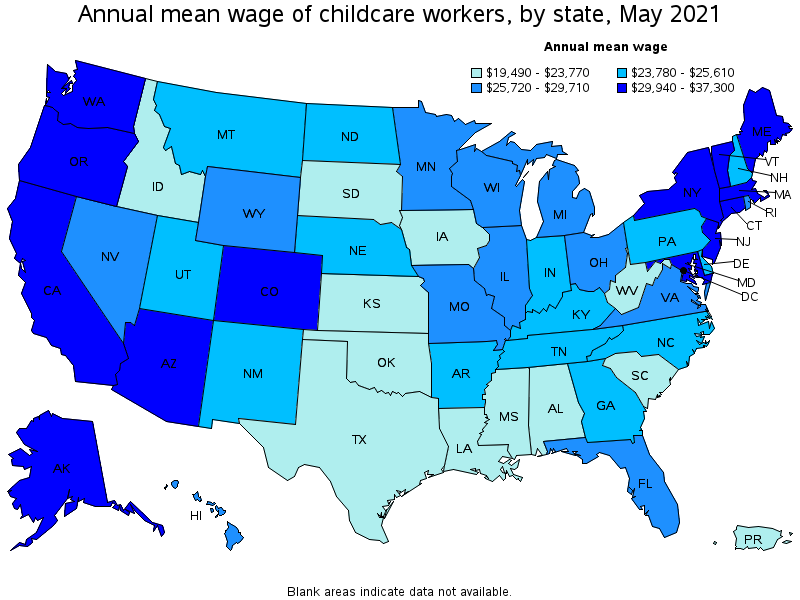
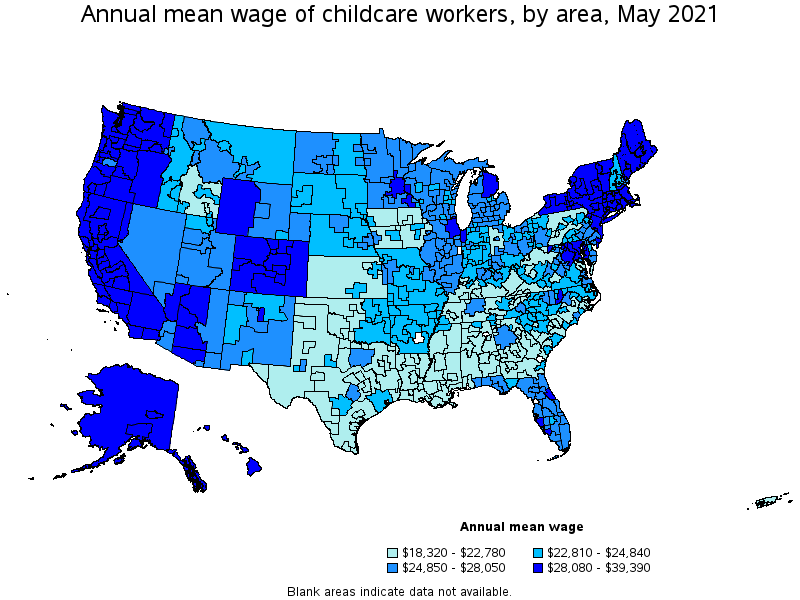
Top paying states for Childcare Workers:
| State | Employment (1) | Employment per thousand jobs | Location quotient (9) | Hourly mean wage | Annual mean wage (2) |
|---|---|---|---|---|---|
| District of Columbia | 1,150 | 1.74 | 0.56 | $ 17.93 | $ 37,300 |
| California | 28,240 | 1.71 | 0.55 | $ 17.02 | $ 35,390 |
| Massachusetts | 12,050 | 3.55 | 1.14 | $ 16.79 | $ 34,920 |
| Washington | 5,560 | 1.73 | 0.56 | $ 16.35 | $ 34,020 |
| Colorado | 8,370 | 3.19 | 1.03 | $ 16.03 | $ 33,340 |
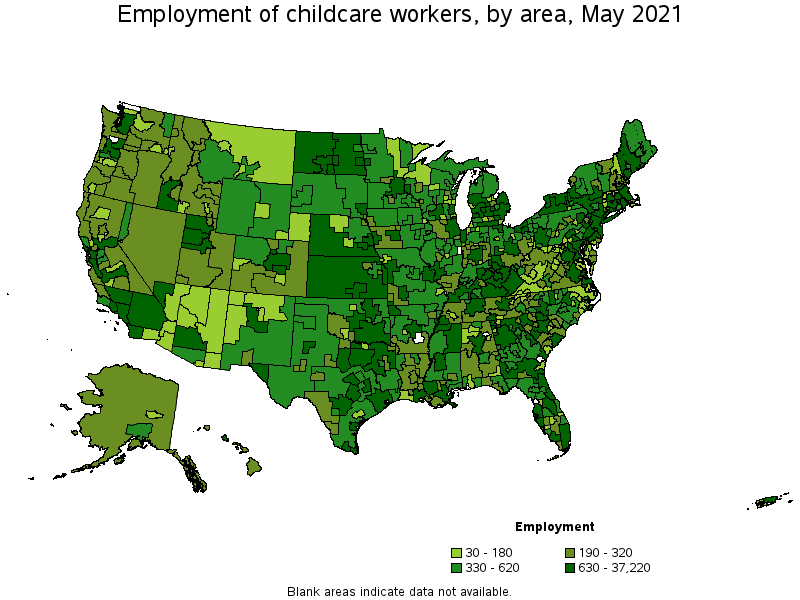
Metropolitan areas with the highest employment level in Childcare Workers:
| Metropolitan area | Employment (1) | Employment per thousand jobs | Location quotient (9) | Hourly mean wage | Annual mean wage (2) |
|---|---|---|---|---|---|
| New York-Newark-Jersey City, NY-NJ-PA | 37,220 | 4.29 | 1.38 | $ 16.33 | $ 33,970 |
| Chicago-Naperville-Elgin, IL-IN-WI | 12,610 | 2.98 | 0.96 | $ 14.24 | $ 29,630 |
| Dallas-Fort Worth-Arlington, TX | 11,290 | 3.15 | 1.01 | $ 12.19 | $ 25,360 |
| Miami-Fort Lauderdale-West Palm Beach, FL | 10,980 | 4.48 | 1.44 | $ 13.33 | $ 27,720 |
| Houston-The Woodlands-Sugar Land, TX | 10,110 | 3.49 | 1.12 | $ 11.61 | $ 24,150 |
| Atlanta-Sandy Springs-Roswell, GA | 9,600 | 3.71 | 1.19 | $ 12.36 | $ 25,700 |
| Boston-Cambridge-Nashua, MA-NH | 9,160 | 3.54 | 1.14 | $ 16.84 | $ 35,020 |
| Los Angeles-Long Beach-Anaheim, CA | 7,810 | 1.37 | 0.44 | $ 16.39 | $ 34,080 |
| Washington-Arlington-Alexandria, DC-VA-MD-WV | 7,780 | 2.65 | 0.85 | $ 16.01 | $ 33,300 |
| Minneapolis-St. Paul-Bloomington, MN-WI | 7,560 | 4.15 | 1.33 | $ 14.71 | $ 30,590 |
Metropolitan areas with the highest concentration of jobs and location quotients in Childcare Workers:
| Metropolitan area | Employment (1) | Employment per thousand jobs | Location quotient (9) | Hourly mean wage | Annual mean wage (2) |
|---|---|---|---|---|---|
| Fargo, ND-MN | 1,380 | 10.11 | 3.25 | $ 11.98 | $ 24,910 |
| Bismarck, ND | 670 | 9.59 | 3.08 | $ 12.74 | $ 26,490 |
| Lincoln, NE | 1,600 | 9.38 | 3.01 | $ 12.38 | $ 25,750 |
| Muncie, IN | 400 | 9.23 | 2.97 | $ 12.62 | $ 26,240 |
| Manhattan, KS | 320 | 8.65 | 2.78 | $ 10.22 | $ 21,260 |
| Omaha-Council Bluffs, NE-IA | 3,940 | 8.47 | 2.72 | $ 12.61 | $ 26,220 |
| Portland-South Portland, ME | 1,660 | 8.39 | 2.70 | $ 15.30 | $ 31,820 |
| Sioux Falls, SD | 1,280 | 8.24 | 2.65 | $ 11.51 | $ 23,930 |
| Ithaca, NY | 360 | 7.79 | 2.50 | $ 15.03 | $ 31,270 |
| Lewiston-Auburn, ME | 350 | 7.36 | 2.37 | $ 14.51 | $ 30,170 |
Top paying metropolitan areas for Childcare Workers:
| Metropolitan area | Employment (1) | Employment per thousand jobs | Location quotient (9) | Hourly mean wage | Annual mean wage (2) |
|---|---|---|---|---|---|
| San Jose-Sunnyvale-Santa Clara, CA | 1,730 | 1.62 | 0.52 | $ 18.94 | $ 39,390 |
| San Francisco-Oakland-Hayward, CA | 3,840 | 1.71 | 0.55 | $ 18.81 | $ 39,120 |
| Napa, CA | 80 | 1.15 | 0.37 | $ 17.72 | $ 36,850 |
| Seattle-Tacoma-Bellevue, WA | 2,710 | 1.41 | 0.45 | $ 17.66 | $ 36,730 |
| Santa Rosa, CA | 350 | 1.82 | 0.58 | $ 17.66 | $ 36,720 |
| North Port-Sarasota-Bradenton, FL | 1,280 | 4.36 | 1.40 | $ 17.38 | $ 36,150 |
| Riverside-San Bernardino-Ontario, CA | 3,140 | 2.05 | 0.66 | $ 17.23 | $ 35,840 |
| Santa Maria-Santa Barbara, CA | 360 | 1.83 | 0.59 | $ 17.19 | $ 35,750 |
| Pueblo, CO | 160 | 2.70 | 0.87 | $ 17.11 | $ 35,600 |
| Merced, CA | 270 | 3.72 | 1.19 | $ 17.00 | $ 35,360 |
Nonmetropolitan areas with the highest employment in Childcare Workers:
| Nonmetropolitan area | Employment (1) | Employment per thousand jobs | Location quotient (9) | Hourly mean wage | Annual mean wage (2) |
|---|---|---|---|---|---|
| Southwest Maine nonmetropolitan area | 1,330 | 7.31 | 2.35 | $ 14.61 | $ 30,390 |
| Kansas nonmetropolitan area | 1,240 | 3.31 | 1.06 | $ 10.49 | $ 21,830 |
| South Nebraska nonmetropolitan area | 1,200 | 8.28 | 2.66 | $ 11.55 | $ 24,030 |
| Central Kentucky nonmetropolitan area | 1,150 | 6.63 | 2.13 | $ 11.13 | $ 23,150 |
| South Central Kentucky nonmetropolitan area | 1,120 | 6.87 | 2.21 | $ 10.33 | $ 21,490 |
Nonmetropolitan areas with the highest concentration of jobs and location quotients in Childcare Workers:
| Nonmetropolitan area | Employment (1) | Employment per thousand jobs | Location quotient (9) | Hourly mean wage | Annual mean wage (2) |
|---|---|---|---|---|---|
| East North Dakota nonmetropolitan area | 690 | 11.26 | 3.62 | $ 11.57 | $ 24,060 |
| South Nebraska nonmetropolitan area | 1,200 | 8.28 | 2.66 | $ 11.55 | $ 24,030 |
| West South Dakota nonmetropolitan area | 450 | 7.53 | 2.42 | $ 10.99 | $ 22,860 |
| West North Dakota nonmetropolitan area | 790 | 7.45 | 2.39 | $ 12.62 | $ 26,250 |
| Southwest Maine nonmetropolitan area | 1,330 | 7.31 | 2.35 | $ 14.61 | $ 30,390 |
Top paying nonmetropolitan areas for Childcare Workers:
| Nonmetropolitan area | Employment (1) | Employment per thousand jobs | Location quotient (9) | Hourly mean wage | Annual mean wage (2) |
|---|---|---|---|---|---|
| Massachusetts nonmetropolitan area | 170 | 2.88 | 0.93 | $ 17.07 | $ 35,500 |
| Northwest Colorado nonmetropolitan area | 380 | 3.27 | 1.05 | $ 17.01 | $ 35,390 |
| Eastern Sierra-Mother Lode Region of California nonmetropolitan area | 210 | 3.72 | 1.20 | $ 16.73 | $ 34,790 |
| North Coast Region of California nonmetropolitan area | 210 | 2.12 | 0.68 | $ 16.55 | $ 34,420 |
| North Valley-Northern Mountains Region of California nonmetropolitan area | 280 | 2.83 | 0.91 | $ 16.35 | $ 34,000 |
These estimates are calculated with data collected from employers in all industry sectors, all metropolitan and nonmetropolitan areas, and all states and the District of Columbia. The top employment and wage figures are provided above. The complete list is available in the downloadable XLS files.
The percentile wage estimate is the value of a wage below which a certain percent of workers fall. The median wage is the 50th percentile wage estimate—50 percent of workers earn less than the median and 50 percent of workers earn more than the median. More about percentile wages.
(1) Estimates for detailed occupations do not sum to the totals because the totals include occupations not shown separately. Estimates do not include self-employed workers.
(2) Annual wages have been calculated by multiplying the hourly mean wage by a "year-round, full-time" hours figure of 2,080 hours; for those occupations where there is not an hourly wage published, the annual wage has been directly calculated from the reported survey data.
(3) The relative standard error (RSE) is a measure of the reliability of a survey statistic. The smaller the relative standard error, the more precise the estimate.
(8) Estimate not released.
(9) The location quotient is the ratio of the area concentration of occupational employment to the national average concentration. A location quotient greater than one indicates the occupation has a higher share of employment than average, and a location quotient less than one indicates the occupation is less prevalent in the area than average.
Other OEWS estimates and related information:
May 2021 National Occupational Employment and Wage Estimates
May 2021 State Occupational Employment and Wage Estimates
May 2021 Metropolitan and Nonmetropolitan Area Occupational Employment and Wage Estimates
May 2021 National Industry-Specific Occupational Employment and Wage Estimates
Last Modified Date: March 31, 2022