
An official website of the United States government
An official website of the United States government
The .gov means it's official.
Federal government websites often end in .gov or .mil. Before sharing sensitive information,
make sure you're on a federal government site.
The site is secure.
The
https:// ensures that you are connecting to the official website and that any
information you provide is encrypted and transmitted securely.
Conduct recreation activities with groups in public, private, or volunteer agencies or recreation facilities. Organize and promote activities, such as arts and crafts, sports, games, music, dramatics, social recreation, camping, and hobbies, taking into account the needs and interests of individual members.
Employment estimate and mean wage estimates for Recreation Workers:
| Employment (1) | Employment RSE (3) |
Mean hourly wage |
Mean annual wage (2) |
Wage RSE (3) |
|---|---|---|---|---|
| 264,020 | 1.0 % | $ 15.39 | $ 32,020 | 0.4 % |
Percentile wage estimates for Recreation Workers:
| Percentile | 10% | 25% | 50% (Median) |
75% | 90% |
|---|---|---|---|---|---|
| Hourly Wage | $ 10.45 | $ 11.70 | $ 14.27 | $ 17.59 | $ 22.43 |
| Annual Wage (2) | $ 21,730 | $ 24,330 | $ 29,680 | $ 36,580 | $ 46,660 |
Industries with the highest published employment and wages for Recreation Workers are provided. For a list of all industries with employment in Recreation Workers, see the Create Customized Tables function.
Industries with the highest levels of employment in Recreation Workers:
| Industry | Employment (1) | Percent of industry employment | Hourly mean wage | Annual mean wage (2) |
|---|---|---|---|---|
| Local Government, excluding schools and hospitals (OEWS Designation) | 83,170 | 1.55 | $ 15.62 | $ 32,480 |
| Nursing Care Facilities (Skilled Nursing Facilities) | 33,900 | 2.41 | $ 15.13 | $ 31,470 |
| Other Amusement and Recreation Industries | 26,370 | 2.37 | $ 14.45 | $ 30,060 |
| Continuing Care Retirement Communities and Assisted Living Facilities for the Elderly | 23,120 | 2.59 | $ 15.84 | $ 32,960 |
| Civic and Social Organizations | 20,380 | 7.80 | $ 14.49 | $ 30,140 |
Industries with the highest concentration of employment in Recreation Workers:
| Industry | Employment (1) | Percent of industry employment | Hourly mean wage | Annual mean wage (2) |
|---|---|---|---|---|
| Civic and Social Organizations | 20,380 | 7.80 | $ 14.49 | $ 30,140 |
| RV (Recreational Vehicle) Parks and Recreational Camps | 3,830 | 6.90 | $ 15.21 | $ 31,650 |
| Continuing Care Retirement Communities and Assisted Living Facilities for the Elderly | 23,120 | 2.59 | $ 15.84 | $ 32,960 |
| Nursing Care Facilities (Skilled Nursing Facilities) | 33,900 | 2.41 | $ 15.13 | $ 31,470 |
| Other Amusement and Recreation Industries | 26,370 | 2.37 | $ 14.45 | $ 30,060 |
Top paying industries for Recreation Workers:
| Industry | Employment (1) | Percent of industry employment | Hourly mean wage | Annual mean wage (2) |
|---|---|---|---|---|
| Federal Executive Branch (OEWS Designation) | 2,040 | 0.10 | $ 27.76 | $ 57,740 |
| Educational Support Services | 340 | 0.18 | $ 18.89 | $ 39,300 |
| Outpatient Care Centers | 240 | 0.02 | $ 18.59 | $ 38,670 |
| Psychiatric and Substance Abuse Hospitals | 630 | 0.27 | $ 18.53 | $ 38,540 |
| State Government, excluding schools and hospitals (OEWS Designation) | 2,270 | 0.10 | $ 18.52 | $ 38,530 |
States and areas with the highest published employment, location quotients, and wages for Recreation Workers are provided. For a list of all areas with employment in Recreation Workers, see the Create Customized Tables function.
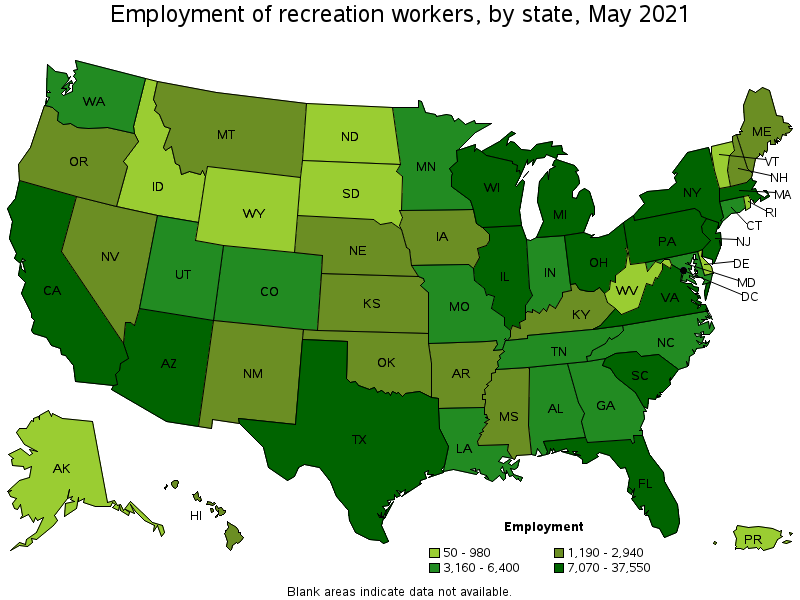
States with the highest employment level in Recreation Workers:
| State | Employment (1) | Employment per thousand jobs | Location quotient (9) | Hourly mean wage | Annual mean wage (2) |
|---|---|---|---|---|---|
| California | 37,550 | 2.27 | 1.21 | $ 17.05 | $ 35,460 |
| New York | 16,930 | 1.95 | 1.04 | $ 18.72 | $ 38,940 |
| Texas | 16,460 | 1.35 | 0.72 | $ 13.59 | $ 28,270 |
| Florida | 16,310 | 1.90 | 1.01 | $ 14.44 | $ 30,040 |
| Illinois | 10,460 | 1.86 | 0.99 | $ 15.11 | $ 31,420 |
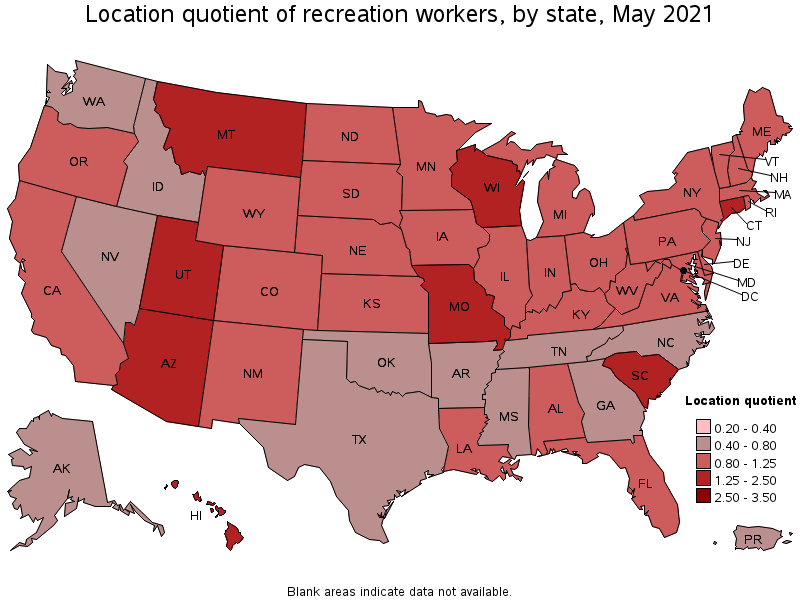
States with the highest concentration of jobs and location quotients in Recreation Workers:
| State | Employment (1) | Employment per thousand jobs | Location quotient (9) | Hourly mean wage | Annual mean wage (2) |
|---|---|---|---|---|---|
| South Carolina | 7,330 | 3.54 | 1.89 | $ 14.10 | $ 29,320 |
| Hawaii | 1,530 | 2.78 | 1.48 | $ 16.23 | $ 33,770 |
| Montana | 1,250 | 2.65 | 1.42 | $ 13.85 | $ 28,810 |
| Wisconsin | 7,110 | 2.58 | 1.38 | $ 13.78 | $ 28,650 |
| Connecticut | 3,930 | 2.50 | 1.33 | $ 17.11 | $ 35,580 |
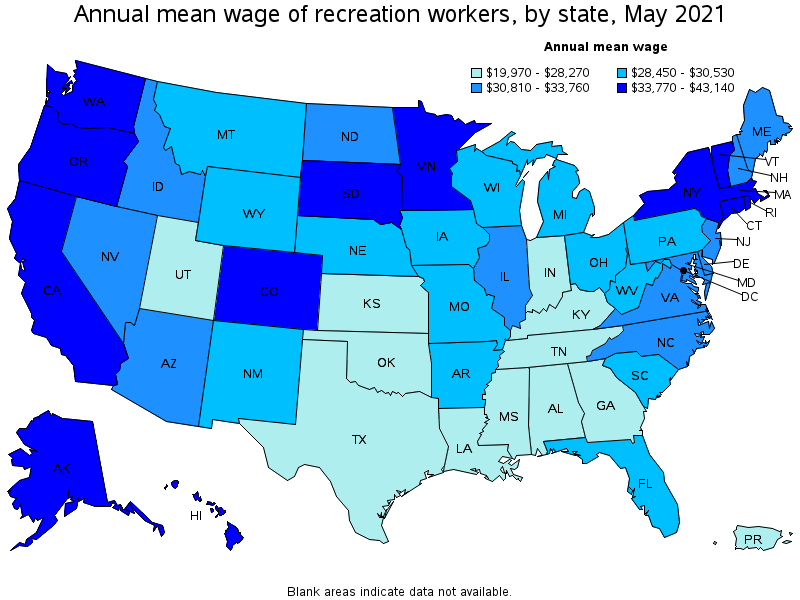
Top paying states for Recreation Workers:
| State | Employment (1) | Employment per thousand jobs | Location quotient (9) | Hourly mean wage | Annual mean wage (2) |
|---|---|---|---|---|---|
| District of Columbia | 450 | 0.68 | 0.36 | $ 20.74 | $ 43,140 |
| Alaska | 400 | 1.35 | 0.72 | $ 19.32 | $ 40,180 |
| New York | 16,930 | 1.95 | 1.04 | $ 18.72 | $ 38,940 |
| Washington | 3,750 | 1.17 | 0.62 | $ 18.31 | $ 38,090 |
| Minnesota | 5,630 | 2.06 | 1.10 | $ 18.06 | $ 37,560 |
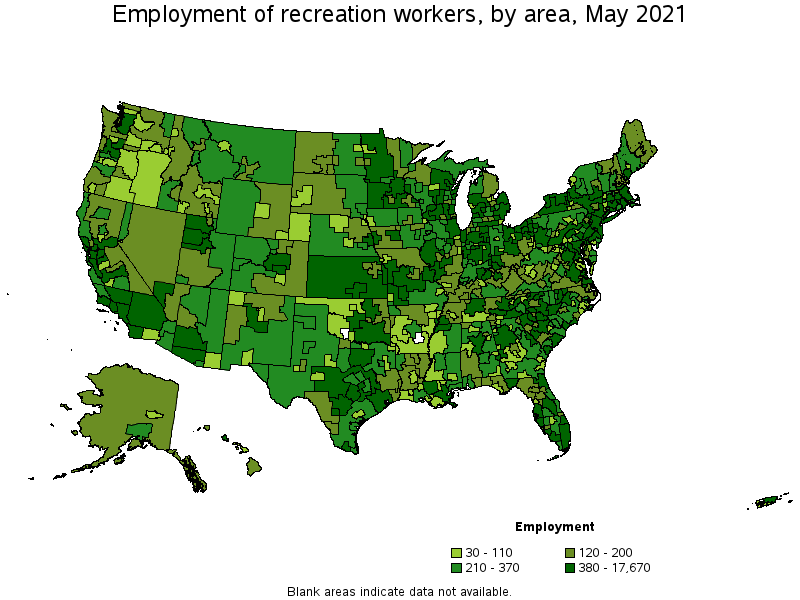
Metropolitan areas with the highest employment level in Recreation Workers:
| Metropolitan area | Employment (1) | Employment per thousand jobs | Location quotient (9) | Hourly mean wage | Annual mean wage (2) |
|---|---|---|---|---|---|
| New York-Newark-Jersey City, NY-NJ-PA | 17,670 | 2.04 | 1.09 | $ 18.28 | $ 38,020 |
| Los Angeles-Long Beach-Anaheim, CA | 13,250 | 2.32 | 1.24 | $ 16.73 | $ 34,800 |
| Chicago-Naperville-Elgin, IL-IN-WI | 7,980 | 1.89 | 1.01 | $ 15.65 | $ 32,560 |
| San Francisco-Oakland-Hayward, CA | 6,280 | 2.80 | 1.50 | $ 18.58 | $ 38,640 |
| Miami-Fort Lauderdale-West Palm Beach, FL | 5,130 | 2.09 | 1.12 | $ 15.19 | $ 31,580 |
| Boston-Cambridge-Nashua, MA-NH | 4,970 | 1.92 | 1.03 | $ 17.76 | $ 36,950 |
| Phoenix-Mesa-Scottsdale, AZ | 4,900 | 2.31 | 1.23 | $ 16.49 | $ 34,300 |
| Dallas-Fort Worth-Arlington, TX | 4,660 | 1.30 | 0.69 | $ 14.03 | $ 29,180 |
| Washington-Arlington-Alexandria, DC-VA-MD-WV | 4,530 | 1.54 | 0.82 | $ 17.85 | $ 37,120 |
| Philadelphia-Camden-Wilmington, PA-NJ-DE-MD | 4,290 | 1.62 | 0.86 | $ 15.48 | $ 32,200 |
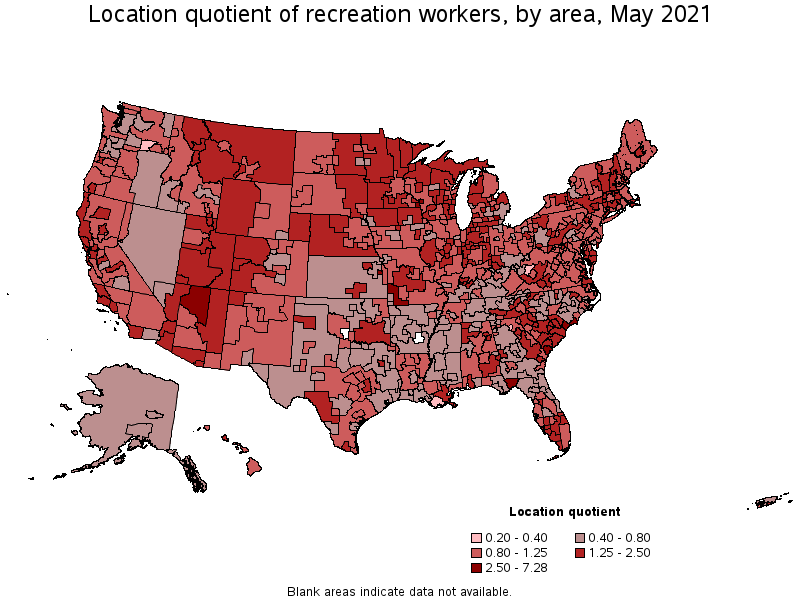
Metropolitan areas with the highest concentration of jobs and location quotients in Recreation Workers:
| Metropolitan area | Employment (1) | Employment per thousand jobs | Location quotient (9) | Hourly mean wage | Annual mean wage (2) |
|---|---|---|---|---|---|
| Ann Arbor, MI | 2,750 | 13.65 | 7.28 | $ 12.78 | $ 26,580 |
| Hilton Head Island-Bluffton-Beaufort, SC | 600 | 8.05 | 4.29 | $ 15.21 | $ 31,630 |
| Myrtle Beach-Conway-North Myrtle Beach, SC-NC | 950 | 5.87 | 3.13 | $ 12.82 | $ 26,660 |
| Ocean City, NJ | 230 | 5.83 | 3.11 | $ 14.73 | $ 30,640 |
| Tallahassee, FL | 890 | 5.20 | 2.78 | $ 11.84 | $ 24,640 |
| La Crosse-Onalaska, WI-MN | 370 | 5.14 | 2.74 | $ 12.28 | $ 25,550 |
| Lawrence, KS | 220 | 4.72 | 2.52 | $ 12.26 | $ 25,510 |
| Flagstaff, AZ | 270 | 4.70 | 2.51 | $ 16.18 | $ 33,660 |
| Manhattan, KS | 160 | 4.41 | 2.35 | $ 11.56 | $ 24,040 |
| The Villages, FL | 140 | 4.32 | 2.31 | $ 15.02 | $ 31,240 |
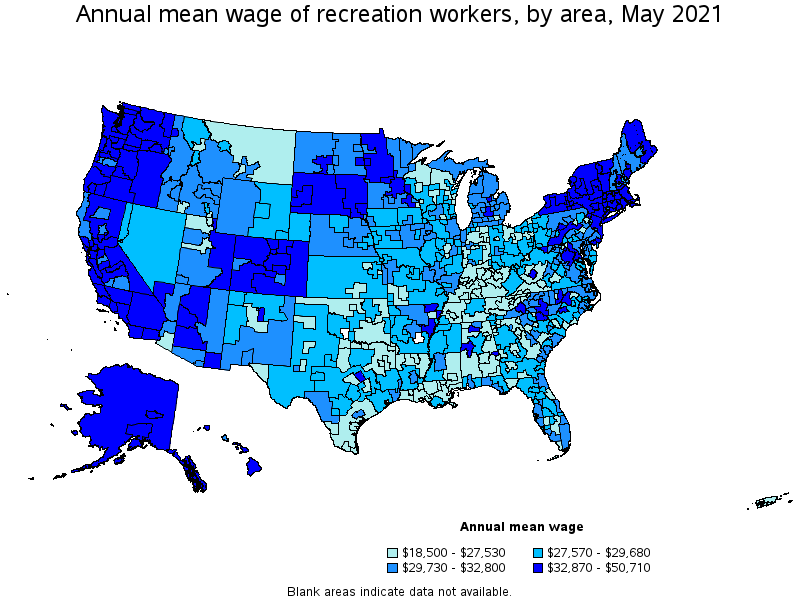
Top paying metropolitan areas for Recreation Workers:
| Metropolitan area | Employment (1) | Employment per thousand jobs | Location quotient (9) | Hourly mean wage | Annual mean wage (2) |
|---|---|---|---|---|---|
| Fairbanks, AK | 40 | 1.27 | 0.68 | $ 24.38 | $ 50,710 |
| Kahului-Wailuku-Lahaina, HI | 100 | 1.56 | 0.84 | $ 21.98 | $ 45,730 |
| San Jose-Sunnyvale-Santa Clara, CA | 1,730 | 1.62 | 0.87 | $ 21.25 | $ 44,200 |
| Minneapolis-St. Paul-Bloomington, MN-WI | 3,410 | 1.87 | 1.00 | $ 19.58 | $ 40,730 |
| Seattle-Tacoma-Bellevue, WA | 2,070 | 1.08 | 0.58 | $ 19.32 | $ 40,180 |
| Ithaca, NY | 90 | 1.85 | 0.99 | $ 18.63 | $ 38,750 |
| Albany-Schenectady-Troy, NY | 630 | 1.51 | 0.81 | $ 18.61 | $ 38,710 |
| San Francisco-Oakland-Hayward, CA | 6,280 | 2.80 | 1.50 | $ 18.58 | $ 38,640 |
| Kingston, NY | 160 | 3.00 | 1.60 | $ 18.56 | $ 38,610 |
| Raleigh, NC | 930 | 1.46 | 0.78 | $ 18.41 | $ 38,300 |
Nonmetropolitan areas with the highest employment in Recreation Workers:
| Nonmetropolitan area | Employment (1) | Employment per thousand jobs | Location quotient (9) | Hourly mean wage | Annual mean wage (2) |
|---|---|---|---|---|---|
| North Northeastern Ohio nonmetropolitan area (noncontiguous) | 690 | 2.20 | 1.17 | $ 12.95 | $ 26,930 |
| Northeastern Wisconsin nonmetropolitan area | 670 | 3.52 | 1.88 | $ 12.81 | $ 26,650 |
| Balance of Lower Peninsula of Michigan nonmetropolitan area | 620 | 2.44 | 1.30 | $ 15.10 | $ 31,410 |
| Southwest Missouri nonmetropolitan area | 600 | 8.53 | 4.55 | $ 11.75 | $ 24,440 |
| Northern Indiana nonmetropolitan area | 600 | 2.92 | 1.56 | $ 11.81 | $ 24,560 |
Nonmetropolitan areas with the highest concentration of jobs and location quotients in Recreation Workers:
| Nonmetropolitan area | Employment (1) | Employment per thousand jobs | Location quotient (9) | Hourly mean wage | Annual mean wage (2) |
|---|---|---|---|---|---|
| Southwest Missouri nonmetropolitan area | 600 | 8.53 | 4.55 | $ 11.75 | $ 24,440 |
| Northern New Hampshire nonmetropolitan area | 140 | 4.26 | 2.27 | $ 14.51 | $ 30,180 |
| East Tennessee nonmetropolitan area | 530 | 3.96 | 2.11 | $ 12.87 | $ 26,770 |
| East Georgia nonmetropolitan area | 320 | 3.75 | 2.00 | $ 10.94 | $ 22,750 |
| Mountain North Carolina nonmetropolitan area | 460 | 3.69 | 1.97 | $ 14.72 | $ 30,610 |
Top paying nonmetropolitan areas for Recreation Workers:
| Nonmetropolitan area | Employment (1) | Employment per thousand jobs | Location quotient (9) | Hourly mean wage | Annual mean wage (2) |
|---|---|---|---|---|---|
| Central East New York nonmetropolitan area | 380 | 2.51 | 1.34 | $ 20.42 | $ 42,470 |
| Massachusetts nonmetropolitan area | 210 | 3.61 | 1.93 | $ 19.69 | $ 40,960 |
| Alaska nonmetropolitan area | 130 | 1.36 | 0.73 | $ 19.55 | $ 40,660 |
| Hawaii / Kauai nonmetropolitan area | 150 | 1.71 | 0.91 | $ 19.28 | $ 40,100 |
| Southwest Colorado nonmetropolitan area | 260 | 2.62 | 1.40 | $ 18.20 | $ 37,860 |
These estimates are calculated with data collected from employers in all industry sectors, all metropolitan and nonmetropolitan areas, and all states and the District of Columbia. The top employment and wage figures are provided above. The complete list is available in the downloadable XLS files.
The percentile wage estimate is the value of a wage below which a certain percent of workers fall. The median wage is the 50th percentile wage estimate—50 percent of workers earn less than the median and 50 percent of workers earn more than the median. More about percentile wages.
(1) Estimates for detailed occupations do not sum to the totals because the totals include occupations not shown separately. Estimates do not include self-employed workers.
(2) Annual wages have been calculated by multiplying the hourly mean wage by a "year-round, full-time" hours figure of 2,080 hours; for those occupations where there is not an hourly wage published, the annual wage has been directly calculated from the reported survey data.
(3) The relative standard error (RSE) is a measure of the reliability of a survey statistic. The smaller the relative standard error, the more precise the estimate.
(9) The location quotient is the ratio of the area concentration of occupational employment to the national average concentration. A location quotient greater than one indicates the occupation has a higher share of employment than average, and a location quotient less than one indicates the occupation is less prevalent in the area than average.
Other OEWS estimates and related information:
May 2021 National Occupational Employment and Wage Estimates
May 2021 State Occupational Employment and Wage Estimates
May 2021 Metropolitan and Nonmetropolitan Area Occupational Employment and Wage Estimates
May 2021 National Industry-Specific Occupational Employment and Wage Estimates
Last Modified Date: March 31, 2022