
An official website of the United States government
An official website of the United States government
The .gov means it's official.
Federal government websites often end in .gov or .mil. Before sharing sensitive information,
make sure you're on a federal government site.
The site is secure.
The
https:// ensures that you are connecting to the official website and that any
information you provide is encrypted and transmitted securely.
Receive orders, generally in person, for repairs, rentals, and services. May describe available options, compute cost, and accept payment. Excludes �Fast Food and Counter Workers� (35-3023), �Hotel, Motel, and Resort Desk Clerks� (43-4081), �Order Clerks� (43-4151), and �Reservation and Transportation Ticket Agents and Travel Clerks� (43-4181).
Employment estimate and mean wage estimates for Counter and Rental Clerks:
| Employment (1) | Employment RSE (3) |
Mean hourly wage |
Mean annual wage (2) |
Wage RSE (3) |
|---|---|---|---|---|
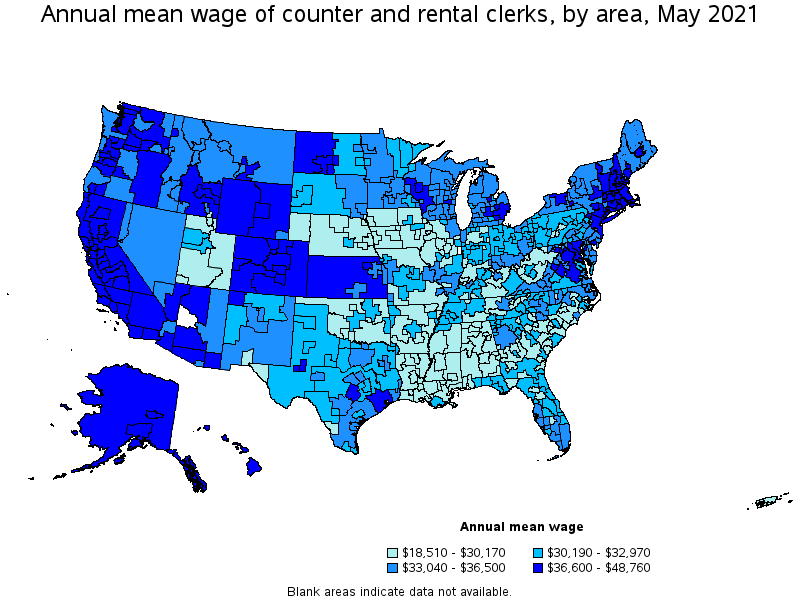
| 371,620 | 1.5 % | $ 17.39 | $ 36,170 | 0.5 % |
Percentile wage estimates for Counter and Rental Clerks:
| Percentile | 10% | 25% | 50% (Median) |
75% | 90% |
|---|---|---|---|---|---|
| Hourly Wage | $ 11.00 | $ 13.78 | $ 15.06 | $ 18.77 | $ 24.44 |
| Annual Wage (2) | $ 22,880 | $ 28,660 | $ 31,330 | $ 39,040 | $ 50,830 |
Industries with the highest published employment and wages for Counter and Rental Clerks are provided. For a list of all industries with employment in Counter and Rental Clerks, see the Create Customized Tables function.
Industries with the highest levels of employment in Counter and Rental Clerks:
| Industry | Employment (1) | Percent of industry employment | Hourly mean wage | Annual mean wage (2) |
|---|---|---|---|---|
| Real Estate | 106,700 | 6.38 | $ 17.24 | $ 35,850 |
| Automotive Equipment Rental and Leasing | 55,670 | 31.32 | $ 15.23 | $ 31,670 |
| Automobile Dealers | 41,210 | 3.38 | $ 23.81 | $ 49,530 |
| Rental and leasing services (5322, 5323, and 5324 only) | 28,030 | 9.67 | $ 17.50 | $ 36,400 |
| Drycleaning and Laundry Services | 21,530 | 9.33 | $ 12.95 | $ 26,930 |
Industries with the highest concentration of employment in Counter and Rental Clerks:
| Industry | Employment (1) | Percent of industry employment | Hourly mean wage | Annual mean wage (2) |
|---|---|---|---|---|
| Automotive Equipment Rental and Leasing | 55,670 | 31.32 | $ 15.23 | $ 31,670 |
| Rental and leasing services (5322, 5323, and 5324 only) | 28,030 | 9.67 | $ 17.50 | $ 36,400 |
| Drycleaning and Laundry Services | 21,530 | 9.33 | $ 12.95 | $ 26,930 |
| Real Estate | 106,700 | 6.38 | $ 17.24 | $ 35,850 |
| Automobile Dealers | 41,210 | 3.38 | $ 23.81 | $ 49,530 |
Top paying industries for Counter and Rental Clerks:
| Industry | Employment (1) | Percent of industry employment | Hourly mean wage | Annual mean wage (2) |
|---|---|---|---|---|
| Motor Vehicle Body and Trailer Manufacturing | 30 | 0.02 | $ 29.99 | $ 62,380 |
| Nonresidential Building Construction | (8) | (8) | $ 26.21 | $ 54,510 |
| Automobile Dealers | 41,210 | 3.38 | $ 23.81 | $ 49,530 |
| Residential Building Construction | (8) | (8) | $ 23.44 | $ 48,750 |
| Building Equipment Contractors | 160 | 0.01 | $ 23.29 | $ 48,440 |
States and areas with the highest published employment, location quotients, and wages for Counter and Rental Clerks are provided. For a list of all areas with employment in Counter and Rental Clerks, see the Create Customized Tables function.
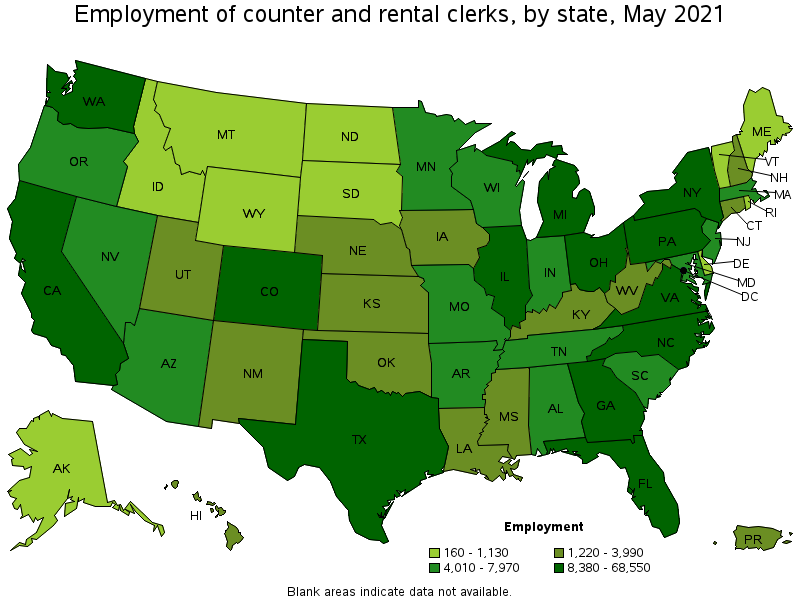
States with the highest employment level in Counter and Rental Clerks:
| State | Employment (1) | Employment per thousand jobs | Location quotient (9) | Hourly mean wage | Annual mean wage (2) |
|---|---|---|---|---|---|
| California | 68,550 | 4.15 | 1.57 | $ 18.94 | $ 39,380 |
| Texas | 35,020 | 2.86 | 1.09 | $ 16.97 | $ 35,290 |
| Florida | 24,650 | 2.86 | 1.09 | $ 15.68 | $ 32,610 |
| North Carolina | 18,170 | 4.11 | 1.56 | $ 16.06 | $ 33,400 |
| Washington | 16,060 | 5.01 | 1.90 | $ 19.49 | $ 40,530 |
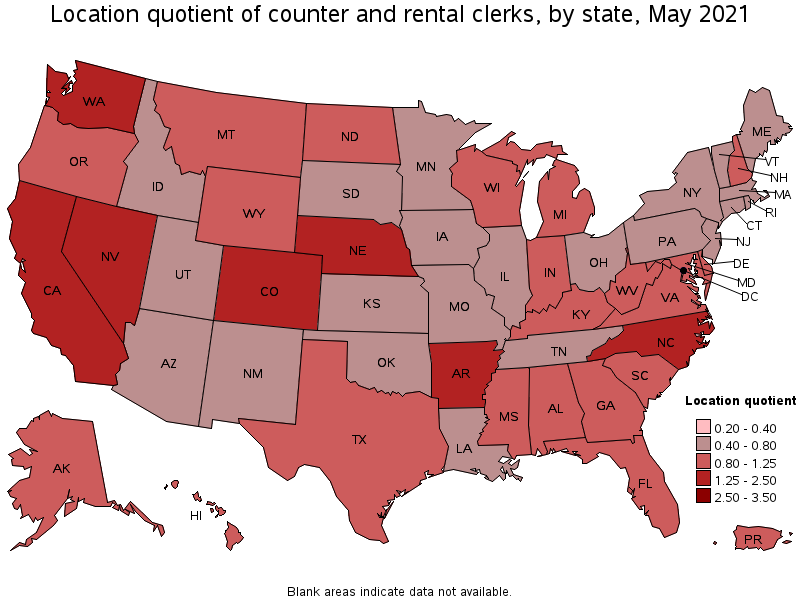
States with the highest concentration of jobs and location quotients in Counter and Rental Clerks:
| State | Employment (1) | Employment per thousand jobs | Location quotient (9) | Hourly mean wage | Annual mean wage (2) |
|---|---|---|---|---|---|
| Washington | 16,060 | 5.01 | 1.90 | $ 19.49 | $ 40,530 |
| Colorado | 11,270 | 4.30 | 1.63 | $ 20.12 | $ 41,840 |
| California | 68,550 | 4.15 | 1.57 | $ 18.94 | $ 39,380 |
| North Carolina | 18,170 | 4.11 | 1.56 | $ 16.06 | $ 33,400 |
| Arkansas | 4,590 | 3.85 | 1.46 | $ 15.10 | $ 31,400 |
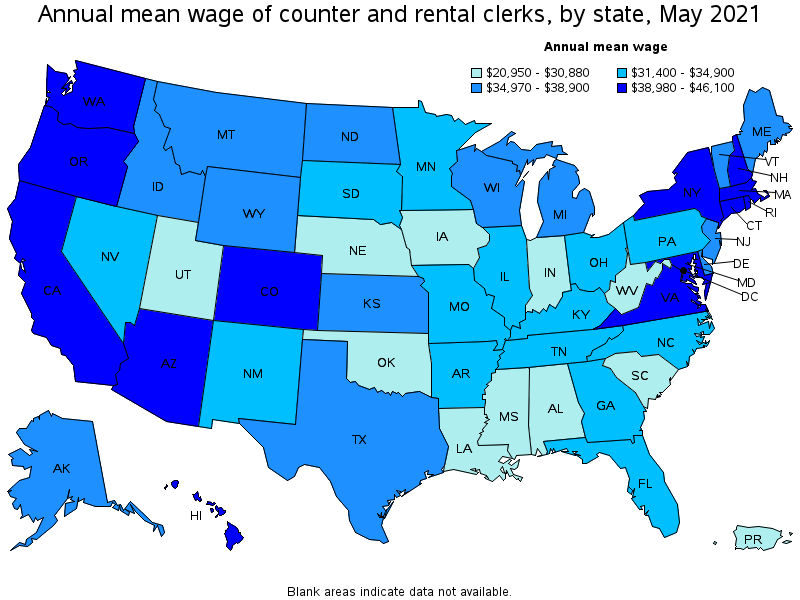
Top paying states for Counter and Rental Clerks:
| State | Employment (1) | Employment per thousand jobs | Location quotient (9) | Hourly mean wage | Annual mean wage (2) |
|---|---|---|---|---|---|
| Hawaii | 1,220 | 2.22 | 0.84 | $ 22.16 | $ 46,100 |
| Arizona | 5,970 | 2.07 | 0.79 | $ 20.91 | $ 43,490 |
| Colorado | 11,270 | 4.30 | 1.63 | $ 20.12 | $ 41,840 |
| New Hampshire | 1,970 | 3.10 | 1.17 | $ 20.09 | $ 41,780 |
| Massachusetts | 5,940 | 1.75 | 0.66 | $ 20.08 | $ 41,770 |
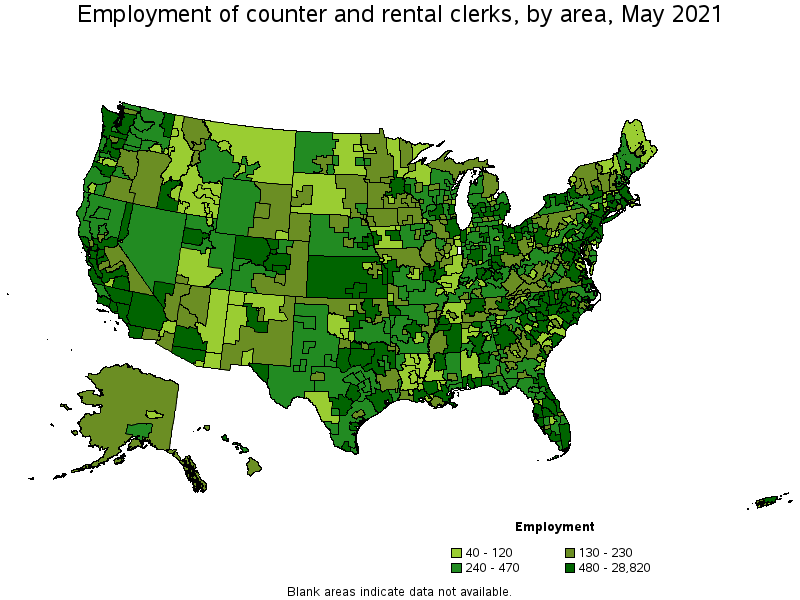
Metropolitan areas with the highest employment level in Counter and Rental Clerks:
| Metropolitan area | Employment (1) | Employment per thousand jobs | Location quotient (9) | Hourly mean wage | Annual mean wage (2) |
|---|---|---|---|---|---|
| Los Angeles-Long Beach-Anaheim, CA | 28,820 | 5.04 | 1.91 | $ 18.23 | $ 37,910 |
| New York-Newark-Jersey City, NY-NJ-PA | 12,720 | 1.47 | 0.56 | $ 19.98 | $ 41,570 |
| Dallas-Fort Worth-Arlington, TX | 10,700 | 2.98 | 1.13 | $ 17.39 | $ 36,160 |
| Seattle-Tacoma-Bellevue, WA | 10,440 | 5.44 | 2.06 | $ 20.41 | $ 42,460 |
| Houston-The Woodlands-Sugar Land, TX | 8,770 | 3.03 | 1.15 | $ 17.69 | $ 36,800 |
| Washington-Arlington-Alexandria, DC-VA-MD-WV | 7,770 | 2.65 | 1.00 | $ 20.56 | $ 42,770 |
| San Francisco-Oakland-Hayward, CA | 7,760 | 3.46 | 1.31 | $ 21.31 | $ 44,310 |
| Chicago-Naperville-Elgin, IL-IN-WI | 7,260 | 1.71 | 0.65 | $ 16.04 | $ 33,360 |
| Atlanta-Sandy Springs-Roswell, GA | 7,060 | 2.73 | 1.03 | $ 16.04 | $ 33,370 |
| Riverside-San Bernardino-Ontario, CA | 6,790 | 4.44 | 1.68 | $ 18.27 | $ 38,000 |
Metropolitan areas with the highest concentration of jobs and location quotients in Counter and Rental Clerks:
| Metropolitan area | Employment (1) | Employment per thousand jobs | Location quotient (9) | Hourly mean wage | Annual mean wage (2) |
|---|---|---|---|---|---|
| Daphne-Fairhope-Foley, AL | 580 | 7.75 | 2.94 | $ 13.70 | $ 28,500 |
| Wenatchee, WA | 330 | 7.07 | 2.68 | $ 17.08 | $ 35,520 |
| Wilmington, NC | 810 | 6.28 | 2.38 | $ 16.01 | $ 33,310 |
| Jacksonville, NC | 280 | 5.88 | 2.23 | $ 14.22 | $ 29,570 |
| Hot Springs, AR | 200 | 5.49 | 2.08 | $ 14.30 | $ 29,740 |
| Seattle-Tacoma-Bellevue, WA | 10,440 | 5.44 | 2.06 | $ 20.41 | $ 42,460 |
| Redding, CA | 350 | 5.38 | 2.04 | $ 18.26 | $ 37,970 |
| Greensboro-High Point, NC | 1,810 | 5.29 | 2.01 | $ 16.08 | $ 33,450 |
| Fayetteville, NC | 660 | 5.27 | 2.00 | $ 14.48 | $ 30,130 |
| Raleigh, NC | 3,290 | 5.19 | 1.97 | $ 16.18 | $ 33,650 |
Top paying metropolitan areas for Counter and Rental Clerks:
| Metropolitan area | Employment (1) | Employment per thousand jobs | Location quotient (9) | Hourly mean wage | Annual mean wage (2) |
|---|---|---|---|---|---|
| Urban Honolulu, HI | 720 | 1.82 | 0.69 | $ 23.44 | $ 48,760 |
| Fairbanks, AK | 100 | 2.89 | 1.09 | $ 22.64 | $ 47,080 |
| San Jose-Sunnyvale-Santa Clara, CA | 2,950 | 2.76 | 1.05 | $ 22.00 | $ 45,760 |
| Boulder, CO | 680 | 3.76 | 1.43 | $ 21.69 | $ 45,110 |
| Coeur d'Alene, ID | 100 | 1.49 | 0.57 | $ 21.54 | $ 44,800 |
| Phoenix-Mesa-Scottsdale, AZ | 4,450 | 2.10 | 0.80 | $ 21.43 | $ 44,580 |
| San Francisco-Oakland-Hayward, CA | 7,760 | 3.46 | 1.31 | $ 21.31 | $ 44,310 |
| Kahului-Wailuku-Lahaina, HI | 260 | 4.13 | 1.57 | $ 21.12 | $ 43,920 |
| Flagstaff, AZ | 130 | 2.19 | 0.83 | $ 20.91 | $ 43,480 |
| Bridgeport-Stamford-Norwalk, CT | 710 | 1.88 | 0.71 | $ 20.83 | $ 43,330 |
Nonmetropolitan areas with the highest employment in Counter and Rental Clerks:
| Nonmetropolitan area | Employment (1) | Employment per thousand jobs | Location quotient (9) | Hourly mean wage | Annual mean wage (2) |
|---|---|---|---|---|---|
| Northwest Colorado nonmetropolitan area | 730 | 6.23 | 2.36 | $ 18.84 | $ 39,180 |
| Southeast Coastal North Carolina nonmetropolitan area | 680 | 2.82 | 1.07 | $ 14.44 | $ 30,030 |
| North Texas Region of Texas nonmetropolitan area | 660 | 2.49 | 0.94 | $ 14.93 | $ 31,060 |
| Piedmont North Carolina nonmetropolitan area | 630 | 2.59 | 0.98 | $ 15.48 | $ 32,210 |
| Kansas nonmetropolitan area | 530 | 1.41 | 0.54 | $ 18.59 | $ 38,670 |
Nonmetropolitan areas with the highest concentration of jobs and location quotients in Counter and Rental Clerks:
| Nonmetropolitan area | Employment (1) | Employment per thousand jobs | Location quotient (9) | Hourly mean wage | Annual mean wage (2) |
|---|---|---|---|---|---|
| Northwest Colorado nonmetropolitan area | 730 | 6.23 | 2.36 | $ 18.84 | $ 39,180 |
| Northeast Coastal North Carolina nonmetropolitan area | 440 | 4.91 | 1.86 | $ 16.17 | $ 33,640 |
| South Florida nonmetropolitan area | 370 | 4.87 | 1.85 | $ 15.99 | $ 33,260 |
| Southwest Colorado nonmetropolitan area | 460 | 4.66 | 1.76 | $ 18.96 | $ 39,430 |
| North Coast Region of California nonmetropolitan area | 430 | 4.34 | 1.65 | $ 17.70 | $ 36,820 |
Top paying nonmetropolitan areas for Counter and Rental Clerks:
| Nonmetropolitan area | Employment (1) | Employment per thousand jobs | Location quotient (9) | Hourly mean wage | Annual mean wage (2) |
|---|---|---|---|---|---|
| Central New Hampshire nonmetropolitan area | 300 | 3.35 | 1.27 | $ 20.64 | $ 42,930 |
| West Central-Southwest New Hampshire nonmetropolitan area | 190 | 2.00 | 0.76 | $ 19.88 | $ 41,360 |
| Western Wyoming nonmetropolitan area | 320 | 3.38 | 1.28 | $ 19.58 | $ 40,730 |
| Hawaii / Kauai nonmetropolitan area | 230 | 2.59 | 0.98 | $ 19.46 | $ 40,470 |
| Northern New Hampshire nonmetropolitan area | 90 | 2.65 | 1.01 | $ 19.33 | $ 40,200 |
These estimates are calculated with data collected from employers in all industry sectors, all metropolitan and nonmetropolitan areas, and all states and the District of Columbia. The top employment and wage figures are provided above. The complete list is available in the downloadable XLS files.
The percentile wage estimate is the value of a wage below which a certain percent of workers fall. The median wage is the 50th percentile wage estimate—50 percent of workers earn less than the median and 50 percent of workers earn more than the median. More about percentile wages.
(1) Estimates for detailed occupations do not sum to the totals because the totals include occupations not shown separately. Estimates do not include self-employed workers.
(2) Annual wages have been calculated by multiplying the hourly mean wage by a "year-round, full-time" hours figure of 2,080 hours; for those occupations where there is not an hourly wage published, the annual wage has been directly calculated from the reported survey data.
(3) The relative standard error (RSE) is a measure of the reliability of a survey statistic. The smaller the relative standard error, the more precise the estimate.
(8) Estimate not released.
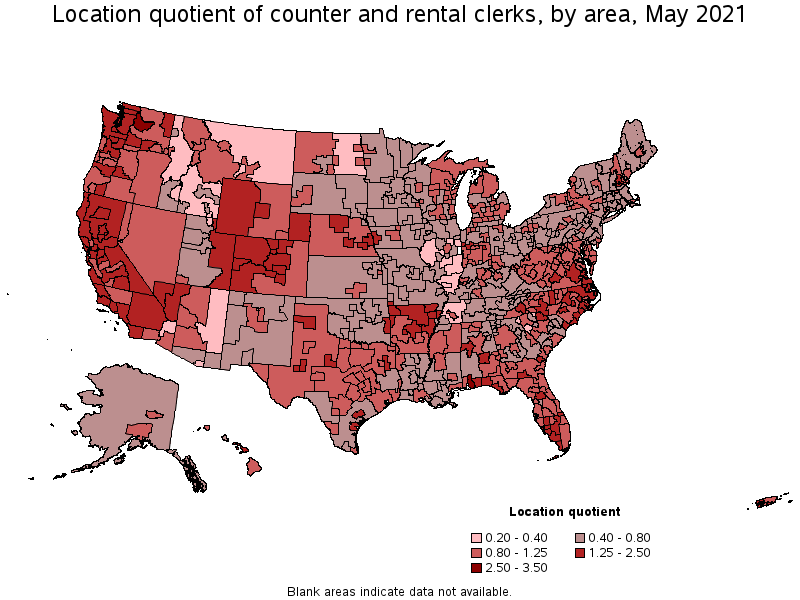
(9) The location quotient is the ratio of the area concentration of occupational employment to the national average concentration. A location quotient greater than one indicates the occupation has a higher share of employment than average, and a location quotient less than one indicates the occupation is less prevalent in the area than average.
Other OEWS estimates and related information:
May 2021 National Occupational Employment and Wage Estimates
May 2021 State Occupational Employment and Wage Estimates
May 2021 Metropolitan and Nonmetropolitan Area Occupational Employment and Wage Estimates
May 2021 National Industry-Specific Occupational Employment and Wage Estimates
Last Modified Date: March 31, 2022