
An official website of the United States government
An official website of the United States government
The .gov means it's official.
Federal government websites often end in .gov or .mil. Before sharing sensitive information,
make sure you're on a federal government site.
The site is secure.
The
https:// ensures that you are connecting to the official website and that any
information you provide is encrypted and transmitted securely.
Sell spare and replacement parts and equipment in repair shop or parts store.
Employment estimate and mean wage estimates for Parts Salespersons:
| Employment (1) | Employment RSE (3) |
Mean hourly wage |
Mean annual wage (2) |
Wage RSE (3) |
|---|---|---|---|---|
| 265,130 | 1.0 % | $ 17.75 | $ 36,920 | 0.5 % |
Percentile wage estimates for Parts Salespersons:
| Percentile | 10% | 25% | 50% (Median) |
75% | 90% |
|---|---|---|---|---|---|
| Hourly Wage | $ 11.03 | $ 13.71 | $ 16.47 | $ 21.80 | $ 27.97 |
| Annual Wage (2) | $ 22,940 | $ 28,530 | $ 34,260 | $ 45,340 | $ 58,180 |
Industries with the highest published employment and wages for Parts Salespersons are provided. For a list of all industries with employment in Parts Salespersons, see the Create Customized Tables function.
Industries with the highest levels of employment in Parts Salespersons:
| Industry | Employment (1) | Percent of industry employment | Hourly mean wage | Annual mean wage (2) |
|---|---|---|---|---|
| Automotive Parts, Accessories, and Tire Stores | 120,110 | 22.14 | $ 14.43 | $ 30,020 |
| Automobile Dealers | 55,940 | 4.58 | $ 20.64 | $ 42,940 |
| Machinery, Equipment, and Supplies Merchant Wholesalers | 23,270 | 3.43 | $ 21.79 | $ 45,320 |
| Motor Vehicle and Motor Vehicle Parts and Supplies Merchant Wholesalers | 21,090 | 6.21 | $ 20.56 | $ 42,760 |
| Other Motor Vehicle Dealers | 11,700 | 7.16 | $ 17.52 | $ 36,440 |
Industries with the highest concentration of employment in Parts Salespersons:
| Industry | Employment (1) | Percent of industry employment | Hourly mean wage | Annual mean wage (2) |
|---|---|---|---|---|
| Automotive Parts, Accessories, and Tire Stores | 120,110 | 22.14 | $ 14.43 | $ 30,020 |
| Other Motor Vehicle Dealers | 11,700 | 7.16 | $ 17.52 | $ 36,440 |
| Motor Vehicle and Motor Vehicle Parts and Supplies Merchant Wholesalers | 21,090 | 6.21 | $ 20.56 | $ 42,760 |
| Automobile Dealers | 55,940 | 4.58 | $ 20.64 | $ 42,940 |
| Machinery, Equipment, and Supplies Merchant Wholesalers | 23,270 | 3.43 | $ 21.79 | $ 45,320 |
Top paying industries for Parts Salespersons:
| Industry | Employment (1) | Percent of industry employment | Hourly mean wage | Annual mean wage (2) |
|---|---|---|---|---|
| Other Specialty Trade Contractors | 40 | 0.01 | $ 29.45 | $ 61,260 |
| Automotive Equipment Rental and Leasing | 230 | 0.13 | $ 25.90 | $ 53,880 |
| Metalworking Machinery Manufacturing | 90 | 0.06 | $ 25.67 | $ 53,390 |
| Engine, Turbine, and Power Transmission Equipment Manufacturing | 50 | 0.05 | $ 25.65 | $ 53,360 |
| Motor Vehicle Parts Manufacturing | 170 | 0.03 | $ 24.11 | $ 50,150 |
States and areas with the highest published employment, location quotients, and wages for Parts Salespersons are provided. For a list of all areas with employment in Parts Salespersons, see the Create Customized Tables function.
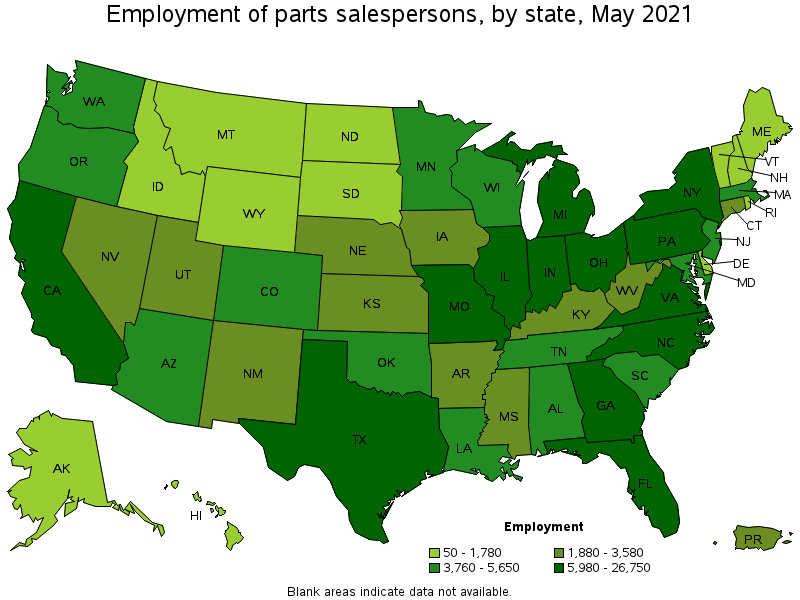
States with the highest employment level in Parts Salespersons:
| State | Employment (1) | Employment per thousand jobs | Location quotient (9) | Hourly mean wage | Annual mean wage (2) |
|---|---|---|---|---|---|
| Texas | 26,750 | 2.19 | 1.16 | $ 17.00 | $ 35,360 |
| California | 26,540 | 1.61 | 0.85 | $ 19.28 | $ 40,100 |
| Florida | 14,770 | 1.72 | 0.91 | $ 16.10 | $ 33,480 |
| New York | 11,240 | 1.30 | 0.69 | $ 21.02 | $ 43,730 |
| Pennsylvania | 10,280 | 1.84 | 0.98 | $ 16.93 | $ 35,210 |
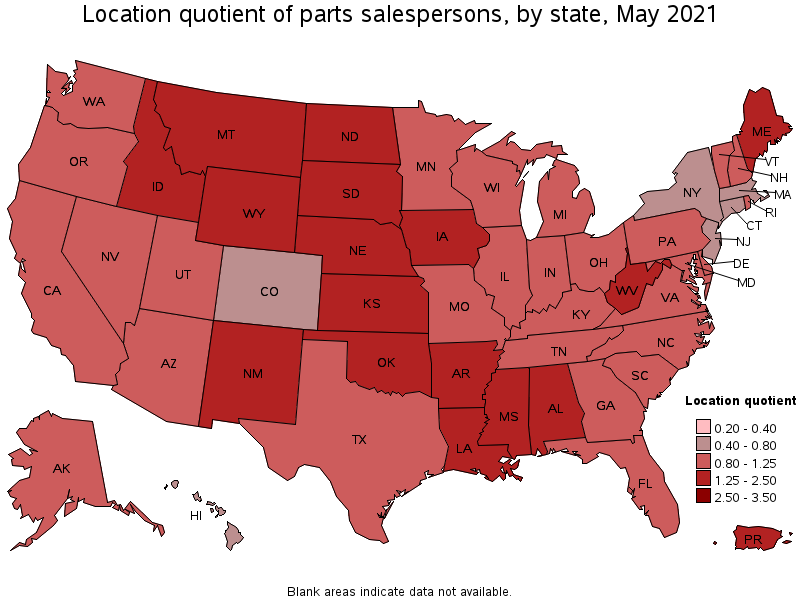
States with the highest concentration of jobs and location quotients in Parts Salespersons:
| State | Employment (1) | Employment per thousand jobs | Location quotient (9) | Hourly mean wage | Annual mean wage (2) |
|---|---|---|---|---|---|
| North Dakota | 1,630 | 4.12 | 2.19 | $ 21.12 | $ 43,930 |
| South Dakota | 1,650 | 3.93 | 2.09 | $ 19.15 | $ 39,820 |
| Montana | 1,460 | 3.11 | 1.65 | $ 18.27 | $ 37,990 |
| West Virginia | 1,980 | 3.00 | 1.60 | $ 14.66 | $ 30,490 |
| Wyoming | 760 | 2.94 | 1.56 | $ 19.70 | $ 40,970 |
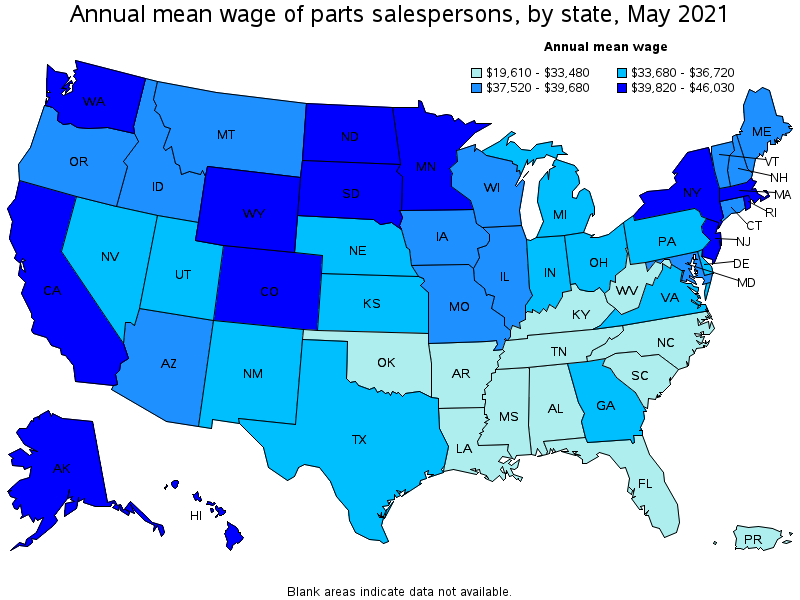
Top paying states for Parts Salespersons:
| State | Employment (1) | Employment per thousand jobs | Location quotient (9) | Hourly mean wage | Annual mean wage (2) |
|---|---|---|---|---|---|
| New Jersey | 5,000 | 1.30 | 0.69 | $ 22.13 | $ 46,030 |
| Massachusetts | 4,280 | 1.26 | 0.67 | $ 21.84 | $ 45,430 |
| Hawaii | 670 | 1.22 | 0.65 | $ 21.41 | $ 44,540 |
| North Dakota | 1,630 | 4.12 | 2.19 | $ 21.12 | $ 43,930 |
| New York | 11,240 | 1.30 | 0.69 | $ 21.02 | $ 43,730 |
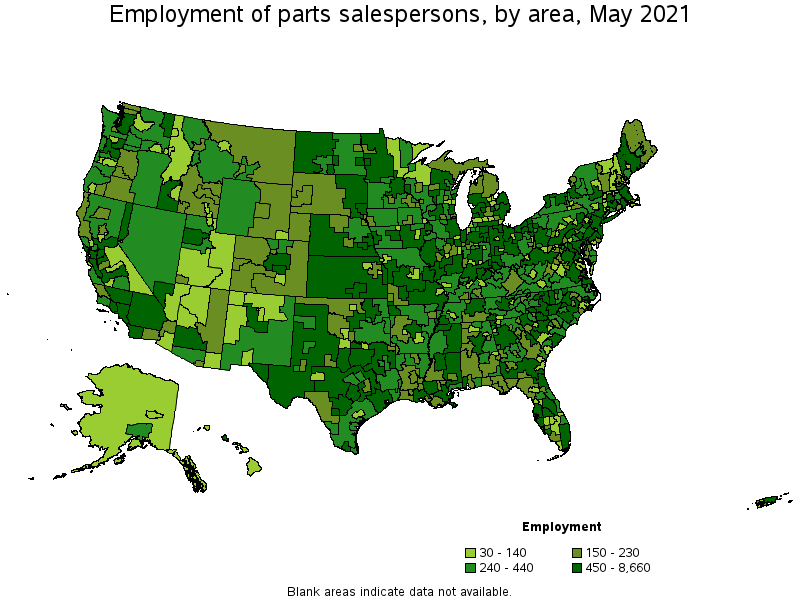
Metropolitan areas with the highest employment level in Parts Salespersons:
| Metropolitan area | Employment (1) | Employment per thousand jobs | Location quotient (9) | Hourly mean wage | Annual mean wage (2) |
|---|---|---|---|---|---|
| New York-Newark-Jersey City, NY-NJ-PA | 8,660 | 1.00 | 0.53 | $ 23.24 | $ 48,330 |
| Los Angeles-Long Beach-Anaheim, CA | 8,400 | 1.47 | 0.78 | $ 18.99 | $ 39,510 |
| Dallas-Fort Worth-Arlington, TX | 7,750 | 2.16 | 1.15 | $ 17.78 | $ 36,970 |
| Chicago-Naperville-Elgin, IL-IN-WI | 6,410 | 1.52 | 0.81 | $ 19.51 | $ 40,570 |
| Houston-The Woodlands-Sugar Land, TX | 6,080 | 2.10 | 1.12 | $ 17.23 | $ 35,840 |
| Atlanta-Sandy Springs-Roswell, GA | 5,670 | 2.19 | 1.16 | $ 17.03 | $ 35,410 |
| Miami-Fort Lauderdale-West Palm Beach, FL | 4,060 | 1.66 | 0.88 | $ 16.93 | $ 35,220 |
| Phoenix-Mesa-Scottsdale, AZ | 4,040 | 1.91 | 1.02 | $ 18.22 | $ 37,900 |
| Washington-Arlington-Alexandria, DC-VA-MD-WV | 3,700 | 1.26 | 0.67 | $ 19.39 | $ 40,320 |
| Riverside-San Bernardino-Ontario, CA | 3,610 | 2.36 | 1.25 | $ 18.50 | $ 38,470 |
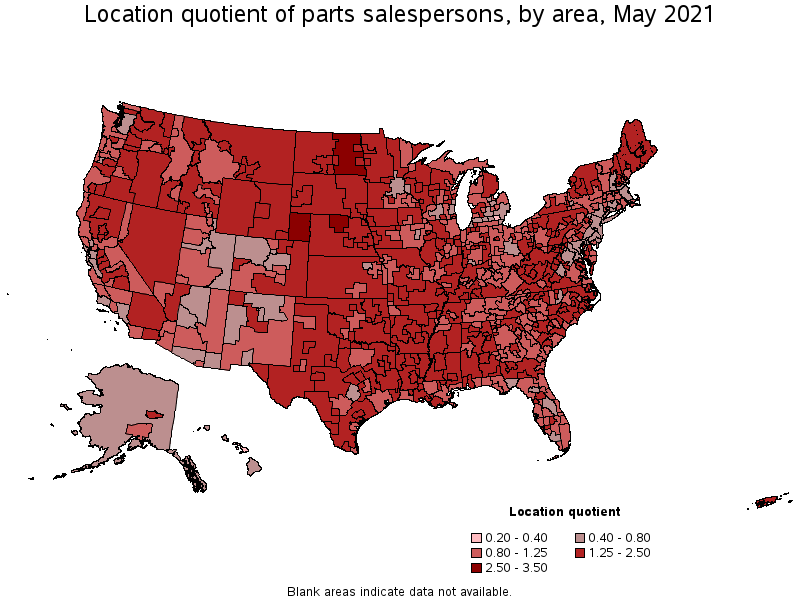
Metropolitan areas with the highest concentration of jobs and location quotients in Parts Salespersons:
| Metropolitan area | Employment (1) | Employment per thousand jobs | Location quotient (9) | Hourly mean wage | Annual mean wage (2) |
|---|---|---|---|---|---|
| Odessa, TX | 310 | 4.69 | 2.49 | $ 18.99 | $ 39,500 |
| Watertown-Fort Drum, NY | 170 | 4.61 | 2.45 | $ 17.35 | $ 36,080 |
| Hammond, LA | 200 | 4.53 | 2.41 | $ 14.51 | $ 30,170 |
| Casper, WY | 160 | 4.50 | 2.39 | $ 21.33 | $ 44,360 |
| Sioux Falls, SD | 670 | 4.28 | 2.27 | $ 19.92 | $ 41,430 |
| Bangor, ME | 260 | 4.22 | 2.24 | $ 19.06 | $ 39,640 |
| Dothan, AL | 240 | 4.17 | 2.22 | $ 14.60 | $ 30,370 |
| Billings, MT | 330 | 3.97 | 2.11 | $ 19.60 | $ 40,770 |
| Goldsboro, NC | 160 | 3.94 | 2.09 | $ 14.60 | $ 30,370 |
| Macon, GA | 370 | 3.88 | 2.06 | $ 13.96 | $ 29,040 |
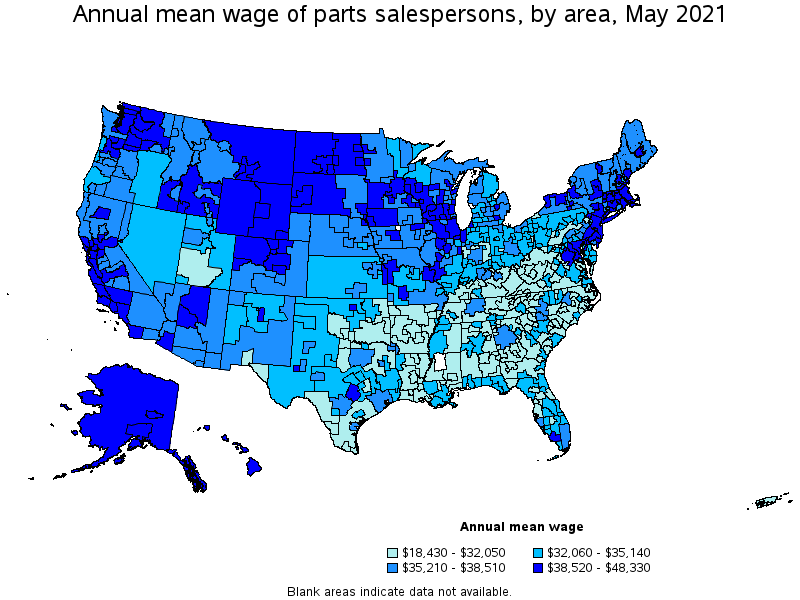
Top paying metropolitan areas for Parts Salespersons:
| Metropolitan area | Employment (1) | Employment per thousand jobs | Location quotient (9) | Hourly mean wage | Annual mean wage (2) |
|---|---|---|---|---|---|
| New York-Newark-Jersey City, NY-NJ-PA | 8,660 | 1.00 | 0.53 | $ 23.24 | $ 48,330 |
| Danville, IL | 60 | 2.38 | 1.26 | $ 23.12 | $ 48,080 |
| Barnstable Town, MA | 220 | 2.27 | 1.21 | $ 22.90 | $ 47,620 |
| San Jose-Sunnyvale-Santa Clara, CA | 890 | 0.83 | 0.44 | $ 22.76 | $ 47,330 |
| Boston-Cambridge-Nashua, MA-NH | 2,870 | 1.11 | 0.59 | $ 22.16 | $ 46,090 |
| Pittsfield, MA | 70 | 1.86 | 0.99 | $ 22.13 | $ 46,020 |
| Seattle-Tacoma-Bellevue, WA | 2,690 | 1.40 | 0.74 | $ 21.88 | $ 45,510 |
| San Francisco-Oakland-Hayward, CA | 2,370 | 1.06 | 0.56 | $ 21.65 | $ 45,040 |
| Denver-Aurora-Lakewood, CO | 1,660 | 1.13 | 0.60 | $ 21.63 | $ 44,990 |
| Bellingham, WA | 180 | 2.12 | 1.13 | $ 21.54 | $ 44,790 |
Nonmetropolitan areas with the highest employment in Parts Salespersons:
| Nonmetropolitan area | Employment (1) | Employment per thousand jobs | Location quotient (9) | Hourly mean wage | Annual mean wage (2) |
|---|---|---|---|---|---|
| Kansas nonmetropolitan area | 1,360 | 3.62 | 1.92 | $ 16.54 | $ 34,390 |
| North Texas Region of Texas nonmetropolitan area | 800 | 2.99 | 1.59 | $ 15.08 | $ 31,360 |
| Southeast Coastal North Carolina nonmetropolitan area | 760 | 3.18 | 1.69 | $ 13.98 | $ 29,090 |
| North Northeastern Ohio nonmetropolitan area (noncontiguous) | 650 | 2.07 | 1.10 | $ 16.25 | $ 33,790 |
| Piedmont North Carolina nonmetropolitan area | 650 | 2.64 | 1.40 | $ 13.82 | $ 28,750 |
Nonmetropolitan areas with the highest concentration of jobs and location quotients in Parts Salespersons:
| Nonmetropolitan area | Employment (1) | Employment per thousand jobs | Location quotient (9) | Hourly mean wage | Annual mean wage (2) |
|---|---|---|---|---|---|
| Northwest Nebraska nonmetropolitan area | 200 | 5.33 | 2.83 | $ 17.30 | $ 35,980 |
| East North Dakota nonmetropolitan area | 300 | 4.87 | 2.59 | $ 21.45 | $ 44,610 |
| West North Dakota nonmetropolitan area | 480 | 4.53 | 2.41 | $ 21.30 | $ 44,300 |
| Eastern Oregon nonmetropolitan area | 290 | 4.10 | 2.18 | $ 16.77 | $ 34,890 |
| East Central Illinois nonmetropolitan area | 460 | 4.07 | 2.16 | $ 16.89 | $ 35,120 |
Top paying nonmetropolitan areas for Parts Salespersons:
| Nonmetropolitan area | Employment (1) | Employment per thousand jobs | Location quotient (9) | Hourly mean wage | Annual mean wage (2) |
|---|---|---|---|---|---|
| Hawaii / Kauai nonmetropolitan area | 110 | 1.22 | 0.65 | $ 23.09 | $ 48,030 |
| East North Dakota nonmetropolitan area | 300 | 4.87 | 2.59 | $ 21.45 | $ 44,610 |
| West North Dakota nonmetropolitan area | 480 | 4.53 | 2.41 | $ 21.30 | $ 44,300 |
| Southwest Minnesota nonmetropolitan area | 430 | 3.73 | 1.98 | $ 20.88 | $ 43,430 |
| Massachusetts nonmetropolitan area | 100 | 1.72 | 0.91 | $ 20.47 | $ 42,580 |
These estimates are calculated with data collected from employers in all industry sectors, all metropolitan and nonmetropolitan areas, and all states and the District of Columbia. The top employment and wage figures are provided above. The complete list is available in the downloadable XLS files.
The percentile wage estimate is the value of a wage below which a certain percent of workers fall. The median wage is the 50th percentile wage estimate—50 percent of workers earn less than the median and 50 percent of workers earn more than the median. More about percentile wages.
(1) Estimates for detailed occupations do not sum to the totals because the totals include occupations not shown separately. Estimates do not include self-employed workers.
(2) Annual wages have been calculated by multiplying the hourly mean wage by a "year-round, full-time" hours figure of 2,080 hours; for those occupations where there is not an hourly wage published, the annual wage has been directly calculated from the reported survey data.
(3) The relative standard error (RSE) is a measure of the reliability of a survey statistic. The smaller the relative standard error, the more precise the estimate.
(9) The location quotient is the ratio of the area concentration of occupational employment to the national average concentration. A location quotient greater than one indicates the occupation has a higher share of employment than average, and a location quotient less than one indicates the occupation is less prevalent in the area than average.
Other OEWS estimates and related information:
May 2021 National Occupational Employment and Wage Estimates
May 2021 State Occupational Employment and Wage Estimates
May 2021 Metropolitan and Nonmetropolitan Area Occupational Employment and Wage Estimates
May 2021 National Industry-Specific Occupational Employment and Wage Estimates
Last Modified Date: March 31, 2022