
An official website of the United States government
An official website of the United States government
The .gov means it's official.
Federal government websites often end in .gov or .mil. Before sharing sensitive information,
make sure you're on a federal government site.
The site is secure.
The
https:// ensures that you are connecting to the official website and that any
information you provide is encrypted and transmitted securely.
Plan and sell transportation and accommodations for customers. Determine destination, modes of transportation, travel dates, costs, and accommodations required. May also describe, plan, and arrange itineraries and sell tour packages. May assist in resolving clients� travel problems.
Employment estimate and mean wage estimates for Travel Agents:
| Employment (1) | Employment RSE (3) |
Mean hourly wage |
Mean annual wage (2) |
Wage RSE (3) |
|---|---|---|---|---|
| 37,190 | 2.4 % | $ 22.39 | $ 46,580 | 1.4 % |
Percentile wage estimates for Travel Agents:
| Percentile | 10% | 25% | 50% (Median) |
75% | 90% |
|---|---|---|---|---|---|
| Hourly Wage | $ 13.60 | $ 15.00 | $ 21.06 | $ 26.37 | $ 35.68 |
| Annual Wage (2) | $ 28,280 | $ 31,200 | $ 43,810 | $ 54,840 | $ 74,220 |
Industries with the highest published employment and wages for Travel Agents are provided. For a list of all industries with employment in Travel Agents, see the Create Customized Tables function.
Industries with the highest levels of employment in Travel Agents:
| Industry | Employment (1) | Percent of industry employment | Hourly mean wage | Annual mean wage (2) |
|---|---|---|---|---|
| Travel Arrangement and Reservation Services | 31,310 | 23.63 | $ 22.05 | $ 45,860 |
| Management of Companies and Enterprises | 660 | 0.03 | $ 23.66 | $ 49,200 |
| Traveler Accommodation | 210 | 0.02 | $ 16.58 | $ 34,480 |
| Other Amusement and Recreation Industries | 140 | 0.01 | $ 16.49 | $ 34,310 |
| Nonscheduled Air Transportation | 80 | 0.17 | $ 30.76 | $ 63,980 |
Industries with the highest concentration of employment in Travel Agents:
| Industry | Employment (1) | Percent of industry employment | Hourly mean wage | Annual mean wage (2) |
|---|---|---|---|---|
| Travel Arrangement and Reservation Services | 31,310 | 23.63 | $ 22.05 | $ 45,860 |
| Scenic and Sightseeing Transportation, Land | 50 | 0.73 | $ 22.77 | $ 47,360 |
| Charter Bus Industry | 40 | 0.26 | $ 20.20 | $ 42,020 |
| Nonscheduled Air Transportation | 80 | 0.17 | $ 30.76 | $ 63,980 |
| Management of Companies and Enterprises | 660 | 0.03 | $ 23.66 | $ 49,200 |
Top paying industries for Travel Agents:
| Industry | Employment (1) | Percent of industry employment | Hourly mean wage | Annual mean wage (2) |
|---|---|---|---|---|
| Nonscheduled Air Transportation | 80 | 0.17 | $ 30.76 | $ 63,980 |
| Computer Systems Design and Related Services | 40 | (7) | $ 27.61 | $ 57,430 |
| Management, Scientific, and Technical Consulting Services | (8) | (8) | $ 26.89 | $ 55,940 |
| Agencies, Brokerages, and Other Insurance Related Activities | (8) | (8) | $ 26.80 | $ 55,730 |
| Other Support Services | 70 | 0.02 | $ 26.24 | $ 54,570 |
States and areas with the highest published employment, location quotients, and wages for Travel Agents are provided. For a list of all areas with employment in Travel Agents, see the Create Customized Tables function.
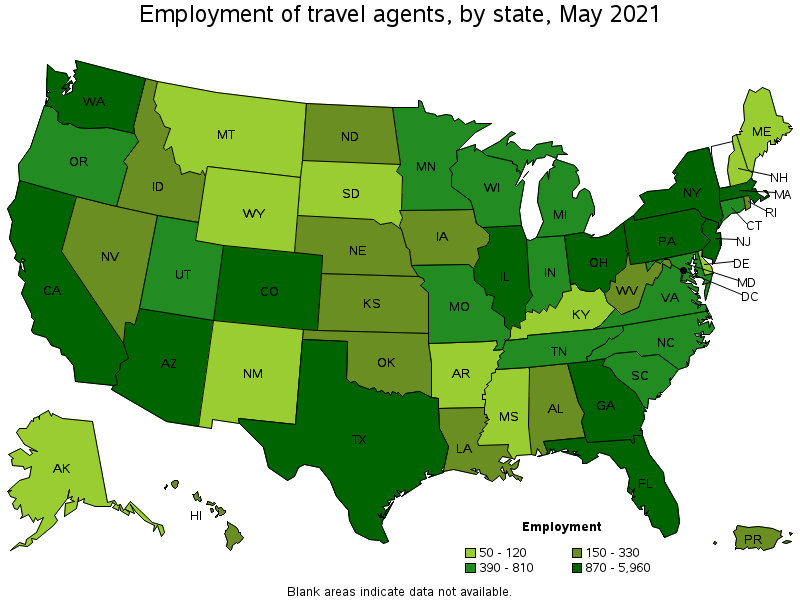
States with the highest employment level in Travel Agents:
| State | Employment (1) | Employment per thousand jobs | Location quotient (9) | Hourly mean wage | Annual mean wage (2) |
|---|---|---|---|---|---|
| Florida | 5,960 | 0.69 | 2.63 | $ 21.75 | $ 45,240 |
| California | 3,730 | 0.23 | 0.85 | $ 24.25 | $ 50,440 |
| Texas | 2,540 | 0.21 | 0.79 | $ 22.39 | $ 46,560 |
| New York | 2,480 | 0.29 | 1.08 | $ 23.67 | $ 49,240 |
| Illinois | 2,020 | 0.36 | 1.36 | $ 23.20 | $ 48,260 |
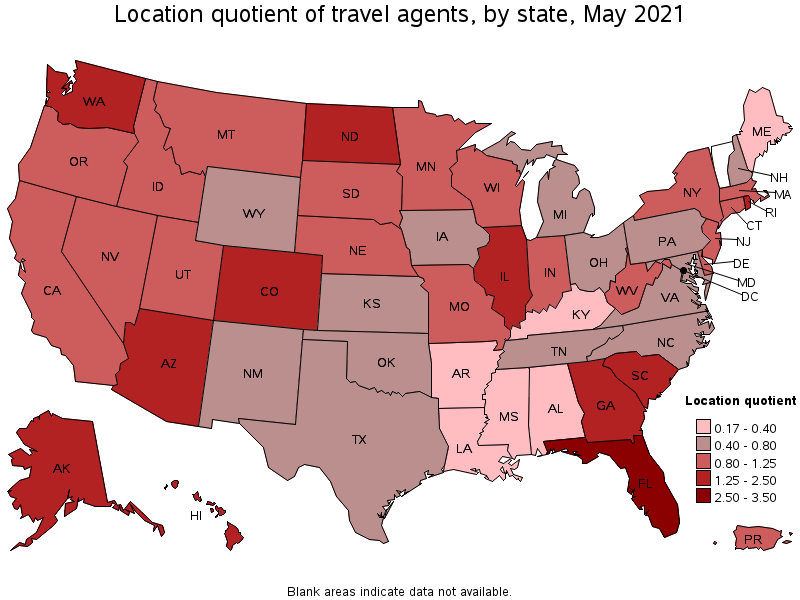
States with the highest concentration of jobs and location quotients in Travel Agents:
| State | Employment (1) | Employment per thousand jobs | Location quotient (9) | Hourly mean wage | Annual mean wage (2) |
|---|---|---|---|---|---|
| Florida | 5,960 | 0.69 | 2.63 | $ 21.75 | $ 45,240 |
| Hawaii | 290 | 0.52 | 1.98 | $ 22.01 | $ 45,780 |
| North Dakota | 190 | 0.49 | 1.84 | $ 16.73 | $ 34,800 |
| Colorado | 1,070 | 0.41 | 1.55 | $ 23.24 | $ 48,330 |
| Rhode Island | 180 | 0.39 | 1.46 | $ 20.52 | $ 42,690 |
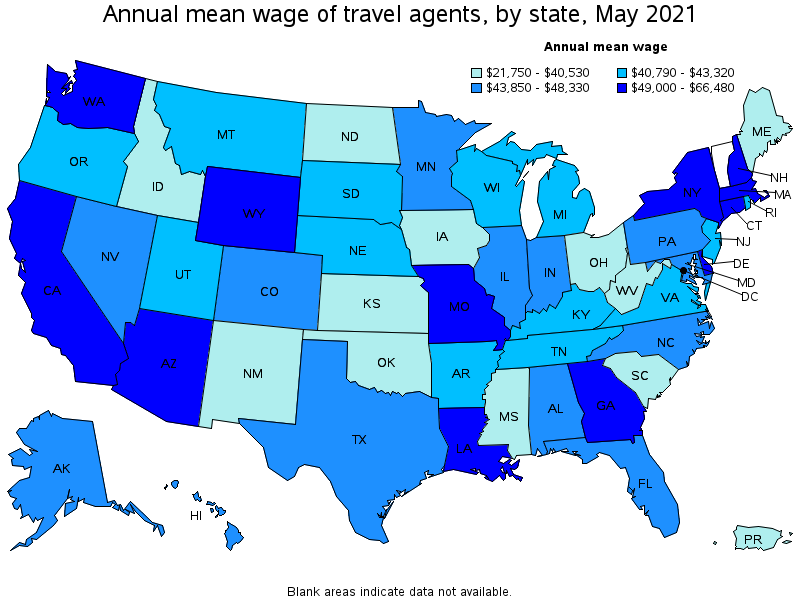
Top paying states for Travel Agents:
| State | Employment (1) | Employment per thousand jobs | Location quotient (9) | Hourly mean wage | Annual mean wage (2) |
|---|---|---|---|---|---|
| Connecticut | 390 | 0.24 | 0.93 | $ 31.96 | $ 66,480 |
| Arizona | 960 | 0.33 | 1.26 | $ 26.75 | $ 55,640 |
| Delaware | 110 | 0.25 | 0.93 | $ 25.83 | $ 53,720 |
| District of Columbia | 110 | 0.17 | 0.65 | $ 25.58 | $ 53,210 |
| Washington | 1,060 | 0.33 | 1.25 | $ 25.46 | $ 52,970 |
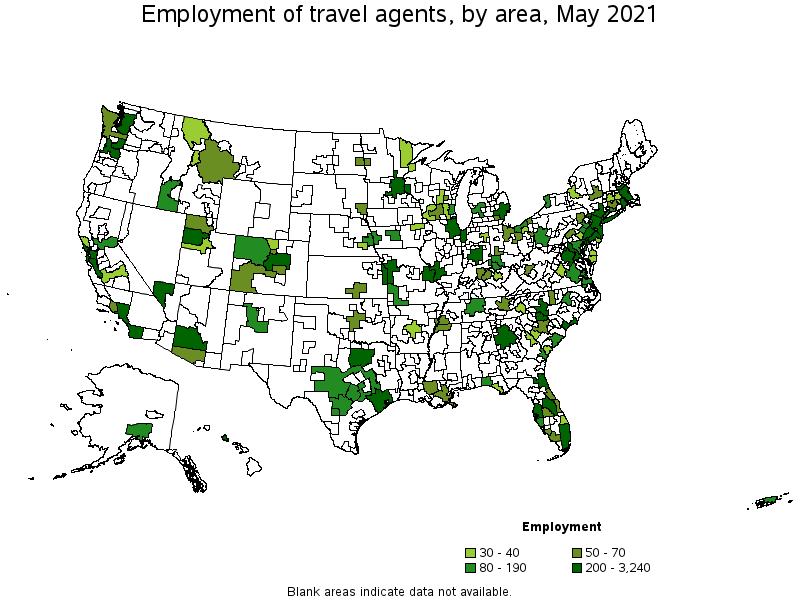
Metropolitan areas with the highest employment level in Travel Agents:
| Metropolitan area | Employment (1) | Employment per thousand jobs | Location quotient (9) | Hourly mean wage | Annual mean wage (2) |
|---|---|---|---|---|---|
| Miami-Fort Lauderdale-West Palm Beach, FL | 3,240 | 1.32 | 5.01 | $ 23.55 | $ 48,980 |
| New York-Newark-Jersey City, NY-NJ-PA | 2,730 | 0.31 | 1.19 | $ 23.53 | $ 48,950 |
| Los Angeles-Long Beach-Anaheim, CA | 1,870 | 0.33 | 1.24 | $ 23.02 | $ 47,870 |
| Chicago-Naperville-Elgin, IL-IN-WI | 1,830 | 0.43 | 1.64 | $ 23.61 | $ 49,110 |
| Atlanta-Sandy Springs-Roswell, GA | 1,100 | 0.42 | 1.61 | $ 25.08 | $ 52,170 |
| Orlando-Kissimmee-Sanford, FL | 1,080 | 0.92 | 3.50 | $ 17.86 | $ 37,150 |
| Dallas-Fort Worth-Arlington, TX | 970 | 0.27 | 1.03 | $ 24.78 | $ 51,540 |
| Boston-Cambridge-Nashua, MA-NH | 900 | 0.35 | 1.32 | $ 25.98 | $ 54,040 |
| Seattle-Tacoma-Bellevue, WA | 810 | 0.42 | 1.59 | $ 26.90 | $ 55,960 |
| Phoenix-Mesa-Scottsdale, AZ | 800 | 0.38 | 1.42 | $ 27.88 | $ 57,990 |
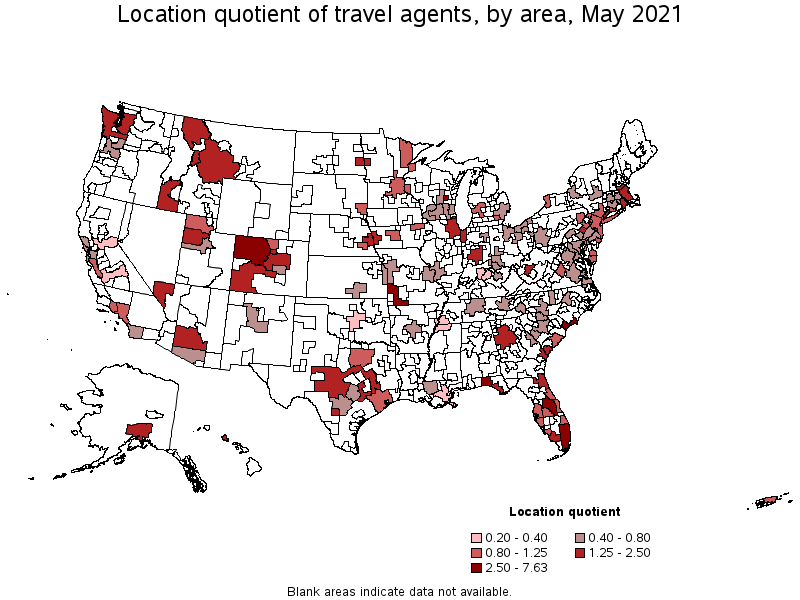
Metropolitan areas with the highest concentration of jobs and location quotients in Travel Agents:
| Metropolitan area | Employment (1) | Employment per thousand jobs | Location quotient (9) | Hourly mean wage | Annual mean wage (2) |
|---|---|---|---|---|---|
| Myrtle Beach-Conway-North Myrtle Beach, SC-NC | 330 | 2.01 | 7.63 | $ 16.42 | $ 34,150 |
| Miami-Fort Lauderdale-West Palm Beach, FL | 3,240 | 1.32 | 5.01 | $ 23.55 | $ 48,980 |
| Crestview-Fort Walton Beach-Destin, FL | 120 | 1.05 | 3.97 | $ 16.87 | $ 35,080 |
| Orlando-Kissimmee-Sanford, FL | 1,080 | 0.92 | 3.50 | $ 17.86 | $ 37,150 |
| Oshkosh-Neenah, WI | 70 | 0.74 | 2.81 | $ 21.01 | $ 43,710 |
| Reading, PA | 110 | 0.66 | 2.48 | $ 24.16 | $ 50,250 |
| Charleston, WV | 60 | 0.63 | 2.39 | $ 19.71 | $ 40,990 |
| Panama City, FL | 40 | 0.56 | 2.13 | $ 15.55 | $ 32,340 |
| Urban Honolulu, HI | 220 | 0.55 | 2.07 | $ 21.84 | $ 45,430 |
| Indianapolis-Carmel-Anderson, IN | 510 | 0.50 | 1.91 | $ 21.76 | $ 45,250 |
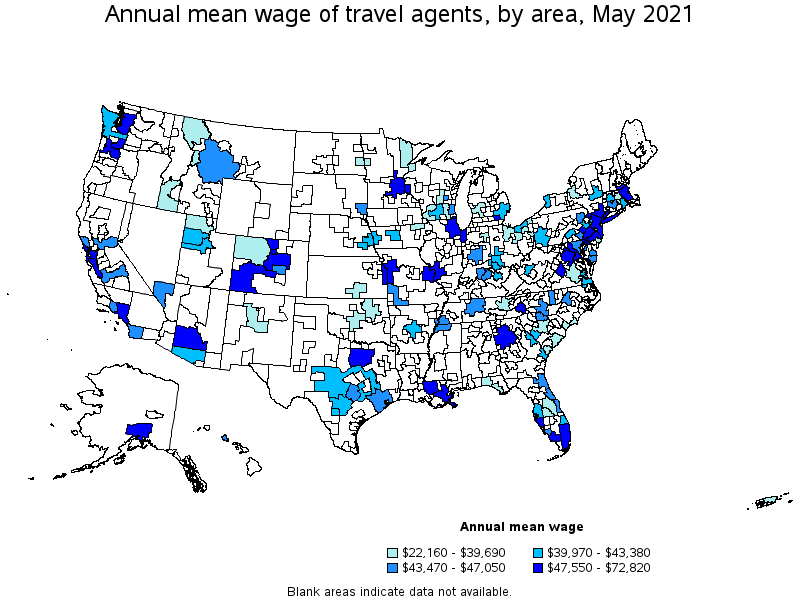
Top paying metropolitan areas for Travel Agents:
| Metropolitan area | Employment (1) | Employment per thousand jobs | Location quotient (9) | Hourly mean wage | Annual mean wage (2) |
|---|---|---|---|---|---|
| Bridgeport-Stamford-Norwalk, CT | 140 | 0.37 | 1.39 | $ 35.01 | $ 72,820 |
| San Jose-Sunnyvale-Santa Clara, CA | 230 | 0.22 | 0.82 | $ 28.42 | $ 59,110 |
| Phoenix-Mesa-Scottsdale, AZ | 800 | 0.38 | 1.42 | $ 27.88 | $ 57,990 |
| Boulder, CO | 70 | 0.41 | 1.54 | $ 27.02 | $ 56,210 |
| Seattle-Tacoma-Bellevue, WA | 810 | 0.42 | 1.59 | $ 26.90 | $ 55,960 |
| Baton Rouge, LA | 50 | 0.13 | 0.50 | $ 26.34 | $ 54,790 |
| Charlottesville, VA | 30 | 0.30 | 1.13 | $ 26.08 | $ 54,240 |
| Boston-Cambridge-Nashua, MA-NH | 900 | 0.35 | 1.32 | $ 25.98 | $ 54,040 |
| San Francisco-Oakland-Hayward, CA | 460 | 0.21 | 0.78 | $ 25.20 | $ 52,420 |
| Atlanta-Sandy Springs-Roswell, GA | 1,100 | 0.42 | 1.61 | $ 25.08 | $ 52,170 |
Nonmetropolitan areas with the highest employment in Travel Agents:
| Nonmetropolitan area | Employment (1) | Employment per thousand jobs | Location quotient (9) | Hourly mean wage | Annual mean wage (2) |
|---|---|---|---|---|---|
| Southwest Missouri nonmetropolitan area | 120 | 1.68 | 6.37 | $ 21.35 | $ 44,400 |
| Northwest Colorado nonmetropolitan area | 110 | 0.96 | 3.66 | $ 19.08 | $ 39,690 |
| Hill Country Region of Texas nonmetropolitan area | 90 | 0.46 | 1.73 | $ 19.53 | $ 40,630 |
| North Northeastern Ohio nonmetropolitan area (noncontiguous) | 60 | 0.19 | 0.71 | $ 17.17 | $ 35,720 |
| Southwest Colorado nonmetropolitan area | 60 | 0.57 | 2.16 | $ 29.67 | $ 61,710 |
Nonmetropolitan areas with the highest concentration of jobs and location quotients in Travel Agents:
| Nonmetropolitan area | Employment (1) | Employment per thousand jobs | Location quotient (9) | Hourly mean wage | Annual mean wage (2) |
|---|---|---|---|---|---|
| Southwest Missouri nonmetropolitan area | 120 | 1.68 | 6.37 | $ 21.35 | $ 44,400 |
| Northwest Colorado nonmetropolitan area | 110 | 0.96 | 3.66 | $ 19.08 | $ 39,690 |
| Southwest Colorado nonmetropolitan area | 60 | 0.57 | 2.16 | $ 29.67 | $ 61,710 |
| Hill Country Region of Texas nonmetropolitan area | 90 | 0.46 | 1.73 | $ 19.53 | $ 40,630 |
| West Montana nonmetropolitan area | 30 | 0.43 | 1.64 | $ 19.02 | $ 39,560 |
Top paying nonmetropolitan areas for Travel Agents:
| Nonmetropolitan area | Employment (1) | Employment per thousand jobs | Location quotient (9) | Hourly mean wage | Annual mean wage (2) |
|---|---|---|---|---|---|
| Southwest Colorado nonmetropolitan area | 60 | 0.57 | 2.16 | $ 29.67 | $ 61,710 |
| Southwest Montana nonmetropolitan area | 50 | 0.33 | 1.26 | $ 22.31 | $ 46,400 |
| Southwest Missouri nonmetropolitan area | 120 | 1.68 | 6.37 | $ 21.35 | $ 44,400 |
| Western Washington nonmetropolitan area | 50 | 0.40 | 1.51 | $ 19.57 | $ 40,700 |
| Hill Country Region of Texas nonmetropolitan area | 90 | 0.46 | 1.73 | $ 19.53 | $ 40,630 |
These estimates are calculated with data collected from employers in all industry sectors, all metropolitan and nonmetropolitan areas, and all states and the District of Columbia. The top employment and wage figures are provided above. The complete list is available in the downloadable XLS files.
The percentile wage estimate is the value of a wage below which a certain percent of workers fall. The median wage is the 50th percentile wage estimate—50 percent of workers earn less than the median and 50 percent of workers earn more than the median. More about percentile wages.
(1) Estimates for detailed occupations do not sum to the totals because the totals include occupations not shown separately. Estimates do not include self-employed workers.
(2) Annual wages have been calculated by multiplying the hourly mean wage by a "year-round, full-time" hours figure of 2,080 hours; for those occupations where there is not an hourly wage published, the annual wage has been directly calculated from the reported survey data.
(3) The relative standard error (RSE) is a measure of the reliability of a survey statistic. The smaller the relative standard error, the more precise the estimate.
(7) The value is less than .005 percent of industry employment.
(8) Estimate not released.
(9) The location quotient is the ratio of the area concentration of occupational employment to the national average concentration. A location quotient greater than one indicates the occupation has a higher share of employment than average, and a location quotient less than one indicates the occupation is less prevalent in the area than average.
Other OEWS estimates and related information:
May 2021 National Occupational Employment and Wage Estimates
May 2021 State Occupational Employment and Wage Estimates
May 2021 Metropolitan and Nonmetropolitan Area Occupational Employment and Wage Estimates
May 2021 National Industry-Specific Occupational Employment and Wage Estimates
Last Modified Date: March 31, 2022