
An official website of the United States government
An official website of the United States government
The .gov means it's official.
Federal government websites often end in .gov or .mil. Before sharing sensitive information,
make sure you're on a federal government site.
The site is secure.
The
https:// ensures that you are connecting to the official website and that any
information you provide is encrypted and transmitted securely.
Interview persons by telephone, mail, in person, or by other means for the purpose of completing forms, applications, or questionnaires. Ask specific questions, record answers, and assist persons with completing form. May sort, classify, and file forms.
Employment estimate and mean wage estimates for Interviewers, Except Eligibility and Loan:
| Employment (1) | Employment RSE (3) |
Mean hourly wage |
Mean annual wage (2) |
Wage RSE (3) |
|---|---|---|---|---|
| 169,840 | 1.3 % | $ 18.67 | $ 38,840 | 0.3 % |
Percentile wage estimates for Interviewers, Except Eligibility and Loan:
| Percentile | 10% | 25% | 50% (Median) |
75% | 90% |
|---|---|---|---|---|---|
| Hourly Wage | $ 13.78 | $ 14.44 | $ 17.89 | $ 22.22 | $ 24.23 |
| Annual Wage (2) | $ 28,650 | $ 30,020 | $ 37,220 | $ 46,210 | $ 50,400 |
Industries with the highest published employment and wages for Interviewers, Except Eligibility and Loan are provided. For a list of all industries with employment in Interviewers, Except Eligibility and Loan, see the Create Customized Tables function.
Industries with the highest levels of employment in Interviewers, Except Eligibility and Loan:
| Industry | Employment (1) | Percent of industry employment | Hourly mean wage | Annual mean wage (2) |
|---|---|---|---|---|
| General Medical and Surgical Hospitals | 71,790 | 1.28 | $ 18.66 | $ 38,820 |
| Offices of Physicians | 14,790 | 0.55 | $ 17.62 | $ 36,650 |
| Other Professional, Scientific, and Technical Services | 14,280 | 1.87 | $ 14.89 | $ 30,980 |
| Colleges, Universities, and Professional Schools | 7,490 | 0.25 | $ 21.03 | $ 43,740 |
| Outpatient Care Centers | 5,420 | 0.55 | $ 19.62 | $ 40,820 |
Industries with the highest concentration of employment in Interviewers, Except Eligibility and Loan:
| Industry | Employment (1) | Percent of industry employment | Hourly mean wage | Annual mean wage (2) |
|---|---|---|---|---|
| Other Professional, Scientific, and Technical Services | 14,280 | 1.87 | $ 14.89 | $ 30,980 |
| General Medical and Surgical Hospitals | 71,790 | 1.28 | $ 18.66 | $ 38,820 |
| Specialty (except Psychiatric and Substance Abuse) Hospitals | 2,420 | 0.90 | $ 22.67 | $ 47,160 |
| Office Administrative Services | 4,270 | 0.88 | $ 17.65 | $ 36,710 |
| Technical and Trade Schools | 1,100 | 0.84 | $ 22.90 | $ 47,630 |
Top paying industries for Interviewers, Except Eligibility and Loan:
| Industry | Employment (1) | Percent of industry employment | Hourly mean wage | Annual mean wage (2) |
|---|---|---|---|---|
| Educational Support Services | 610 | 0.31 | $ 23.61 | $ 49,110 |
| Computer Systems Design and Related Services | 370 | 0.02 | $ 23.14 | $ 48,140 |
| Nursing Care Facilities (Skilled Nursing Facilities) | 2,180 | 0.15 | $ 23.10 | $ 48,040 |
| Other Personal Services | (8) | (8) | $ 23.05 | $ 47,940 |
| Technical and Trade Schools | 1,100 | 0.84 | $ 22.90 | $ 47,630 |
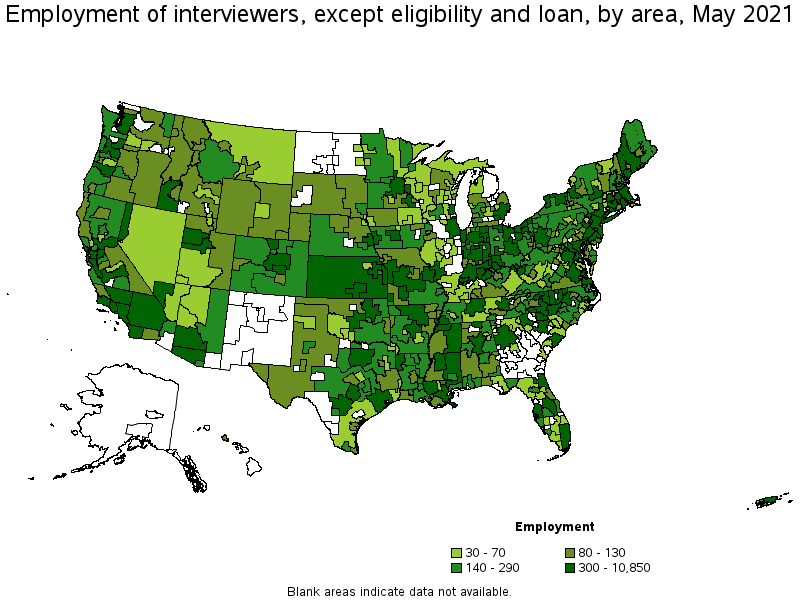
States and areas with the highest published employment, location quotients, and wages for Interviewers, Except Eligibility and Loan are provided. For a list of all areas with employment in Interviewers, Except Eligibility and Loan, see the Create Customized Tables function.
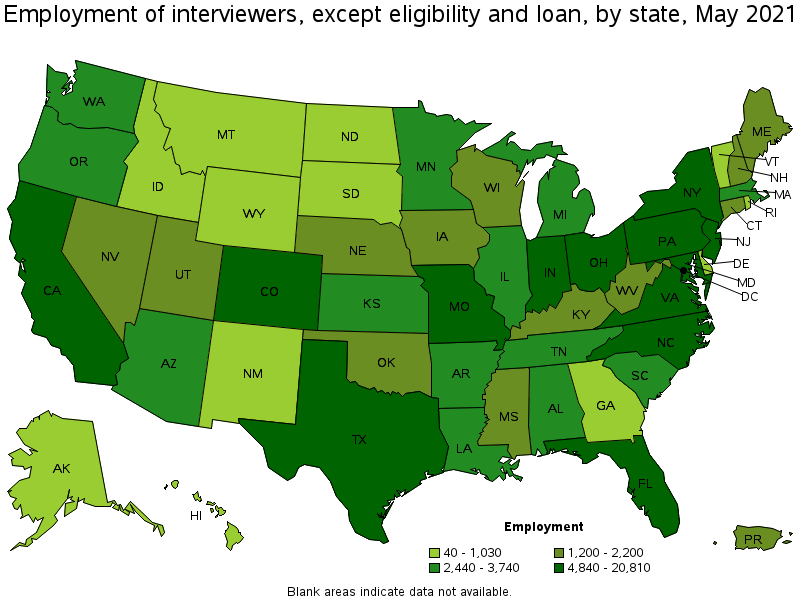
States with the highest employment level in Interviewers, Except Eligibility and Loan:
| State | Employment (1) | Employment per thousand jobs | Location quotient (9) | Hourly mean wage | Annual mean wage (2) |
|---|---|---|---|---|---|
| California | 20,810 | 1.26 | 1.04 | $ 22.36 | $ 46,510 |
| Texas | 12,240 | 1.00 | 0.83 | $ 17.83 | $ 37,080 |
| New York | 11,500 | 1.33 | 1.10 | $ 21.32 | $ 44,340 |
| Ohio | 7,520 | 1.45 | 1.20 | $ 17.47 | $ 36,340 |
| Indiana | 7,030 | 2.36 | 1.96 | $ 18.60 | $ 38,690 |
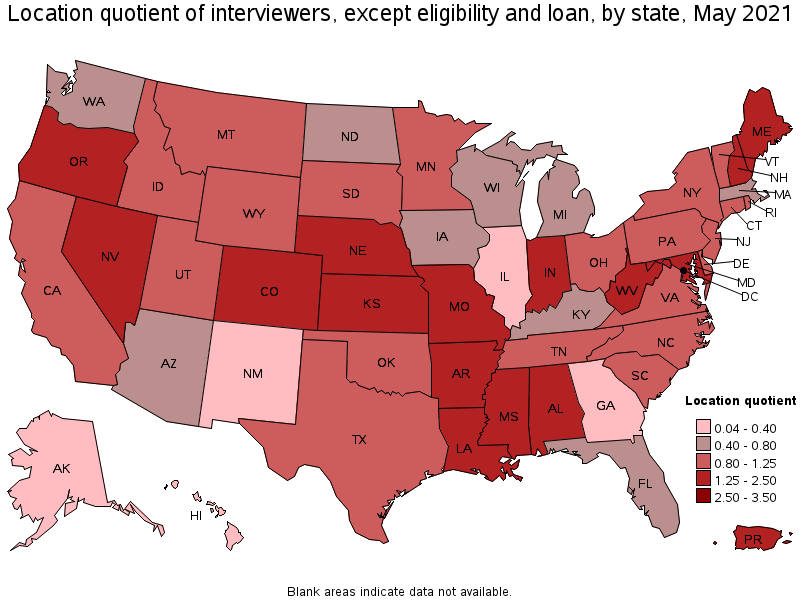
States with the highest concentration of jobs and location quotients in Interviewers, Except Eligibility and Loan:
| State | Employment (1) | Employment per thousand jobs | Location quotient (9) | Hourly mean wage | Annual mean wage (2) |
|---|---|---|---|---|---|
| Kansas | 3,600 | 2.69 | 2.23 | $ 16.92 | $ 35,190 |
| Indiana | 7,030 | 2.36 | 1.96 | $ 18.60 | $ 38,690 |
| Colorado | 6,080 | 2.32 | 1.92 | $ 19.87 | $ 41,330 |
| Arkansas | 2,610 | 2.19 | 1.82 | $ 15.62 | $ 32,480 |
| Missouri | 5,910 | 2.16 | 1.80 | $ 16.72 | $ 34,780 |
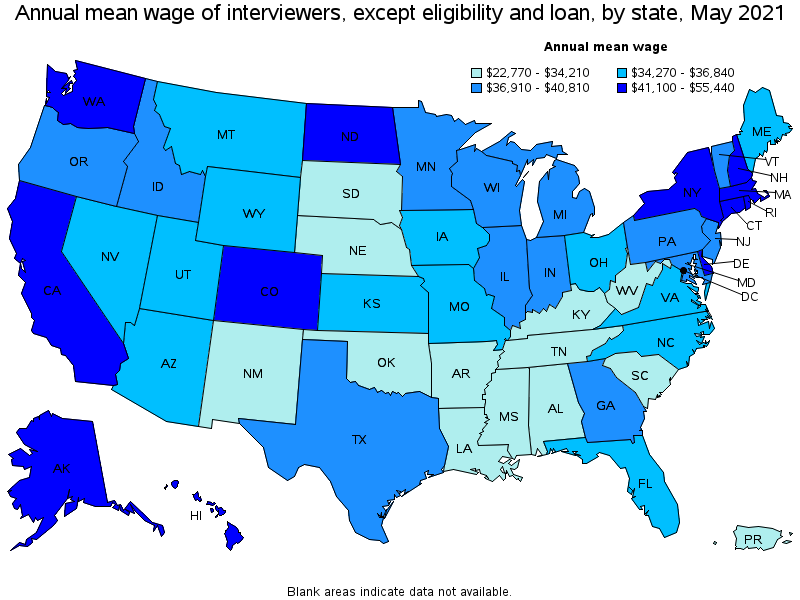
Top paying states for Interviewers, Except Eligibility and Loan:
| State | Employment (1) | Employment per thousand jobs | Location quotient (9) | Hourly mean wage | Annual mean wage (2) |
|---|---|---|---|---|---|
| District of Columbia | 520 | 0.78 | 0.65 | $ 26.65 | $ 55,440 |
| Massachusetts | 3,220 | 0.95 | 0.79 | $ 23.66 | $ 49,210 |
| California | 20,810 | 1.26 | 1.04 | $ 22.36 | $ 46,510 |
| Connecticut | 1,600 | 1.02 | 0.85 | $ 21.46 | $ 44,630 |
| Delaware | 460 | 1.05 | 0.87 | $ 21.41 | $ 44,530 |
Metropolitan areas with the highest employment level in Interviewers, Except Eligibility and Loan:
| Metropolitan area | Employment (1) | Employment per thousand jobs | Location quotient (9) | Hourly mean wage | Annual mean wage (2) |
|---|---|---|---|---|---|
| New York-Newark-Jersey City, NY-NJ-PA | 10,850 | 1.25 | 1.04 | $ 21.77 | $ 45,290 |
| Los Angeles-Long Beach-Anaheim, CA | 8,000 | 1.40 | 1.16 | $ 21.25 | $ 44,200 |
| Washington-Arlington-Alexandria, DC-VA-MD-WV | 3,670 | 1.25 | 1.04 | $ 21.47 | $ 44,650 |
| Dallas-Fort Worth-Arlington, TX | 3,430 | 0.96 | 0.79 | $ 18.56 | $ 38,610 |
| Baltimore-Columbia-Towson, MD | 3,230 | 2.58 | 2.14 | $ 19.00 | $ 39,530 |
| Philadelphia-Camden-Wilmington, PA-NJ-DE-MD | 3,200 | 1.20 | 1.00 | $ 19.95 | $ 41,500 |
| Houston-The Woodlands-Sugar Land, TX | 3,090 | 1.07 | 0.89 | $ 18.56 | $ 38,610 |
| Indianapolis-Carmel-Anderson, IN | 2,920 | 2.90 | 2.40 | $ 19.53 | $ 40,620 |
| Denver-Aurora-Lakewood, CO | 2,920 | 1.99 | 1.65 | $ 20.66 | $ 42,970 |
| San Francisco-Oakland-Hayward, CA | 2,860 | 1.27 | 1.06 | $ 25.92 | $ 53,920 |
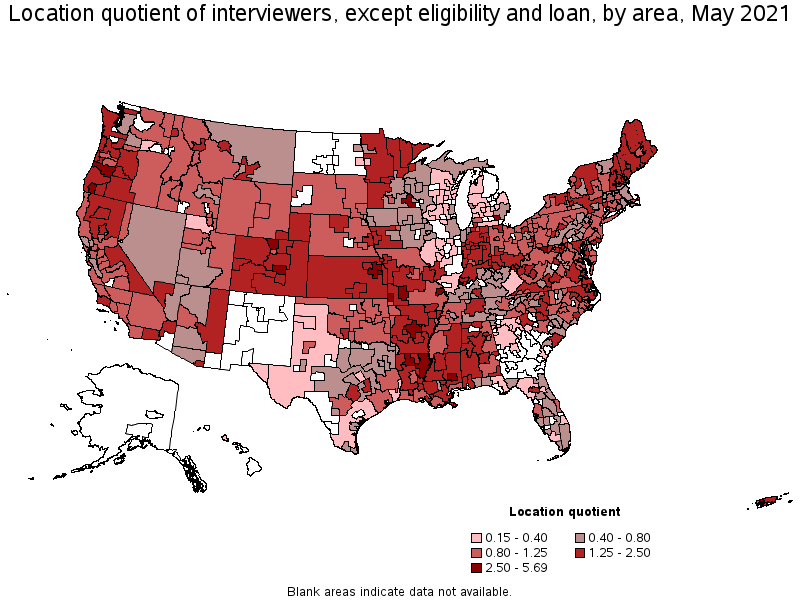
Metropolitan areas with the highest concentration of jobs and location quotients in Interviewers, Except Eligibility and Loan:
| Metropolitan area | Employment (1) | Employment per thousand jobs | Location quotient (9) | Hourly mean wage | Annual mean wage (2) |
|---|---|---|---|---|---|
| Rochester, MN | 800 | 6.86 | 5.69 | $ 19.56 | $ 40,680 |
| Topeka, KS | 460 | 4.34 | 3.60 | $ 16.68 | $ 34,690 |
| Joplin, MO | 330 | 4.31 | 3.57 | $ 15.18 | $ 31,570 |
| Colorado Springs, CO | 1,200 | 4.16 | 3.45 | $ 18.92 | $ 39,360 |
| Lawrence, KS | 190 | 4.15 | 3.44 | $ 16.36 | $ 34,030 |
| Morgantown, WV | 250 | 4.00 | 3.31 | $ 15.54 | $ 32,310 |
| Eugene, OR | 590 | 3.96 | 3.29 | $ 17.36 | $ 36,110 |
| Cape Girardeau, MO-IL | 160 | 3.70 | 3.07 | $ 15.15 | $ 31,510 |
| Little Rock-North Little Rock-Conway, AR | 1,190 | 3.66 | 3.04 | $ 16.75 | $ 34,830 |
| Fort Collins, CO | 540 | 3.37 | 2.79 | $ 19.91 | $ 41,410 |
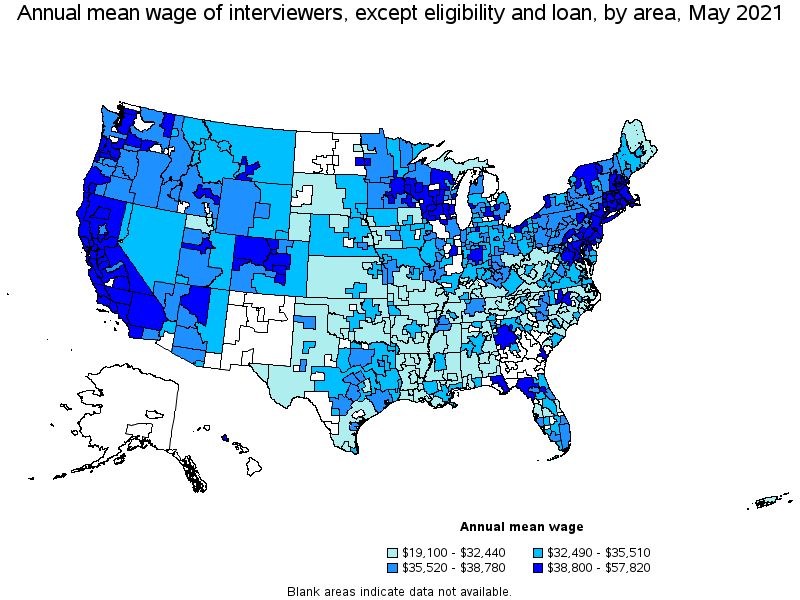
Top paying metropolitan areas for Interviewers, Except Eligibility and Loan:
| Metropolitan area | Employment (1) | Employment per thousand jobs | Location quotient (9) | Hourly mean wage | Annual mean wage (2) |
|---|---|---|---|---|---|
| San Jose-Sunnyvale-Santa Clara, CA | 920 | 0.86 | 0.72 | $ 27.80 | $ 57,820 |
| San Francisco-Oakland-Hayward, CA | 2,860 | 1.27 | 1.06 | $ 25.92 | $ 53,920 |
| Salinas, CA | 180 | 1.07 | 0.89 | $ 25.47 | $ 52,980 |
| Santa Rosa, CA | 180 | 0.94 | 0.78 | $ 24.69 | $ 51,360 |
| Napa, CA | 60 | 0.92 | 0.76 | $ 24.57 | $ 51,100 |
| Boston-Cambridge-Nashua, MA-NH | 2,410 | 0.93 | 0.77 | $ 24.42 | $ 50,800 |
| Barnstable Town, MA | 100 | 1.05 | 0.87 | $ 24.25 | $ 50,440 |
| Vallejo-Fairfield, CA | 140 | 1.04 | 0.87 | $ 23.88 | $ 49,670 |
| Norwich-New London-Westerly, CT-RI | 120 | 1.05 | 0.87 | $ 23.85 | $ 49,610 |
| Sacramento--Roseville--Arden-Arcade, CA | 1,140 | 1.16 | 0.96 | $ 23.79 | $ 49,490 |
Nonmetropolitan areas with the highest employment in Interviewers, Except Eligibility and Loan:
| Nonmetropolitan area | Employment (1) | Employment per thousand jobs | Location quotient (9) | Hourly mean wage | Annual mean wage (2) |
|---|---|---|---|---|---|
| Kansas nonmetropolitan area | 850 | 2.26 | 1.87 | $ 15.11 | $ 31,430 |
| Northeast Mississippi nonmetropolitan area | 530 | 2.40 | 1.99 | $ 14.34 | $ 29,830 |
| North Northeastern Ohio nonmetropolitan area (noncontiguous) | 440 | 1.39 | 1.15 | $ 16.45 | $ 34,220 |
| Southwest Maine nonmetropolitan area | 420 | 2.30 | 1.91 | $ 15.96 | $ 33,200 |
| Central Missouri nonmetropolitan area | 380 | 2.49 | 2.06 | $ 14.66 | $ 30,480 |
Nonmetropolitan areas with the highest concentration of jobs and location quotients in Interviewers, Except Eligibility and Loan:
| Nonmetropolitan area | Employment (1) | Employment per thousand jobs | Location quotient (9) | Hourly mean wage | Annual mean wage (2) |
|---|---|---|---|---|---|
| Northeast Louisiana nonmetropolitan area | 200 | 3.25 | 2.69 | $ 13.67 | $ 28,440 |
| Eastern and Southern Colorado nonmetropolitan area | 200 | 2.96 | 2.45 | $ 16.13 | $ 33,550 |
| North Arkansas nonmetropolitan area | 320 | 2.85 | 2.37 | $ 13.68 | $ 28,450 |
| Northwest Nebraska nonmetropolitan area | 100 | 2.67 | 2.22 | $ 15.44 | $ 32,120 |
| Central Missouri nonmetropolitan area | 380 | 2.49 | 2.06 | $ 14.66 | $ 30,480 |
Top paying nonmetropolitan areas for Interviewers, Except Eligibility and Loan:
| Nonmetropolitan area | Employment (1) | Employment per thousand jobs | Location quotient (9) | Hourly mean wage | Annual mean wage (2) |
|---|---|---|---|---|---|
| North Valley-Northern Mountains Region of California nonmetropolitan area | 200 | 2.04 | 1.69 | $ 23.67 | $ 49,230 |
| North Coast Region of California nonmetropolitan area | 120 | 1.21 | 1.00 | $ 22.19 | $ 46,160 |
| Massachusetts nonmetropolitan area | 50 | 0.89 | 0.74 | $ 21.91 | $ 45,580 |
| Connecticut nonmetropolitan area | 70 | 2.07 | 1.72 | $ 21.57 | $ 44,860 |
| Eastern Sierra-Mother Lode Region of California nonmetropolitan area | 110 | 1.95 | 1.61 | $ 21.13 | $ 43,960 |
These estimates are calculated with data collected from employers in all industry sectors, all metropolitan and nonmetropolitan areas, and all states and the District of Columbia. The top employment and wage figures are provided above. The complete list is available in the downloadable XLS files.
The percentile wage estimate is the value of a wage below which a certain percent of workers fall. The median wage is the 50th percentile wage estimate—50 percent of workers earn less than the median and 50 percent of workers earn more than the median. More about percentile wages.
(1) Estimates for detailed occupations do not sum to the totals because the totals include occupations not shown separately. Estimates do not include self-employed workers.
(2) Annual wages have been calculated by multiplying the hourly mean wage by a "year-round, full-time" hours figure of 2,080 hours; for those occupations where there is not an hourly wage published, the annual wage has been directly calculated from the reported survey data.
(3) The relative standard error (RSE) is a measure of the reliability of a survey statistic. The smaller the relative standard error, the more precise the estimate.
(8) Estimate not released.
(9) The location quotient is the ratio of the area concentration of occupational employment to the national average concentration. A location quotient greater than one indicates the occupation has a higher share of employment than average, and a location quotient less than one indicates the occupation is less prevalent in the area than average.
Other OEWS estimates and related information:
May 2021 National Occupational Employment and Wage Estimates
May 2021 State Occupational Employment and Wage Estimates
May 2021 Metropolitan and Nonmetropolitan Area Occupational Employment and Wage Estimates
May 2021 National Industry-Specific Occupational Employment and Wage Estimates
Last Modified Date: March 31, 2022