
An official website of the United States government
An official website of the United States government
The .gov means it's official.
Federal government websites often end in .gov or .mil. Before sharing sensitive information,
make sure you're on a federal government site.
The site is secure.
The
https:// ensures that you are connecting to the official website and that any
information you provide is encrypted and transmitted securely.
Expedite and route movement of incoming and outgoing cargo and freight shipments in airline, train, and trucking terminals and shipping docks. Take orders from customers and arrange pickup of freight and cargo for delivery to loading platform. Prepare and examine bills of lading to determine shipping charges and tariffs.
Employment estimate and mean wage estimates for Cargo and Freight Agents:
| Employment (1) | Employment RSE (3) |
Mean hourly wage |
Mean annual wage (2) |
Wage RSE (3) |
|---|---|---|---|---|
| 85,750 | 2.2 % | $ 23.28 | $ 48,420 | 1.1 % |
Percentile wage estimates for Cargo and Freight Agents:
| Percentile | 10% | 25% | 50% (Median) |
75% | 90% |
|---|---|---|---|---|---|
| Hourly Wage | $ 14.43 | $ 17.80 | $ 22.55 | $ 28.55 | $ 33.39 |
| Annual Wage (2) | $ 30,020 | $ 37,020 | $ 46,910 | $ 59,380 | $ 69,450 |
Industries with the highest published employment and wages for Cargo and Freight Agents are provided. For a list of all industries with employment in Cargo and Freight Agents, see the Create Customized Tables function.
Industries with the highest levels of employment in Cargo and Freight Agents:
| Industry | Employment (1) | Percent of industry employment | Hourly mean wage | Annual mean wage (2) |
|---|---|---|---|---|
| Freight Transportation Arrangement | 52,450 | 22.52 | $ 23.80 | $ 49,490 |
| Couriers and Express Delivery Services | 7,570 | 0.82 | $ 23.08 | $ 48,000 |
| Scheduled Air Transportation | 7,080 | 1.81 | $ 22.58 | $ 46,970 |
| Support Activities for Air Transportation | 5,130 | 2.63 | $ 17.15 | $ 35,660 |
| Truck Transportation | 3,600 | 0.24 | $ 26.52 | $ 55,170 |
Industries with the highest concentration of employment in Cargo and Freight Agents:
| Industry | Employment (1) | Percent of industry employment | Hourly mean wage | Annual mean wage (2) |
|---|---|---|---|---|
| Freight Transportation Arrangement | 52,450 | 22.52 | $ 23.80 | $ 49,490 |
| Support Activities for Air Transportation | 5,130 | 2.63 | $ 17.15 | $ 35,660 |
| Deep Sea, Coastal, and Great Lakes Water Transportation | 830 | 2.57 | $ 28.01 | $ 58,260 |
| Nonscheduled Air Transportation | 960 | 1.97 | $ 17.31 | $ 36,000 |
| Scheduled Air Transportation | 7,080 | 1.81 | $ 22.58 | $ 46,970 |
Top paying industries for Cargo and Freight Agents:
| Industry | Employment (1) | Percent of industry employment | Hourly mean wage | Annual mean wage (2) |
|---|---|---|---|---|
| Federal Executive Branch (OEWS Designation) | 270 | 0.01 | $ 28.65 | $ 59,590 |
| Support Activities for Water Transportation | 800 | 0.89 | $ 28.10 | $ 58,450 |
| Other Support Activities for Transportation | 80 | 0.24 | $ 28.03 | $ 58,310 |
| Deep Sea, Coastal, and Great Lakes Water Transportation | 830 | 2.57 | $ 28.01 | $ 58,260 |
| Wholesale Electronic Markets and Agents and Brokers | (8) | (8) | $ 27.12 | $ 56,410 |
States and areas with the highest published employment, location quotients, and wages for Cargo and Freight Agents are provided. For a list of all areas with employment in Cargo and Freight Agents, see the Create Customized Tables function.
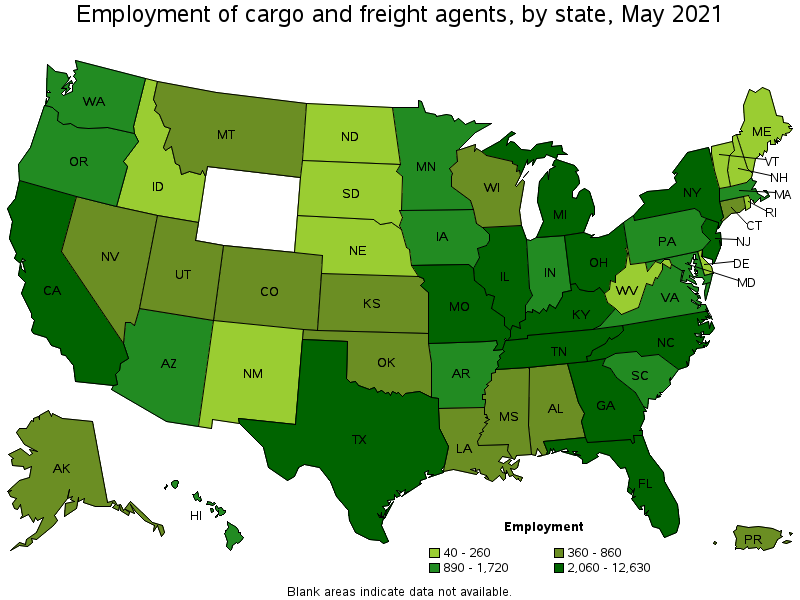
States with the highest employment level in Cargo and Freight Agents:
| State | Employment (1) | Employment per thousand jobs | Location quotient (9) | Hourly mean wage | Annual mean wage (2) |
|---|---|---|---|---|---|
| California | 12,630 | 0.76 | 1.26 | $ 24.69 | $ 51,350 |
| Florida | 9,000 | 1.05 | 1.72 | $ 22.67 | $ 47,150 |
| Texas | 8,600 | 0.70 | 1.16 | $ 22.14 | $ 46,060 |
| Illinois | 7,550 | 1.34 | 2.21 | $ 23.99 | $ 49,900 |
| New York | 5,790 | 0.67 | 1.10 | $ 25.87 | $ 53,810 |
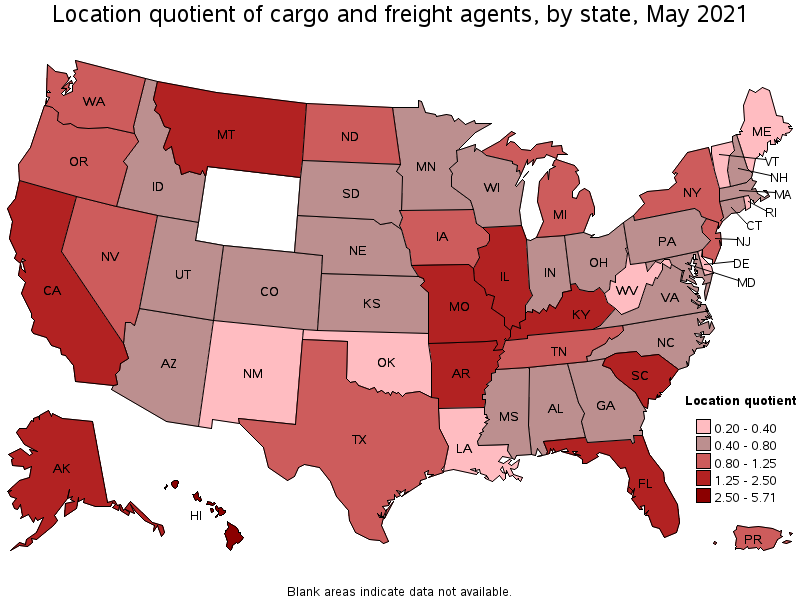
States with the highest concentration of jobs and location quotients in Cargo and Freight Agents:
| State | Employment (1) | Employment per thousand jobs | Location quotient (9) | Hourly mean wage | Annual mean wage (2) |
|---|---|---|---|---|---|
| Hawaii | 980 | 1.79 | 2.94 | $ 18.29 | $ 38,040 |
| Kentucky | 2,530 | 1.38 | 2.26 | $ 22.56 | $ 46,920 |
| Illinois | 7,550 | 1.34 | 2.21 | $ 23.99 | $ 49,900 |
| Alaska | 370 | 1.26 | 2.07 | $ 25.96 | $ 54,000 |
| Florida | 9,000 | 1.05 | 1.72 | $ 22.67 | $ 47,150 |
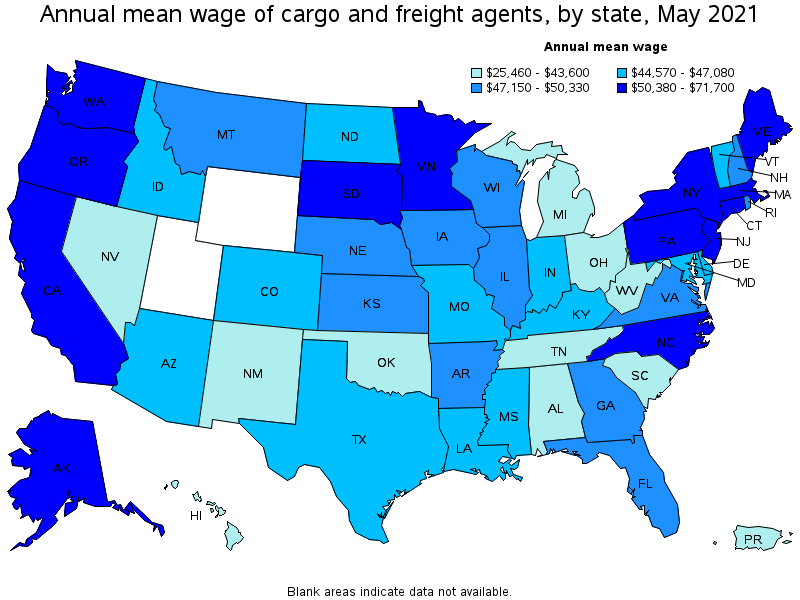
Top paying states for Cargo and Freight Agents:
| State | Employment (1) | Employment per thousand jobs | Location quotient (9) | Hourly mean wage | Annual mean wage (2) |
|---|---|---|---|---|---|
| Connecticut | 590 | 0.38 | 0.62 | $ 34.47 | $ 71,700 |
| Maine | 130 | 0.23 | 0.37 | $ 27.66 | $ 57,540 |
| South Dakota | 200 | 0.48 | 0.79 | $ 27.04 | $ 56,240 |
| Oregon | 1,030 | 0.57 | 0.93 | $ 26.66 | $ 55,450 |
| Massachusetts | 890 | 0.26 | 0.43 | $ 26.44 | $ 55,000 |
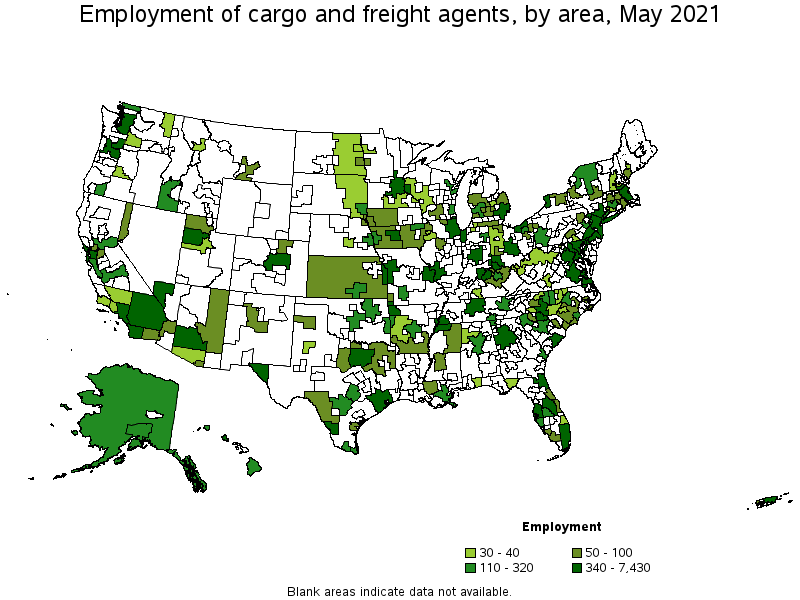
Metropolitan areas with the highest employment level in Cargo and Freight Agents:
| Metropolitan area | Employment (1) | Employment per thousand jobs | Location quotient (9) | Hourly mean wage | Annual mean wage (2) |
|---|---|---|---|---|---|
| Los Angeles-Long Beach-Anaheim, CA | 7,430 | 1.30 | 2.13 | $ 25.33 | $ 52,680 |
| Chicago-Naperville-Elgin, IL-IN-WI | 7,200 | 1.70 | 2.80 | $ 23.96 | $ 49,840 |
| New York-Newark-Jersey City, NY-NJ-PA | 6,340 | 0.73 | 1.20 | $ 26.92 | $ 55,990 |
| Miami-Fort Lauderdale-West Palm Beach, FL | 4,940 | 2.02 | 3.31 | $ 22.63 | $ 47,060 |
| Dallas-Fort Worth-Arlington, TX | 3,100 | 0.86 | 1.42 | $ 22.36 | $ 46,500 |
| Houston-The Woodlands-Sugar Land, TX | 2,800 | 0.97 | 1.59 | $ 24.52 | $ 51,010 |
| Cincinnati, OH-KY-IN | 1,980 | 1.94 | 3.18 | $ 21.96 | $ 45,680 |
| San Francisco-Oakland-Hayward, CA | 1,760 | 0.79 | 1.29 | $ 26.77 | $ 55,690 |
| Detroit-Warren-Dearborn, MI | 1,670 | 0.93 | 1.53 | $ 21.40 | $ 44,520 |
| Atlanta-Sandy Springs-Roswell, GA | 1,670 | 0.65 | 1.06 | $ 23.91 | $ 49,720 |
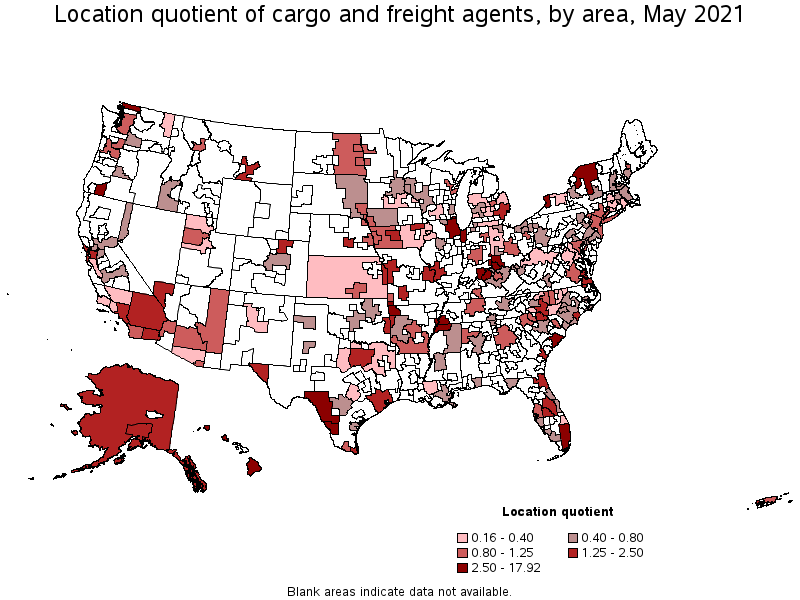
Metropolitan areas with the highest concentration of jobs and location quotients in Cargo and Freight Agents:
| Metropolitan area | Employment (1) | Employment per thousand jobs | Location quotient (9) | Hourly mean wage | Annual mean wage (2) |
|---|---|---|---|---|---|
| Laredo, TX | 1,060 | 10.91 | 17.92 | $ 15.90 | $ 33,070 |
| Bellingham, WA | 180 | 2.17 | 3.57 | $ 21.64 | $ 45,020 |
| Buffalo-Cheektowaga-Niagara Falls, NY | 1,050 | 2.11 | 3.47 | $ 19.75 | $ 41,090 |
| Miami-Fort Lauderdale-West Palm Beach, FL | 4,940 | 2.02 | 3.31 | $ 22.63 | $ 47,060 |
| Cincinnati, OH-KY-IN | 1,980 | 1.94 | 3.18 | $ 21.96 | $ 45,680 |
| Memphis, TN-MS-AR | 1,140 | 1.89 | 3.11 | $ 20.48 | $ 42,590 |
| Medford, OR | 160 | 1.88 | 3.08 | $ 26.79 | $ 55,730 |
| Charleston-North Charleston, SC | 630 | 1.85 | 3.03 | $ 22.54 | $ 46,880 |
| Louisville/Jefferson County, KY-IN | 1,140 | 1.82 | 2.99 | $ 21.22 | $ 44,130 |
| Chicago-Naperville-Elgin, IL-IN-WI | 7,200 | 1.70 | 2.80 | $ 23.96 | $ 49,840 |
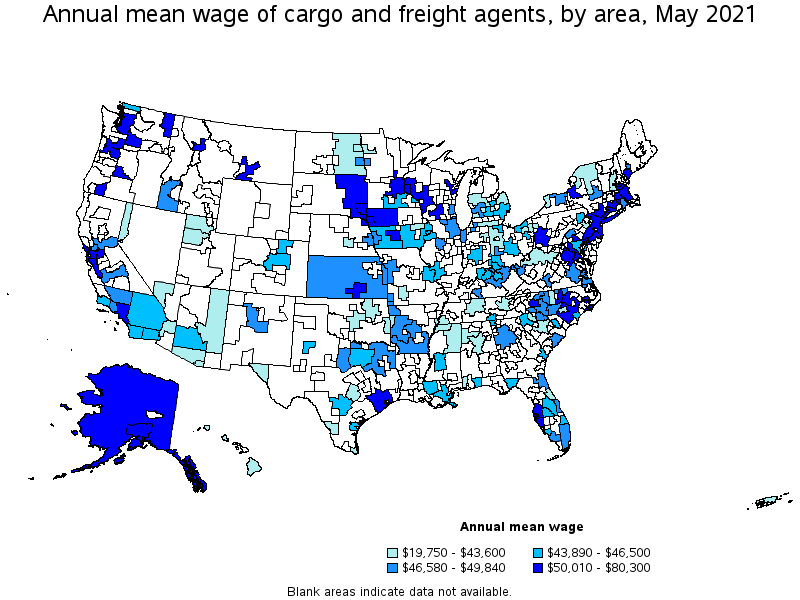
Top paying metropolitan areas for Cargo and Freight Agents:
| Metropolitan area | Employment (1) | Employment per thousand jobs | Location quotient (9) | Hourly mean wage | Annual mean wage (2) |
|---|---|---|---|---|---|
| Bridgeport-Stamford-Norwalk, CT | 270 | 0.73 | 1.20 | $ 38.61 | $ 80,300 |
| Yakima, WA | 40 | 0.47 | 0.78 | $ 32.71 | $ 68,030 |
| Hartford-West Hartford-East Hartford, CT | 120 | 0.22 | 0.36 | $ 30.78 | $ 64,030 |
| Waterbury, CT | 40 | 0.68 | 1.11 | $ 30.03 | $ 62,460 |
| Portland-South Portland, ME | 50 | 0.27 | 0.44 | $ 29.98 | $ 62,360 |
| Raleigh, NC | 240 | 0.38 | 0.62 | $ 29.04 | $ 60,400 |
| New Haven, CT | 40 | 0.15 | 0.24 | $ 28.83 | $ 59,970 |
| Worcester, MA-CT | 70 | 0.26 | 0.43 | $ 28.76 | $ 59,810 |
| New York-Newark-Jersey City, NY-NJ-PA | 6,340 | 0.73 | 1.20 | $ 26.92 | $ 55,990 |
| Durham-Chapel Hill, NC | 30 | 0.10 | 0.17 | $ 26.87 | $ 55,890 |
Nonmetropolitan areas with the highest employment in Cargo and Freight Agents:
| Nonmetropolitan area | Employment (1) | Employment per thousand jobs | Location quotient (9) | Hourly mean wage | Annual mean wage (2) |
|---|---|---|---|---|---|
| Capital/Northern New York nonmetropolitan area | 220 | 1.61 | 2.64 | $ 19.83 | $ 41,240 |
| Hawaii / Kauai nonmetropolitan area | 170 | 1.88 | 3.09 | $ 18.74 | $ 38,980 |
| Alaska nonmetropolitan area | 120 | 1.19 | 1.95 | $ 27.18 | $ 56,540 |
| Northeast Mississippi nonmetropolitan area | 100 | 0.47 | 0.78 | $ 17.99 | $ 37,430 |
| Border Region of Texas nonmetropolitan area | 90 | 1.54 | 2.52 | (8) | (8) |
Nonmetropolitan areas with the highest concentration of jobs and location quotients in Cargo and Freight Agents:
| Nonmetropolitan area | Employment (1) | Employment per thousand jobs | Location quotient (9) | Hourly mean wage | Annual mean wage (2) |
|---|---|---|---|---|---|
| Hawaii / Kauai nonmetropolitan area | 170 | 1.88 | 3.09 | $ 18.74 | $ 38,980 |
| Capital/Northern New York nonmetropolitan area | 220 | 1.61 | 2.64 | $ 19.83 | $ 41,240 |
| Border Region of Texas nonmetropolitan area | 90 | 1.54 | 2.52 | (8) | (8) |
| Alaska nonmetropolitan area | 120 | 1.19 | 1.95 | $ 27.18 | $ 56,540 |
| East North Dakota nonmetropolitan area | 40 | 0.69 | 1.13 | $ 20.59 | $ 42,830 |
Top paying nonmetropolitan areas for Cargo and Freight Agents:
| Nonmetropolitan area | Employment (1) | Employment per thousand jobs | Location quotient (9) | Hourly mean wage | Annual mean wage (2) |
|---|---|---|---|---|---|
| Southeast Coastal North Carolina nonmetropolitan area | 60 | 0.24 | 0.40 | $ 29.78 | $ 61,950 |
| Alaska nonmetropolitan area | 120 | 1.19 | 1.95 | $ 27.18 | $ 56,540 |
| East South Dakota nonmetropolitan area | 30 | 0.25 | 0.41 | $ 26.81 | $ 55,770 |
| Western Wisconsin nonmetropolitan area | 30 | 0.24 | 0.40 | $ 25.15 | $ 52,310 |
| Northwest Iowa nonmetropolitan area | 50 | 0.37 | 0.61 | $ 24.96 | $ 51,910 |
These estimates are calculated with data collected from employers in all industry sectors, all metropolitan and nonmetropolitan areas, and all states and the District of Columbia. The top employment and wage figures are provided above. The complete list is available in the downloadable XLS files.
The percentile wage estimate is the value of a wage below which a certain percent of workers fall. The median wage is the 50th percentile wage estimate—50 percent of workers earn less than the median and 50 percent of workers earn more than the median. More about percentile wages.
(1) Estimates for detailed occupations do not sum to the totals because the totals include occupations not shown separately. Estimates do not include self-employed workers.
(2) Annual wages have been calculated by multiplying the hourly mean wage by a "year-round, full-time" hours figure of 2,080 hours; for those occupations where there is not an hourly wage published, the annual wage has been directly calculated from the reported survey data.
(3) The relative standard error (RSE) is a measure of the reliability of a survey statistic. The smaller the relative standard error, the more precise the estimate.
(8) Estimate not released.
(9) The location quotient is the ratio of the area concentration of occupational employment to the national average concentration. A location quotient greater than one indicates the occupation has a higher share of employment than average, and a location quotient less than one indicates the occupation is less prevalent in the area than average.
Other OEWS estimates and related information:
May 2021 National Occupational Employment and Wage Estimates
May 2021 State Occupational Employment and Wage Estimates
May 2021 Metropolitan and Nonmetropolitan Area Occupational Employment and Wage Estimates
May 2021 National Industry-Specific Occupational Employment and Wage Estimates
Last Modified Date: March 31, 2022