
An official website of the United States government
An official website of the United States government
The .gov means it's official.
Federal government websites often end in .gov or .mil. Before sharing sensitive information,
make sure you're on a federal government site.
The site is secure.
The
https:// ensures that you are connecting to the official website and that any
information you provide is encrypted and transmitted securely.
Coordinate and expedite the flow of work and materials within or between departments of an establishment according to production schedule. Duties include reviewing and distributing production, work, and shipment schedules; conferring with department supervisors to determine progress of work and completion dates; and compiling reports on progress of work, inventory levels, costs, and production problems. Excludes �Project Management Specialists� (13-1082) and �Weighers, Measurers, Checkers, and Samplers, Recordkeeping� (43-5111).
Employment estimate and mean wage estimates for Production, Planning, and Expediting Clerks:
| Employment (1) | Employment RSE (3) |
Mean hourly wage |
Mean annual wage (2) |
Wage RSE (3) |
|---|---|---|---|---|
| 367,200 | 0.8 % | $ 25.11 | $ 52,220 | 0.3 % |
Percentile wage estimates for Production, Planning, and Expediting Clerks:
| Percentile | 10% | 25% | 50% (Median) |
75% | 90% |
|---|---|---|---|---|---|
| Hourly Wage | $ 15.17 | $ 18.30 | $ 23.10 | $ 29.25 | $ 36.75 |
| Annual Wage (2) | $ 31,550 | $ 38,060 | $ 48,040 | $ 60,840 | $ 76,440 |
Industries with the highest published employment and wages for Production, Planning, and Expediting Clerks are provided. For a list of all industries with employment in Production, Planning, and Expediting Clerks, see the Create Customized Tables function.
Industries with the highest levels of employment in Production, Planning, and Expediting Clerks:
| Industry | Employment (1) | Percent of industry employment | Hourly mean wage | Annual mean wage (2) |
|---|---|---|---|---|
| Management of Companies and Enterprises | 15,390 | 0.61 | $ 28.19 | $ 58,630 |
| Employment Services | 14,000 | 0.40 | $ 21.83 | $ 45,410 |
| Warehousing and Storage | 13,850 | 0.84 | $ 21.22 | $ 44,140 |
| General Medical and Surgical Hospitals | 8,430 | 0.15 | $ 21.36 | $ 44,440 |
| Machinery Manufacturing (3331, 3332, 3334, and 3339 only) | 8,100 | 1.16 | $ 25.96 | $ 54,000 |
Industries with the highest concentration of employment in Production, Planning, and Expediting Clerks:
| Industry | Employment (1) | Percent of industry employment | Hourly mean wage | Annual mean wage (2) |
|---|---|---|---|---|
| Apparel, Piece Goods, and Notions Merchant Wholesalers | 2,710 | 2.09 | $ 24.15 | $ 50,240 |
| Railroad Rolling Stock Manufacturing | 350 | 1.77 | $ 26.00 | $ 54,070 |
| Other Transportation Equipment Manufacturing | 630 | 1.73 | $ 27.12 | $ 56,410 |
| Motion Picture and Video Industries | 5,060 | 1.60 | $ 24.26 | $ 50,460 |
| Navigational, Measuring, Electromedical, and Control Instruments Manufacturing | 5,990 | 1.50 | $ 28.76 | $ 59,810 |
Top paying industries for Production, Planning, and Expediting Clerks:
| Industry | Employment (1) | Percent of industry employment | Hourly mean wage | Annual mean wage (2) |
|---|---|---|---|---|
| Oil and Gas Extraction | 570 | 0.54 | $ 42.22 | $ 87,820 |
| Petroleum and Coal Products Manufacturing | 1,040 | 1.01 | $ 40.43 | $ 84,090 |
| Electric Power Generation, Transmission and Distribution | 3,030 | 0.80 | $ 39.56 | $ 82,280 |
| Other Pipeline Transportation | 80 | 1.02 | $ 35.64 | $ 74,140 |
| Support Activities for Water Transportation | 430 | 0.48 | $ 34.98 | $ 72,750 |
States and areas with the highest published employment, location quotients, and wages for Production, Planning, and Expediting Clerks are provided. For a list of all areas with employment in Production, Planning, and Expediting Clerks, see the Create Customized Tables function.
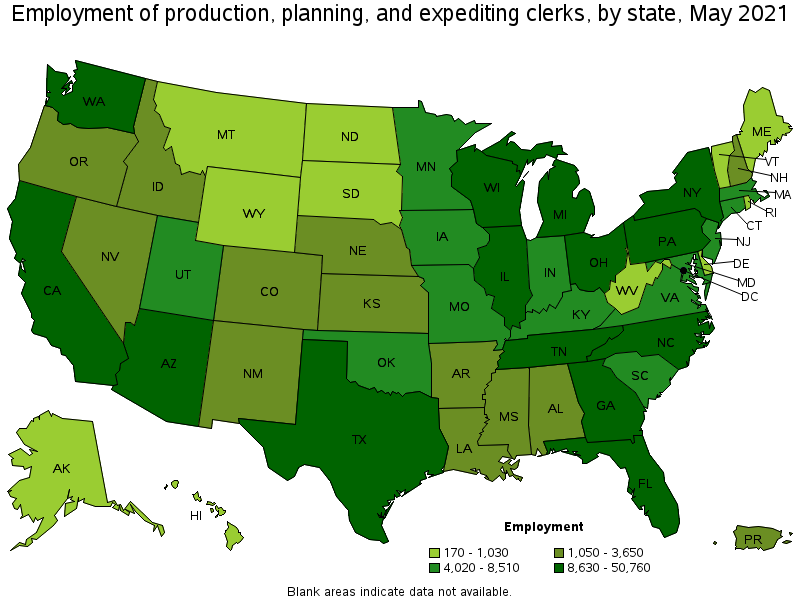
States with the highest employment level in Production, Planning, and Expediting Clerks:
| State | Employment (1) | Employment per thousand jobs | Location quotient (9) | Hourly mean wage | Annual mean wage (2) |
|---|---|---|---|---|---|
| California | 50,760 | 3.07 | 1.18 | $ 26.34 | $ 54,790 |
| New York | 50,300 | 5.80 | 2.23 | $ 26.47 | $ 55,050 |
| Texas | 31,630 | 2.59 | 0.99 | $ 24.38 | $ 50,710 |
| Ohio | 16,670 | 3.21 | 1.23 | $ 24.67 | $ 51,320 |
| Georgia | 15,310 | 3.50 | 1.34 | $ 23.50 | $ 48,890 |
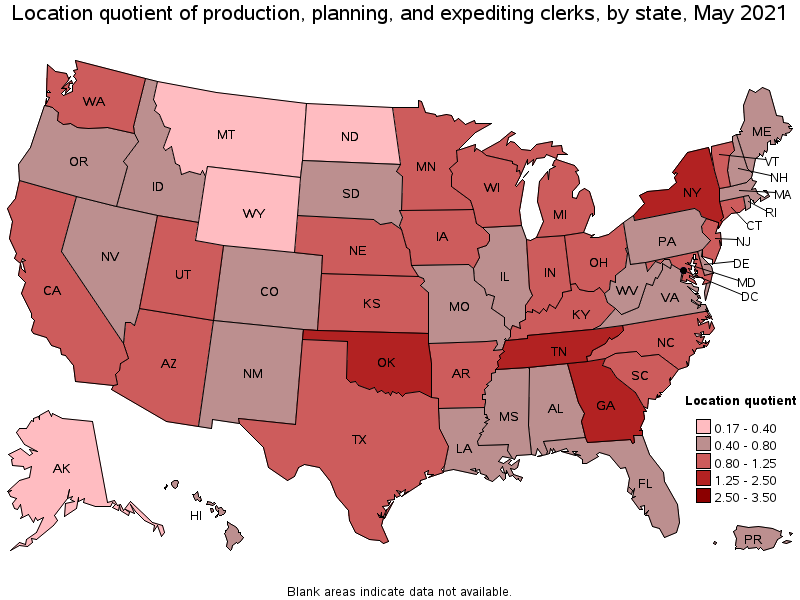
States with the highest concentration of jobs and location quotients in Production, Planning, and Expediting Clerks:
| State | Employment (1) | Employment per thousand jobs | Location quotient (9) | Hourly mean wage | Annual mean wage (2) |
|---|---|---|---|---|---|
| New York | 50,300 | 5.80 | 2.23 | $ 26.47 | $ 55,050 |
| Oklahoma | 5,540 | 3.56 | 1.36 | $ 24.24 | $ 50,410 |
| Georgia | 15,310 | 3.50 | 1.34 | $ 23.50 | $ 48,890 |
| Tennessee | 10,180 | 3.41 | 1.31 | $ 22.48 | $ 46,750 |
| Arizona | 9,300 | 3.23 | 1.24 | $ 24.43 | $ 50,820 |
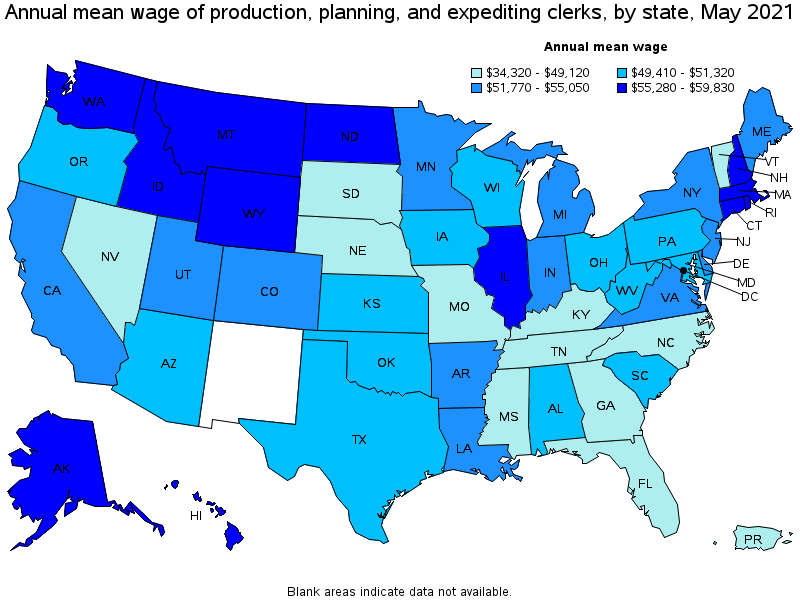
Top paying states for Production, Planning, and Expediting Clerks:
| State | Employment (1) | Employment per thousand jobs | Location quotient (9) | Hourly mean wage | Annual mean wage (2) |
|---|---|---|---|---|---|
| Connecticut | 4,410 | 2.80 | 1.07 | $ 28.77 | $ 59,830 |
| Rhode Island | 660 | 1.44 | 0.55 | $ 28.51 | $ 59,300 |
| District of Columbia | 450 | 0.67 | 0.26 | $ 28.46 | $ 59,200 |
| Massachusetts | 6,810 | 2.01 | 0.77 | $ 27.89 | $ 58,000 |
| Wyoming | 170 | 0.65 | 0.25 | $ 27.78 | $ 57,780 |
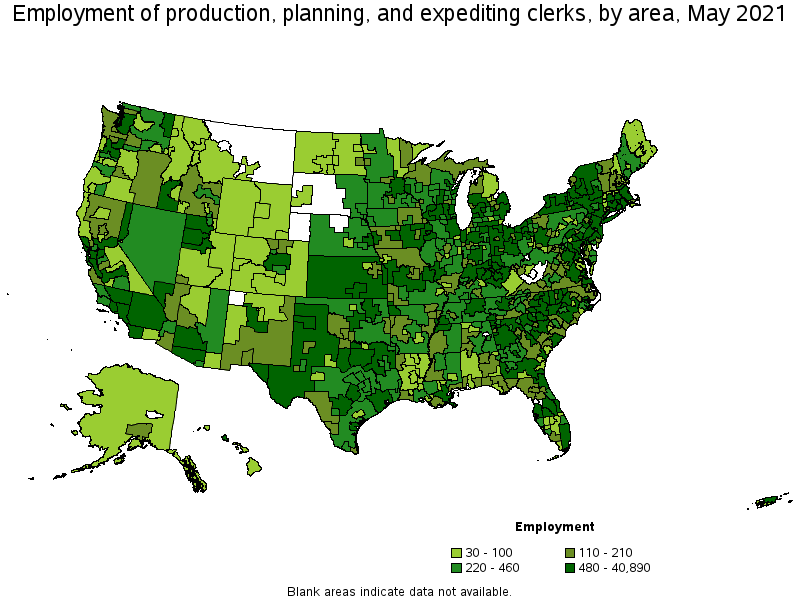
Metropolitan areas with the highest employment level in Production, Planning, and Expediting Clerks:
| Metropolitan area | Employment (1) | Employment per thousand jobs | Location quotient (9) | Hourly mean wage | Annual mean wage (2) |
|---|---|---|---|---|---|
| New York-Newark-Jersey City, NY-NJ-PA | 40,890 | 4.71 | 1.81 | $ 27.44 | $ 57,080 |
| Los Angeles-Long Beach-Anaheim, CA | 21,200 | 3.71 | 1.42 | $ 25.29 | $ 52,600 |
| Dallas-Fort Worth-Arlington, TX | 10,210 | 2.85 | 1.09 | $ 24.22 | $ 50,380 |
| Atlanta-Sandy Springs-Roswell, GA | 9,120 | 3.53 | 1.35 | $ 23.82 | $ 49,550 |
| Houston-The Woodlands-Sugar Land, TX | 8,040 | 2.78 | 1.06 | $ 26.54 | $ 55,200 |
| Chicago-Naperville-Elgin, IL-IN-WI | 7,570 | 1.79 | 0.69 | $ 26.98 | $ 56,130 |
| Phoenix-Mesa-Scottsdale, AZ | 7,230 | 3.42 | 1.31 | $ 24.21 | $ 50,350 |
| San Francisco-Oakland-Hayward, CA | 6,800 | 3.03 | 1.16 | $ 30.31 | $ 63,050 |
| Seattle-Tacoma-Bellevue, WA | 5,620 | 2.93 | 1.13 | $ 27.36 | $ 56,920 |
| Boston-Cambridge-Nashua, MA-NH | 5,300 | 2.05 | 0.79 | $ 28.41 | $ 59,090 |
Metropolitan areas with the highest concentration of jobs and location quotients in Production, Planning, and Expediting Clerks:
| Metropolitan area | Employment (1) | Employment per thousand jobs | Location quotient (9) | Hourly mean wage | Annual mean wage (2) |
|---|---|---|---|---|---|
| Ithaca, NY | 410 | 8.91 | 3.42 | $ 29.93 | $ 62,250 |
| Warner Robins, GA | 650 | 8.81 | 3.38 | $ 27.43 | $ 57,050 |
| Battle Creek, MI | 370 | 7.25 | 2.78 | $ 23.00 | $ 47,830 |
| Dalton, GA | 450 | 7.19 | 2.76 | $ 20.89 | $ 43,440 |
| Bremerton-Silverdale, WA | 590 | 6.83 | 2.62 | $ 32.28 | $ 67,140 |
| Rochester, NY | 2,910 | 6.19 | 2.37 | $ 23.88 | $ 49,670 |
| Binghamton, NY | 540 | 5.93 | 2.28 | $ 23.68 | $ 49,260 |
| Syracuse, NY | 1,610 | 5.76 | 2.21 | $ 25.48 | $ 53,000 |
| Sheboygan, WI | 330 | 5.69 | 2.18 | $ 23.35 | $ 48,570 |
| Buffalo-Cheektowaga-Niagara Falls, NY | 2,820 | 5.66 | 2.17 | $ 23.63 | $ 49,140 |
Top paying metropolitan areas for Production, Planning, and Expediting Clerks:
| Metropolitan area | Employment (1) | Employment per thousand jobs | Location quotient (9) | Hourly mean wage | Annual mean wage (2) |
|---|---|---|---|---|---|
| Idaho Falls, ID | 230 | 3.20 | 1.23 | $ 36.05 | $ 74,970 |
| Norwich-New London-Westerly, CT-RI | 610 | 5.28 | 2.03 | $ 34.21 | $ 71,160 |
| Bremerton-Silverdale, WA | 590 | 6.83 | 2.62 | $ 32.28 | $ 67,140 |
| Portsmouth, NH-ME | 210 | 2.33 | 0.89 | $ 31.80 | $ 66,140 |
| Bismarck, ND | 40 | 0.51 | 0.19 | $ 31.29 | $ 65,090 |
| San Jose-Sunnyvale-Santa Clara, CA | 3,790 | 3.54 | 1.36 | $ 30.66 | $ 63,770 |
| Beaumont-Port Arthur, TX | 380 | 2.56 | 0.98 | $ 30.33 | $ 63,090 |
| San Francisco-Oakland-Hayward, CA | 6,800 | 3.03 | 1.16 | $ 30.31 | $ 63,050 |
| Midland, TX | 260 | 2.69 | 1.03 | $ 30.29 | $ 63,010 |
| Lake Charles, LA | 130 | 1.46 | 0.56 | $ 30.20 | $ 62,810 |
Nonmetropolitan areas with the highest employment in Production, Planning, and Expediting Clerks:
| Nonmetropolitan area | Employment (1) | Employment per thousand jobs | Location quotient (9) | Hourly mean wage | Annual mean wage (2) |
|---|---|---|---|---|---|
| North Northeastern Ohio nonmetropolitan area (noncontiguous) | 1,020 | 3.26 | 1.25 | $ 25.00 | $ 51,990 |
| West Northwestern Ohio nonmetropolitan area | 1,020 | 4.25 | 1.63 | $ 25.29 | $ 52,610 |
| Southeast Iowa nonmetropolitan area | 960 | 4.57 | 1.75 | $ 23.61 | $ 49,110 |
| Kansas nonmetropolitan area | 930 | 2.47 | 0.95 | $ 22.46 | $ 46,710 |
| Central East New York nonmetropolitan area | 850 | 5.65 | 2.17 | $ 24.53 | $ 51,020 |
Nonmetropolitan areas with the highest concentration of jobs and location quotients in Production, Planning, and Expediting Clerks:
| Nonmetropolitan area | Employment (1) | Employment per thousand jobs | Location quotient (9) | Hourly mean wage | Annual mean wage (2) |
|---|---|---|---|---|---|
| Central East New York nonmetropolitan area | 850 | 5.65 | 2.17 | $ 24.53 | $ 51,020 |
| Southwest New York nonmetropolitan area | 850 | 5.08 | 1.95 | $ 23.53 | $ 48,940 |
| Southeast Iowa nonmetropolitan area | 960 | 4.57 | 1.75 | $ 23.61 | $ 49,110 |
| Central Missouri nonmetropolitan area | 680 | 4.45 | 1.71 | $ 17.72 | $ 36,860 |
| West Northwestern Ohio nonmetropolitan area | 1,020 | 4.25 | 1.63 | $ 25.29 | $ 52,610 |
Top paying nonmetropolitan areas for Production, Planning, and Expediting Clerks:
| Nonmetropolitan area | Employment (1) | Employment per thousand jobs | Location quotient (9) | Hourly mean wage | Annual mean wage (2) |
|---|---|---|---|---|---|
| West North Dakota nonmetropolitan area | 60 | 0.56 | 0.22 | $ 32.58 | $ 67,770 |
| West Arkansas nonmetropolitan area | 200 | 2.42 | 0.93 | $ 31.67 | $ 65,880 |
| Western Wyoming nonmetropolitan area | 30 | 0.36 | 0.14 | $ 31.15 | $ 64,780 |
| Northeast Minnesota nonmetropolitan area | 50 | 1.12 | 0.43 | $ 30.35 | $ 63,140 |
| Coastal Plains Region of Texas nonmetropolitan area | 400 | 2.81 | 1.08 | $ 29.54 | $ 61,450 |
These estimates are calculated with data collected from employers in all industry sectors, all metropolitan and nonmetropolitan areas, and all states and the District of Columbia. The top employment and wage figures are provided above. The complete list is available in the downloadable XLS files.
The percentile wage estimate is the value of a wage below which a certain percent of workers fall. The median wage is the 50th percentile wage estimate—50 percent of workers earn less than the median and 50 percent of workers earn more than the median. More about percentile wages.
(1) Estimates for detailed occupations do not sum to the totals because the totals include occupations not shown separately. Estimates do not include self-employed workers.
(2) Annual wages have been calculated by multiplying the hourly mean wage by a "year-round, full-time" hours figure of 2,080 hours; for those occupations where there is not an hourly wage published, the annual wage has been directly calculated from the reported survey data.
(3) The relative standard error (RSE) is a measure of the reliability of a survey statistic. The smaller the relative standard error, the more precise the estimate.
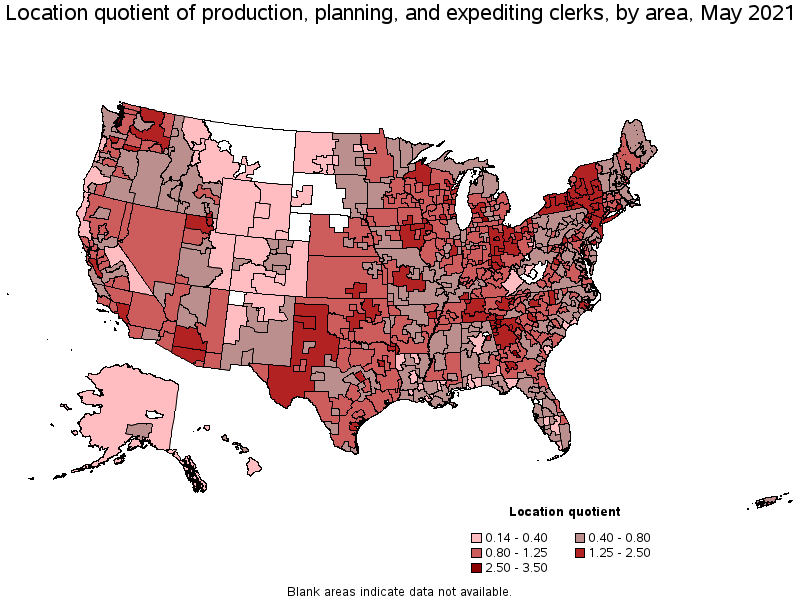
(9) The location quotient is the ratio of the area concentration of occupational employment to the national average concentration. A location quotient greater than one indicates the occupation has a higher share of employment than average, and a location quotient less than one indicates the occupation is less prevalent in the area than average.
Other OEWS estimates and related information:
May 2021 National Occupational Employment and Wage Estimates
May 2021 State Occupational Employment and Wage Estimates
May 2021 Metropolitan and Nonmetropolitan Area Occupational Employment and Wage Estimates
May 2021 National Industry-Specific Occupational Employment and Wage Estimates
Last Modified Date: March 31, 2022