
An official website of the United States government
An official website of the United States government
The .gov means it's official.
Federal government websites often end in .gov or .mil. Before sharing sensitive information,
make sure you're on a federal government site.
The site is secure.
The
https:// ensures that you are connecting to the official website and that any
information you provide is encrypted and transmitted securely.
Perform secretarial duties using specific knowledge of medical terminology and hospital, clinic, or laboratory procedures. Duties may include scheduling appointments, billing patients, and compiling and recording medical charts, reports, and correspondence.
Employment estimate and mean wage estimates for Medical Secretaries and Administrative Assistants:
| Employment (1) | Employment RSE (3) |
Mean hourly wage |
Mean annual wage (2) |
Wage RSE (3) |
|---|---|---|---|---|
| 656,640 | 0.9 % | $ 19.11 | $ 39,740 | 0.3 % |
Percentile wage estimates for Medical Secretaries and Administrative Assistants:
| Percentile | 10% | 25% | 50% (Median) |
75% | 90% |
|---|---|---|---|---|---|
| Hourly Wage | $ 13.96 | $ 14.77 | $ 18.01 | $ 22.39 | $ 25.78 |
| Annual Wage (2) | $ 29,040 | $ 30,710 | $ 37,450 | $ 46,570 | $ 53,630 |
Industries with the highest published employment and wages for Medical Secretaries and Administrative Assistants are provided. For a list of all industries with employment in Medical Secretaries and Administrative Assistants, see the Create Customized Tables function.
Industries with the highest levels of employment in Medical Secretaries and Administrative Assistants:
| Industry | Employment (1) | Percent of industry employment | Hourly mean wage | Annual mean wage (2) |
|---|---|---|---|---|
| Offices of Physicians | 213,240 | 7.91 | $ 18.33 | $ 38,130 |
| General Medical and Surgical Hospitals | 154,220 | 2.76 | $ 19.45 | $ 40,450 |
| Offices of Dentists | 89,180 | 9.18 | $ 20.76 | $ 43,170 |
| Offices of Other Health Practitioners | 46,750 | 4.81 | $ 17.18 | $ 35,720 |
| Outpatient Care Centers | 43,570 | 4.41 | $ 21.23 | $ 44,160 |
Industries with the highest concentration of employment in Medical Secretaries and Administrative Assistants:
| Industry | Employment (1) | Percent of industry employment | Hourly mean wage | Annual mean wage (2) |
|---|---|---|---|---|
| Offices of Dentists | 89,180 | 9.18 | $ 20.76 | $ 43,170 |
| Offices of Physicians | 213,240 | 7.91 | $ 18.33 | $ 38,130 |
| Offices of Other Health Practitioners | 46,750 | 4.81 | $ 17.18 | $ 35,720 |
| Outpatient Care Centers | 43,570 | 4.41 | $ 21.23 | $ 44,160 |
| Medical and Diagnostic Laboratories | 8,600 | 2.92 | $ 18.07 | $ 37,590 |
Top paying industries for Medical Secretaries and Administrative Assistants:
| Industry | Employment (1) | Percent of industry employment | Hourly mean wage | Annual mean wage (2) |
|---|---|---|---|---|
| Merchant Wholesalers, Nondurable Goods (4242 and 4246 only) | (8) | (8) | $ 34.81 | $ 72,410 |
| Legal Services | 720 | 0.06 | $ 22.51 | $ 46,820 |
| Business, Professional, Labor, Political, and Similar Organizations | 80 | 0.02 | $ 22.44 | $ 46,680 |
| Personal Care Services | (8) | (8) | $ 21.90 | $ 45,550 |
| Electronic Shopping and Mail-Order Houses | 110 | 0.02 | $ 21.83 | $ 45,410 |
States and areas with the highest published employment, location quotients, and wages for Medical Secretaries and Administrative Assistants are provided. For a list of all areas with employment in Medical Secretaries and Administrative Assistants, see the Create Customized Tables function.
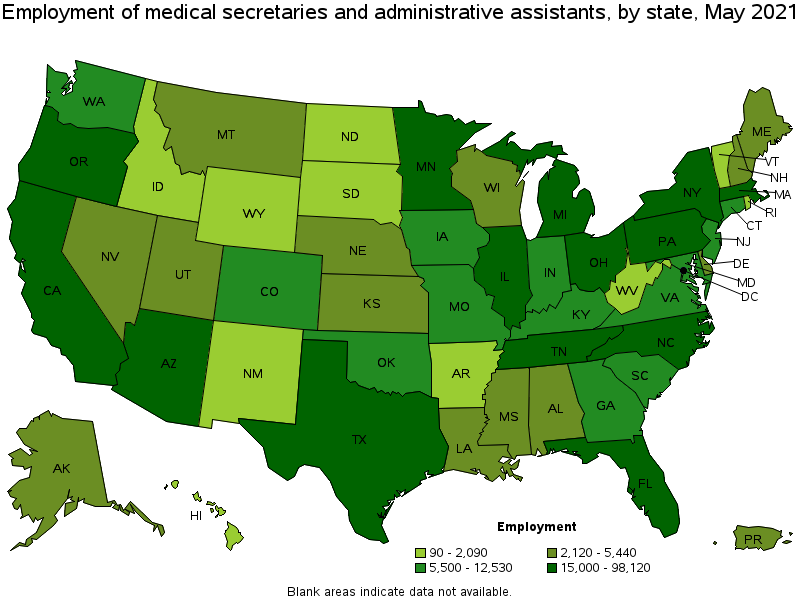
States with the highest employment level in Medical Secretaries and Administrative Assistants:
| State | Employment (1) | Employment per thousand jobs | Location quotient (9) | Hourly mean wage | Annual mean wage (2) |
|---|---|---|---|---|---|
| California | 98,120 | 5.94 | 1.27 | $ 22.31 | $ 46,400 |
| Texas | 64,740 | 5.30 | 1.14 | $ 17.50 | $ 36,390 |
| Florida | 55,190 | 6.41 | 1.38 | $ 17.21 | $ 35,800 |
| New York | 44,290 | 5.11 | 1.10 | $ 20.46 | $ 42,560 |
| Pennsylvania | 35,180 | 6.30 | 1.35 | $ 18.16 | $ 37,770 |
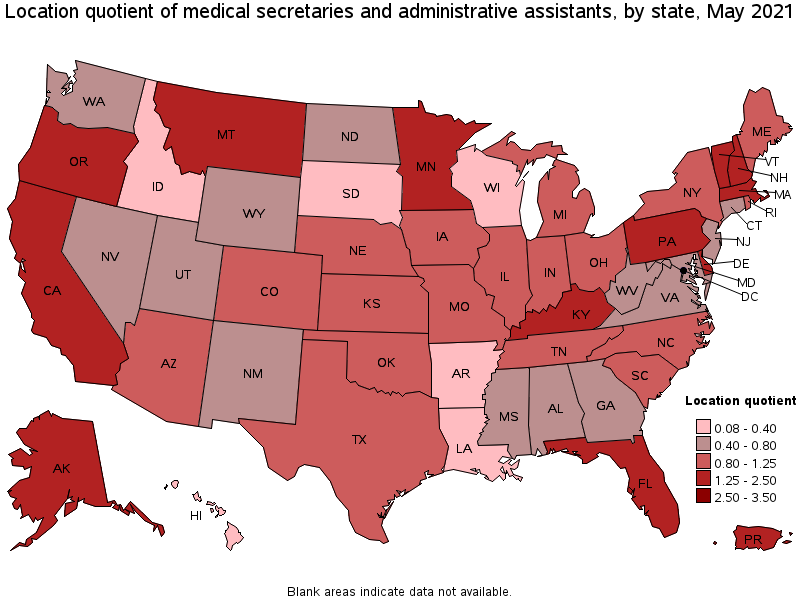
States with the highest concentration of jobs and location quotients in Medical Secretaries and Administrative Assistants:
| State | Employment (1) | Employment per thousand jobs | Location quotient (9) | Hourly mean wage | Annual mean wage (2) |
|---|---|---|---|---|---|
| Delaware | 5,050 | 11.60 | 2.49 | $ 18.60 | $ 38,680 |
| Montana | 4,360 | 9.26 | 1.99 | $ 17.03 | $ 35,420 |
| Oregon | 15,000 | 8.22 | 1.76 | $ 21.31 | $ 44,330 |
| Vermont | 2,090 | 7.36 | 1.58 | $ 19.60 | $ 40,770 |
| Alaska | 2,120 | 7.15 | 1.53 | $ 20.41 | $ 42,460 |
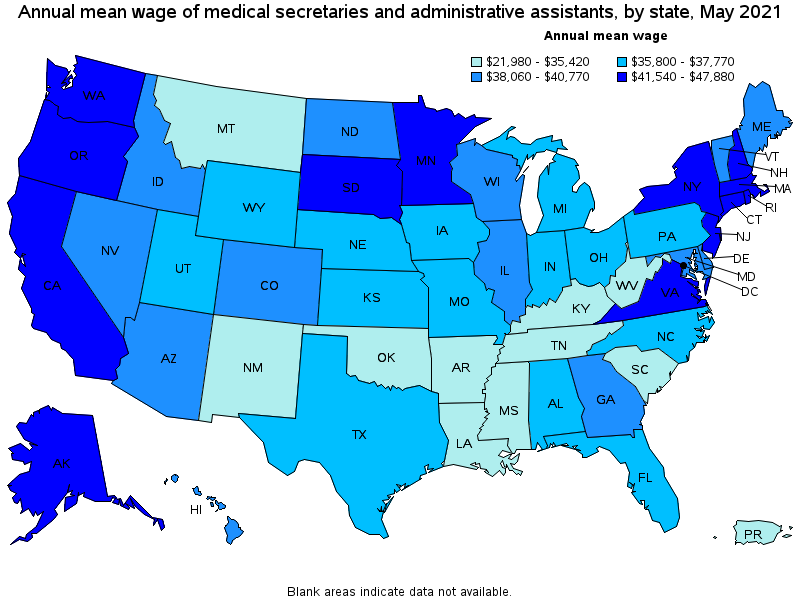
Top paying states for Medical Secretaries and Administrative Assistants:
| State | Employment (1) | Employment per thousand jobs | Location quotient (9) | Hourly mean wage | Annual mean wage (2) |
|---|---|---|---|---|---|
| District of Columbia | 1,120 | 1.69 | 0.36 | $ 23.02 | $ 47,880 |
| Washington | 7,830 | 2.44 | 0.52 | $ 22.68 | $ 47,170 |
| California | 98,120 | 5.94 | 1.27 | $ 22.31 | $ 46,400 |
| Massachusetts | 23,850 | 7.03 | 1.51 | $ 22.18 | $ 46,130 |
| Rhode Island | 1,790 | 3.90 | 0.84 | $ 21.90 | $ 45,560 |
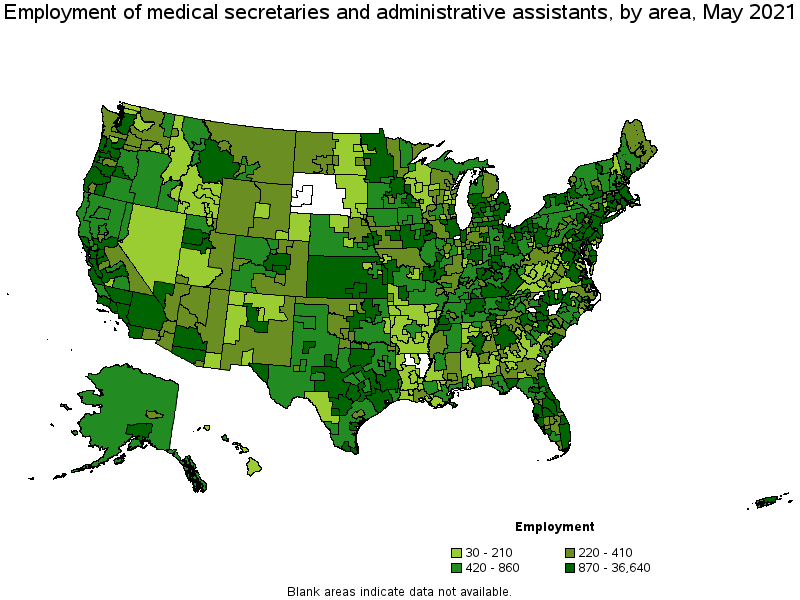
Metropolitan areas with the highest employment level in Medical Secretaries and Administrative Assistants:
| Metropolitan area | Employment (1) | Employment per thousand jobs | Location quotient (9) | Hourly mean wage | Annual mean wage (2) |
|---|---|---|---|---|---|
| New York-Newark-Jersey City, NY-NJ-PA | 36,640 | 4.22 | 0.91 | $ 21.31 | $ 44,320 |
| Los Angeles-Long Beach-Anaheim, CA | 30,930 | 5.41 | 1.16 | $ 22.11 | $ 45,980 |
| Boston-Cambridge-Nashua, MA-NH | 18,860 | 7.30 | 1.57 | $ 22.50 | $ 46,800 |
| Dallas-Fort Worth-Arlington, TX | 18,430 | 5.14 | 1.10 | $ 18.68 | $ 38,840 |
| Chicago-Naperville-Elgin, IL-IN-WI | 17,080 | 4.04 | 0.87 | $ 19.48 | $ 40,520 |
| Philadelphia-Camden-Wilmington, PA-NJ-DE-MD | 17,060 | 6.43 | 1.38 | $ 19.95 | $ 41,490 |
| Miami-Fort Lauderdale-West Palm Beach, FL | 16,710 | 6.82 | 1.46 | $ 18.02 | $ 37,470 |
| Houston-The Woodlands-Sugar Land, TX | 15,250 | 5.26 | 1.13 | $ 18.26 | $ 37,990 |
| San Francisco-Oakland-Hayward, CA | 13,250 | 5.91 | 1.27 | $ 25.14 | $ 52,300 |
| Phoenix-Mesa-Scottsdale, AZ | 11,420 | 5.40 | 1.16 | $ 19.09 | $ 39,700 |
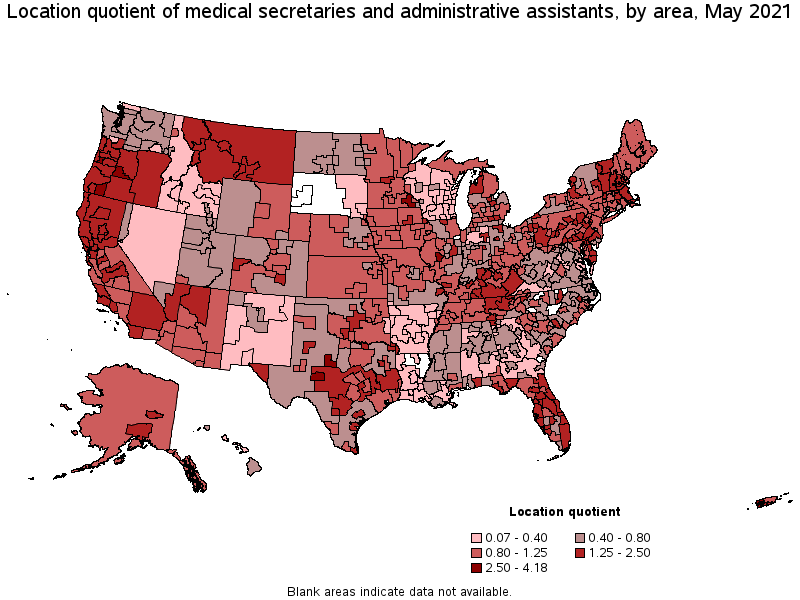
Metropolitan areas with the highest concentration of jobs and location quotients in Medical Secretaries and Administrative Assistants:
| Metropolitan area | Employment (1) | Employment per thousand jobs | Location quotient (9) | Hourly mean wage | Annual mean wage (2) |
|---|---|---|---|---|---|
| Rochester, MN | 2,260 | 19.46 | 4.18 | $ 20.58 | $ 42,810 |
| Abilene, TX | 960 | 13.98 | 3.00 | $ 15.25 | $ 31,710 |
| San Angelo, TX | 640 | 13.83 | 2.97 | $ 15.27 | $ 31,770 |
| Medford, OR | 1,090 | 12.71 | 2.73 | $ 19.57 | $ 40,700 |
| Bend-Redmond, OR | 1,050 | 12.52 | 2.69 | $ 20.07 | $ 41,740 |
| Springfield, IL | 1,160 | 11.99 | 2.57 | $ 17.94 | $ 37,320 |
| Corvallis, OR | 420 | 11.93 | 2.56 | $ 19.72 | $ 41,030 |
| Missoula, MT | 670 | 11.17 | 2.40 | $ 16.67 | $ 34,670 |
| Great Falls, MT | 380 | 11.08 | 2.38 | $ 16.40 | $ 34,120 |
| Carbondale-Marion, IL | 550 | 10.77 | 2.31 | $ 15.58 | $ 32,410 |
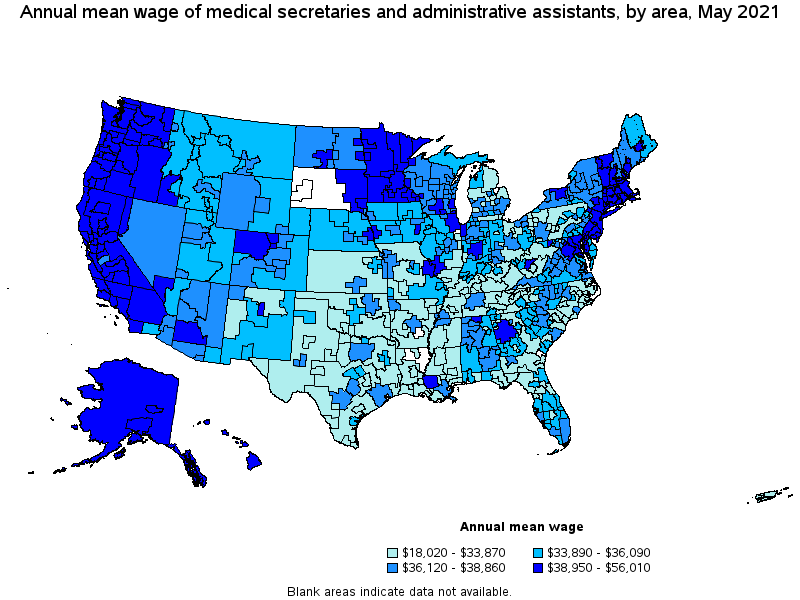
Top paying metropolitan areas for Medical Secretaries and Administrative Assistants:
| Metropolitan area | Employment (1) | Employment per thousand jobs | Location quotient (9) | Hourly mean wage | Annual mean wage (2) |
|---|---|---|---|---|---|
| San Jose-Sunnyvale-Santa Clara, CA | 5,920 | 5.54 | 1.19 | $ 26.93 | $ 56,010 |
| Napa, CA | 450 | 6.56 | 1.41 | $ 25.30 | $ 52,630 |
| San Francisco-Oakland-Hayward, CA | 13,250 | 5.91 | 1.27 | $ 25.14 | $ 52,300 |
| Vallejo-Fairfield, CA | 760 | 5.85 | 1.26 | $ 24.68 | $ 51,340 |
| Seattle-Tacoma-Bellevue, WA | 4,670 | 2.43 | 0.52 | $ 24.00 | $ 49,920 |
| Portsmouth, NH-ME | 500 | 5.67 | 1.22 | $ 23.41 | $ 48,690 |
| Barnstable Town, MA | 560 | 5.81 | 1.25 | $ 23.25 | $ 48,360 |
| Olympia-Tumwater, WA | 250 | 2.22 | 0.48 | $ 23.23 | $ 48,320 |
| Santa Rosa, CA | 1,180 | 6.15 | 1.32 | $ 22.81 | $ 47,440 |
| Portland-Vancouver-Hillsboro, OR-WA | 7,870 | 7.01 | 1.51 | $ 22.76 | $ 47,330 |
Nonmetropolitan areas with the highest employment in Medical Secretaries and Administrative Assistants:
| Nonmetropolitan area | Employment (1) | Employment per thousand jobs | Location quotient (9) | Hourly mean wage | Annual mean wage (2) |
|---|---|---|---|---|---|
| Hill Country Region of Texas nonmetropolitan area | 1,640 | 8.65 | 1.86 | $ 14.89 | $ 30,960 |
| Kansas nonmetropolitan area | 1,470 | 3.92 | 0.84 | $ 15.62 | $ 32,490 |
| Southwest Montana nonmetropolitan area | 1,290 | 9.30 | 2.00 | $ 17.21 | $ 35,790 |
| South Central Kentucky nonmetropolitan area | 1,220 | 7.45 | 1.60 | $ 14.48 | $ 30,110 |
| Southeast Iowa nonmetropolitan area | 1,160 | 5.54 | 1.19 | $ 16.45 | $ 34,210 |
Nonmetropolitan areas with the highest concentration of jobs and location quotients in Medical Secretaries and Administrative Assistants:
| Nonmetropolitan area | Employment (1) | Employment per thousand jobs | Location quotient (9) | Hourly mean wage | Annual mean wage (2) |
|---|---|---|---|---|---|
| West Montana nonmetropolitan area | 840 | 11.07 | 2.38 | $ 16.94 | $ 35,230 |
| Big Thicket Region of Texas nonmetropolitan area | 1,060 | 10.26 | 2.20 | $ 14.03 | $ 29,170 |
| East Kentucky nonmetropolitan area | 930 | 9.77 | 2.10 | $ 14.76 | $ 30,700 |
| Southwest Montana nonmetropolitan area | 1,290 | 9.30 | 2.00 | $ 17.21 | $ 35,790 |
| Hill Country Region of Texas nonmetropolitan area | 1,640 | 8.65 | 1.86 | $ 14.89 | $ 30,960 |
Top paying nonmetropolitan areas for Medical Secretaries and Administrative Assistants:
| Nonmetropolitan area | Employment (1) | Employment per thousand jobs | Location quotient (9) | Hourly mean wage | Annual mean wage (2) |
|---|---|---|---|---|---|
| Alaska nonmetropolitan area | 490 | 5.04 | 1.08 | $ 21.97 | $ 45,690 |
| Massachusetts nonmetropolitan area | 290 | 4.99 | 1.07 | $ 20.98 | $ 43,640 |
| Western Washington nonmetropolitan area | 390 | 3.27 | 0.70 | $ 20.88 | $ 43,430 |
| East South Dakota nonmetropolitan area | 40 | 0.33 | 0.07 | $ 20.54 | $ 42,730 |
| Connecticut nonmetropolitan area | 160 | 5.10 | 1.09 | $ 20.29 | $ 42,200 |
These estimates are calculated with data collected from employers in all industry sectors, all metropolitan and nonmetropolitan areas, and all states and the District of Columbia. The top employment and wage figures are provided above. The complete list is available in the downloadable XLS files.
The percentile wage estimate is the value of a wage below which a certain percent of workers fall. The median wage is the 50th percentile wage estimate—50 percent of workers earn less than the median and 50 percent of workers earn more than the median. More about percentile wages.
(1) Estimates for detailed occupations do not sum to the totals because the totals include occupations not shown separately. Estimates do not include self-employed workers.
(2) Annual wages have been calculated by multiplying the hourly mean wage by a "year-round, full-time" hours figure of 2,080 hours; for those occupations where there is not an hourly wage published, the annual wage has been directly calculated from the reported survey data.
(3) The relative standard error (RSE) is a measure of the reliability of a survey statistic. The smaller the relative standard error, the more precise the estimate.
(8) Estimate not released.
(9) The location quotient is the ratio of the area concentration of occupational employment to the national average concentration. A location quotient greater than one indicates the occupation has a higher share of employment than average, and a location quotient less than one indicates the occupation is less prevalent in the area than average.
Other OEWS estimates and related information:
May 2021 National Occupational Employment and Wage Estimates
May 2021 State Occupational Employment and Wage Estimates
May 2021 Metropolitan and Nonmetropolitan Area Occupational Employment and Wage Estimates
May 2021 National Industry-Specific Occupational Employment and Wage Estimates
Last Modified Date: March 31, 2022