
An official website of the United States government
An official website of the United States government
The .gov means it's official.
Federal government websites often end in .gov or .mil. Before sharing sensitive information,
make sure you're on a federal government site.
The site is secure.
The
https:// ensures that you are connecting to the official website and that any
information you provide is encrypted and transmitted securely.
Operate data entry device, such as keyboard or photo composing perforator. Duties may include verifying data and preparing materials for printing. Excludes �Word Processors and Typists� (43-9022).
Employment estimate and mean wage estimates for Data Entry Keyers:
| Employment (1) | Employment RSE (3) |
Mean hourly wage |
Mean annual wage (2) |
Wage RSE (3) |
|---|---|---|---|---|
| 147,170 | 1.7 % | $ 17.28 | $ 35,940 | 0.4 % |
Percentile wage estimates for Data Entry Keyers:
| Percentile | 10% | 25% | 50% (Median) |
75% | 90% |
|---|---|---|---|---|---|
| Hourly Wage | $ 11.79 | $ 14.09 | $ 17.13 | $ 18.86 | $ 22.94 |
| Annual Wage (2) | $ 24,510 | $ 29,310 | $ 35,630 | $ 39,230 | $ 47,700 |
Industries with the highest published employment and wages for Data Entry Keyers are provided. For a list of all industries with employment in Data Entry Keyers, see the Create Customized Tables function.
Industries with the highest levels of employment in Data Entry Keyers:
| Industry | Employment (1) | Percent of industry employment | Hourly mean wage | Annual mean wage (2) |
|---|---|---|---|---|
| Employment Services | 20,170 | 0.58 | $ 16.32 | $ 33,950 |
| Data Processing, Hosting, and Related Services | 8,580 | 2.27 | $ 15.70 | $ 32,660 |
| Accounting, Tax Preparation, Bookkeeping, and Payroll Services | 7,110 | 0.71 | $ 15.44 | $ 32,110 |
| Local Government, excluding schools and hospitals (OEWS Designation) | 6,560 | 0.12 | $ 20.36 | $ 42,350 |
| Elementary and Secondary Schools | 6,310 | 0.08 | $ 16.92 | $ 35,200 |
Industries with the highest concentration of employment in Data Entry Keyers:
| Industry | Employment (1) | Percent of industry employment | Hourly mean wage | Annual mean wage (2) |
|---|---|---|---|---|
| Data Processing, Hosting, and Related Services | 8,580 | 2.27 | $ 15.70 | $ 32,660 |
| Accounting, Tax Preparation, Bookkeeping, and Payroll Services | 7,110 | 0.71 | $ 15.44 | $ 32,110 |
| Other Investment Pools and Funds | 80 | 0.66 | $ 14.28 | $ 29,700 |
| Medical and Diagnostic Laboratories | 1,850 | 0.63 | $ 16.84 | $ 35,020 |
| Freight Transportation Arrangement | 1,420 | 0.61 | $ 17.26 | $ 35,900 |
Top paying industries for Data Entry Keyers:
| Industry | Employment (1) | Percent of industry employment | Hourly mean wage | Annual mean wage (2) |
|---|---|---|---|---|
| Electronics and Appliance Stores | (8) | (8) | $ 23.91 | $ 49,740 |
| Highway, Street, and Bridge Construction | 40 | 0.01 | $ 23.53 | $ 48,950 |
| Electric Power Generation, Transmission and Distribution | 100 | 0.03 | $ 23.40 | $ 48,680 |
| Postal Service (federal government) | 940 | 0.15 | $ 23.38 | $ 48,620 |
| Securities, Commodity Contracts, and Other Financial Investments and Related Activities | 780 | 0.08 | $ 22.75 | $ 47,310 |
States and areas with the highest published employment, location quotients, and wages for Data Entry Keyers are provided. For a list of all areas with employment in Data Entry Keyers, see the Create Customized Tables function.
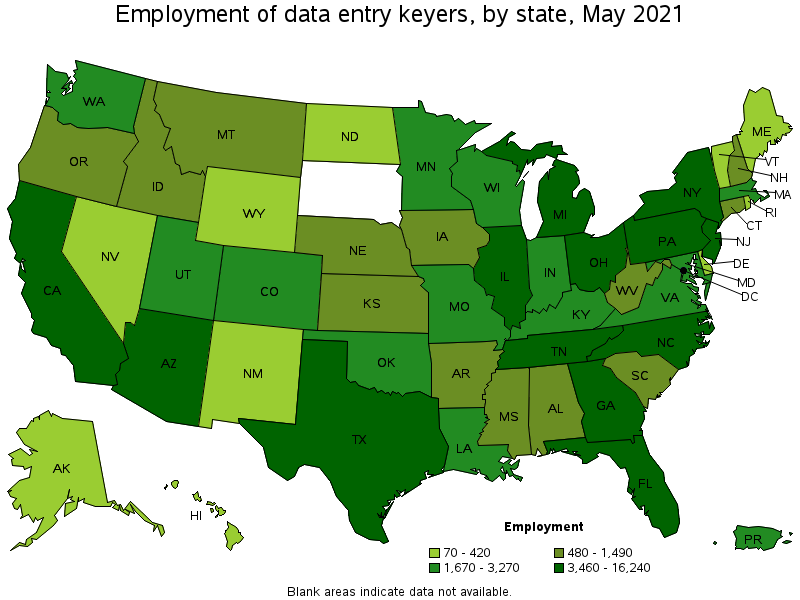
States with the highest employment level in Data Entry Keyers:
| State | Employment (1) | Employment per thousand jobs | Location quotient (9) | Hourly mean wage | Annual mean wage (2) |
|---|---|---|---|---|---|
| Texas | 16,240 | 1.33 | 1.27 | $ 16.24 | $ 33,790 |
| California | 15,780 | 0.95 | 0.91 | $ 19.18 | $ 39,880 |
| Florida | 11,170 | 1.30 | 1.24 | $ 15.94 | $ 33,150 |
| New York | 8,980 | 1.04 | 0.99 | $ 19.08 | $ 39,680 |
| Illinois | 8,250 | 1.47 | 1.41 | $ 18.20 | $ 37,860 |
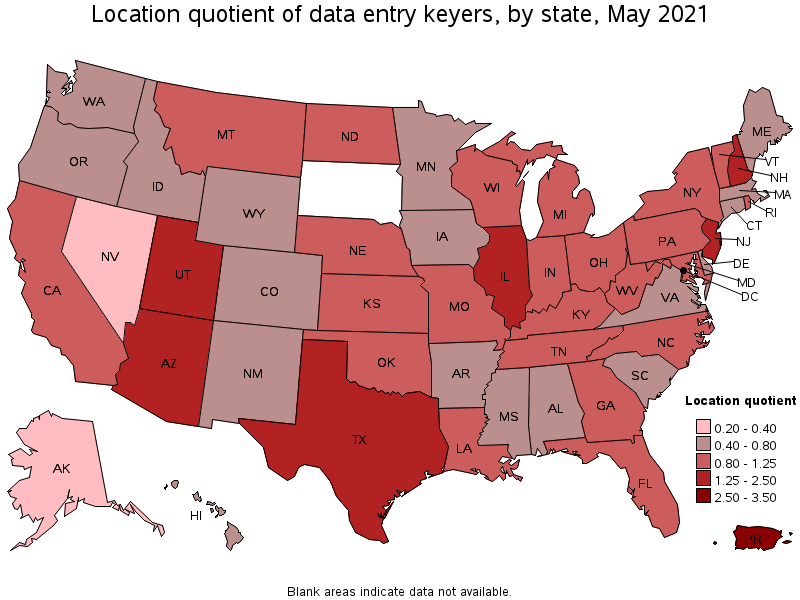
States with the highest concentration of jobs and location quotients in Data Entry Keyers:
| State | Employment (1) | Employment per thousand jobs | Location quotient (9) | Hourly mean wage | Annual mean wage (2) |
|---|---|---|---|---|---|
| Utah | 3,250 | 2.09 | 2.00 | $ 17.76 | $ 36,940 |
| New Jersey | 6,800 | 1.77 | 1.69 | $ 19.23 | $ 40,000 |
| Illinois | 8,250 | 1.47 | 1.41 | $ 18.20 | $ 37,860 |
| New Hampshire | 910 | 1.43 | 1.37 | $ 17.70 | $ 36,810 |
| Arizona | 3,970 | 1.38 | 1.32 | $ 17.69 | $ 36,790 |
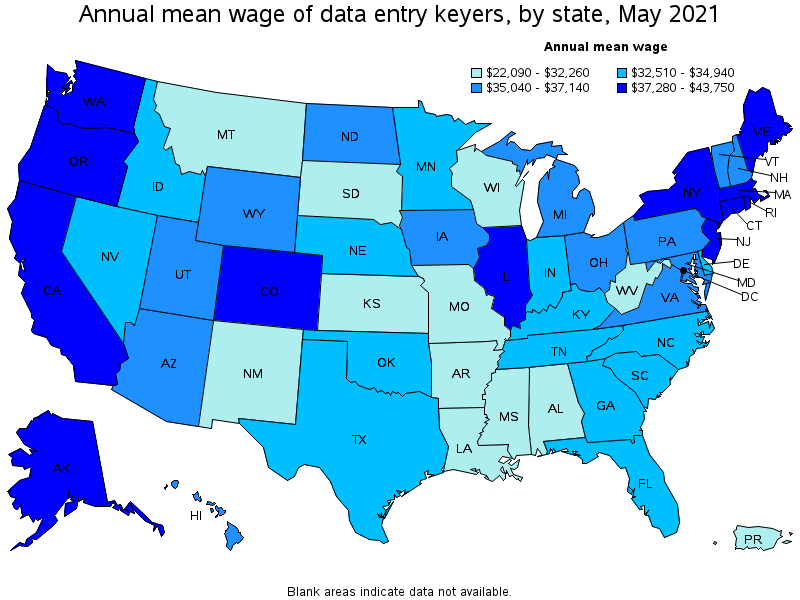
Top paying states for Data Entry Keyers:
| State | Employment (1) | Employment per thousand jobs | Location quotient (9) | Hourly mean wage | Annual mean wage (2) |
|---|---|---|---|---|---|
| Alaska | 110 | 0.36 | 0.34 | $ 21.03 | $ 43,750 |
| Massachusetts | 1,910 | 0.56 | 0.54 | $ 20.01 | $ 41,630 |
| District of Columbia | 410 | 0.62 | 0.59 | $ 19.59 | $ 40,750 |
| Washington | 1,780 | 0.56 | 0.53 | $ 19.58 | $ 40,720 |
| Rhode Island | 420 | 0.92 | 0.88 | $ 19.52 | $ 40,600 |
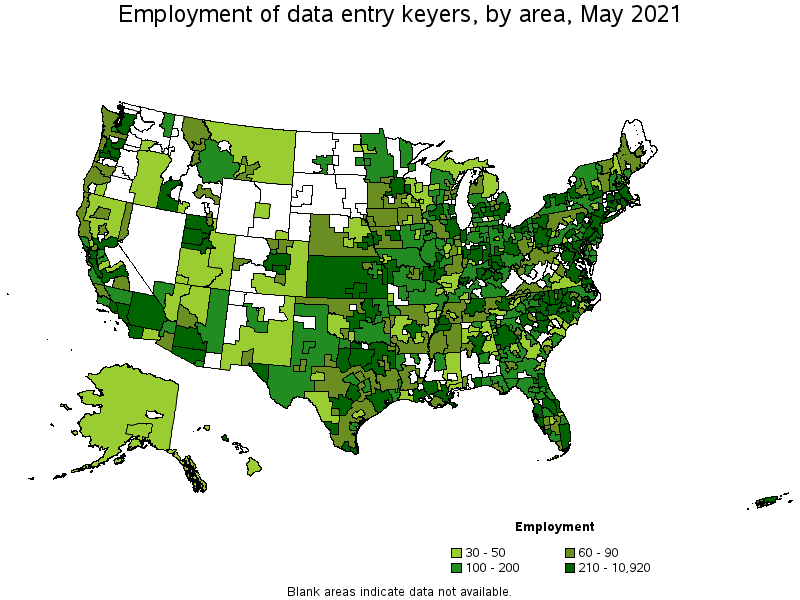
Metropolitan areas with the highest employment level in Data Entry Keyers:
| Metropolitan area | Employment (1) | Employment per thousand jobs | Location quotient (9) | Hourly mean wage | Annual mean wage (2) |
|---|---|---|---|---|---|
| New York-Newark-Jersey City, NY-NJ-PA | 10,920 | 1.26 | 1.20 | $ 19.55 | $ 40,670 |
| Los Angeles-Long Beach-Anaheim, CA | 6,440 | 1.13 | 1.08 | $ 18.94 | $ 39,400 |
| Chicago-Naperville-Elgin, IL-IN-WI | 6,190 | 1.46 | 1.40 | $ 18.92 | $ 39,350 |
| Dallas-Fort Worth-Arlington, TX | 4,430 | 1.23 | 1.18 | $ 17.09 | $ 35,550 |
| Houston-The Woodlands-Sugar Land, TX | 3,710 | 1.28 | 1.23 | $ 16.37 | $ 34,050 |
| Philadelphia-Camden-Wilmington, PA-NJ-DE-MD | 3,500 | 1.32 | 1.26 | $ 18.70 | $ 38,900 |
| Miami-Fort Lauderdale-West Palm Beach, FL | 3,140 | 1.28 | 1.22 | $ 15.96 | $ 33,190 |
| Phoenix-Mesa-Scottsdale, AZ | 3,070 | 1.45 | 1.39 | $ 17.86 | $ 37,160 |
| Atlanta-Sandy Springs-Roswell, GA | 2,710 | 1.05 | 1.00 | $ 17.42 | $ 36,230 |
| Tampa-St. Petersburg-Clearwater, FL | 2,220 | 1.72 | 1.64 | $ 15.42 | $ 32,070 |
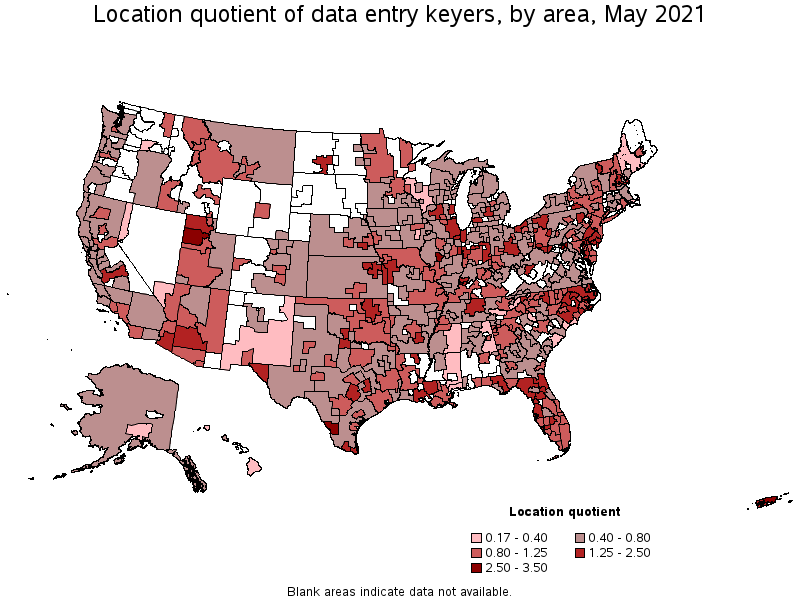
Metropolitan areas with the highest concentration of jobs and location quotients in Data Entry Keyers:
| Metropolitan area | Employment (1) | Employment per thousand jobs | Location quotient (9) | Hourly mean wage | Annual mean wage (2) |
|---|---|---|---|---|---|
| Springfield, IL | 350 | 3.60 | 3.45 | $ 17.00 | $ 35,370 |
| Laredo, TX | 320 | 3.29 | 3.15 | $ 12.88 | $ 26,800 |
| Hagerstown-Martinsburg, MD-WV | 300 | 3.10 | 2.97 | $ 15.18 | $ 31,570 |
| Salt Lake City, UT | 2,040 | 2.75 | 2.63 | $ 19.51 | $ 40,580 |
| Bismarck, ND | 180 | 2.53 | 2.42 | $ 16.69 | $ 34,710 |
| Ogden-Clearfield, UT | 650 | 2.43 | 2.33 | $ 15.59 | $ 32,420 |
| Lansing-East Lansing, MI | 470 | 2.40 | 2.30 | $ 16.01 | $ 33,290 |
| Lincoln, NE | 370 | 2.20 | 2.11 | $ 16.01 | $ 33,300 |
| Trenton, NJ | 480 | 2.12 | 2.03 | $ 19.47 | $ 40,500 |
| Milwaukee-Waukesha-West Allis, WI | 1,500 | 1.91 | 1.83 | $ 14.38 | $ 29,900 |
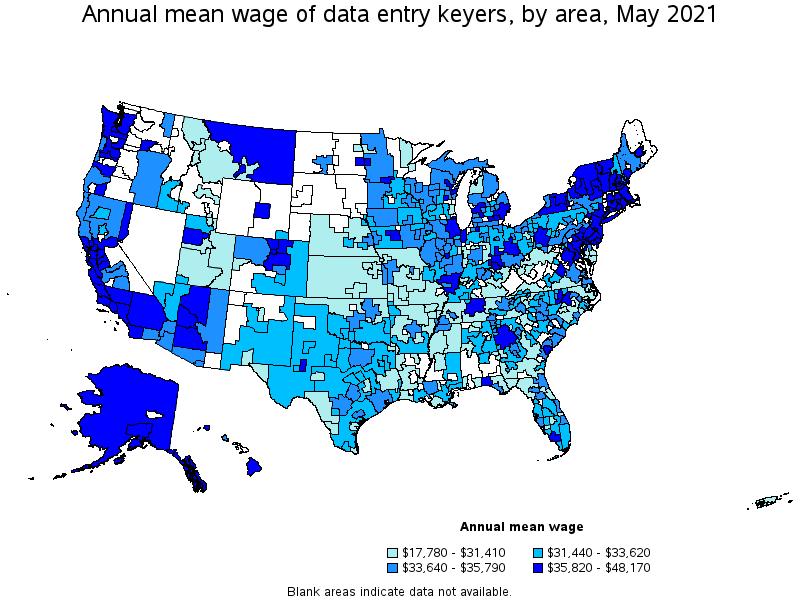
Top paying metropolitan areas for Data Entry Keyers:
| Metropolitan area | Employment (1) | Employment per thousand jobs | Location quotient (9) | Hourly mean wage | Annual mean wage (2) |
|---|---|---|---|---|---|
| San Jose-Sunnyvale-Santa Clara, CA | 850 | 0.80 | 0.77 | $ 23.16 | $ 48,170 |
| Olympia-Tumwater, WA | 140 | 1.28 | 1.23 | $ 22.36 | $ 46,500 |
| San Francisco-Oakland-Hayward, CA | 1,770 | 0.79 | 0.75 | $ 21.89 | $ 45,530 |
| Springfield, MA-CT | 250 | 0.82 | 0.79 | $ 20.90 | $ 43,460 |
| New Bedford, MA | 40 | 0.61 | 0.58 | $ 20.89 | $ 43,450 |
| Anchorage, AK | 50 | 0.30 | 0.29 | $ 20.83 | $ 43,330 |
| Kennewick-Richland, WA | 30 | 0.29 | 0.27 | $ 20.47 | $ 42,570 |
| Boston-Cambridge-Nashua, MA-NH | 1,370 | 0.53 | 0.51 | $ 20.33 | $ 42,280 |
| Napa, CA | 40 | 0.57 | 0.55 | $ 20.26 | $ 42,140 |
| Boulder, CO | 190 | 1.04 | 0.99 | $ 20.20 | $ 42,010 |
Nonmetropolitan areas with the highest employment in Data Entry Keyers:
| Nonmetropolitan area | Employment (1) | Employment per thousand jobs | Location quotient (9) | Hourly mean wage | Annual mean wage (2) |
|---|---|---|---|---|---|
| Southeast Coastal North Carolina nonmetropolitan area | 500 | 2.08 | 1.99 | $ 14.14 | $ 29,420 |
| Western Pennsylvania nonmetropolitan area | 280 | 2.03 | 1.94 | $ 15.53 | $ 32,300 |
| Central Indiana nonmetropolitan area | 240 | 1.58 | 1.51 | $ 14.68 | $ 30,520 |
| Kansas nonmetropolitan area | 230 | 0.62 | 0.59 | $ 14.91 | $ 31,010 |
| Piedmont North Carolina nonmetropolitan area | 230 | 0.93 | 0.89 | $ 15.22 | $ 31,650 |
Nonmetropolitan areas with the highest concentration of jobs and location quotients in Data Entry Keyers:
| Nonmetropolitan area | Employment (1) | Employment per thousand jobs | Location quotient (9) | Hourly mean wage | Annual mean wage (2) |
|---|---|---|---|---|---|
| Southeast Coastal North Carolina nonmetropolitan area | 500 | 2.08 | 1.99 | $ 14.14 | $ 29,420 |
| Western Pennsylvania nonmetropolitan area | 280 | 2.03 | 1.94 | $ 15.53 | $ 32,300 |
| Maryland nonmetropolitan area | 110 | 1.92 | 1.84 | $ 13.88 | $ 28,870 |
| Central Indiana nonmetropolitan area | 240 | 1.58 | 1.51 | $ 14.68 | $ 30,520 |
| Northeast Coastal North Carolina nonmetropolitan area | 140 | 1.56 | 1.49 | $ 14.72 | $ 30,610 |
Top paying nonmetropolitan areas for Data Entry Keyers:
| Nonmetropolitan area | Employment (1) | Employment per thousand jobs | Location quotient (9) | Hourly mean wage | Annual mean wage (2) |
|---|---|---|---|---|---|
| Western Washington nonmetropolitan area | 70 | 0.62 | 0.59 | $ 22.02 | $ 45,800 |
| Alaska nonmetropolitan area | 50 | 0.53 | 0.50 | $ 20.51 | $ 42,660 |
| East-Central Montana nonmetropolitan area | 40 | 0.62 | 0.59 | $ 19.98 | $ 41,560 |
| Hawaii / Kauai nonmetropolitan area | 30 | 0.34 | 0.33 | $ 19.52 | $ 40,610 |
| Capital/Northern New York nonmetropolitan area | 100 | 0.74 | 0.71 | $ 18.56 | $ 38,600 |
These estimates are calculated with data collected from employers in all industry sectors, all metropolitan and nonmetropolitan areas, and all states and the District of Columbia. The top employment and wage figures are provided above. The complete list is available in the downloadable XLS files.
The percentile wage estimate is the value of a wage below which a certain percent of workers fall. The median wage is the 50th percentile wage estimate—50 percent of workers earn less than the median and 50 percent of workers earn more than the median. More about percentile wages.
(1) Estimates for detailed occupations do not sum to the totals because the totals include occupations not shown separately. Estimates do not include self-employed workers.
(2) Annual wages have been calculated by multiplying the hourly mean wage by a "year-round, full-time" hours figure of 2,080 hours; for those occupations where there is not an hourly wage published, the annual wage has been directly calculated from the reported survey data.
(3) The relative standard error (RSE) is a measure of the reliability of a survey statistic. The smaller the relative standard error, the more precise the estimate.
(8) Estimate not released.
(9) The location quotient is the ratio of the area concentration of occupational employment to the national average concentration. A location quotient greater than one indicates the occupation has a higher share of employment than average, and a location quotient less than one indicates the occupation is less prevalent in the area than average.
Other OEWS estimates and related information:
May 2021 National Occupational Employment and Wage Estimates
May 2021 State Occupational Employment and Wage Estimates
May 2021 Metropolitan and Nonmetropolitan Area Occupational Employment and Wage Estimates
May 2021 National Industry-Specific Occupational Employment and Wage Estimates
Last Modified Date: March 31, 2022