
An official website of the United States government
An official website of the United States government
The .gov means it's official.
Federal government websites often end in .gov or .mil. Before sharing sensitive information,
make sure you're on a federal government site.
The site is secure.
The
https:// ensures that you are connecting to the official website and that any
information you provide is encrypted and transmitted securely.
Operate one or more of a variety of office machines, such as photocopying, photographic, and duplicating machines, or other office machines. Excludes �Billing and Posting Clerks� (43-3021) and �Mail Clerks and Mail Machine Operators, Except Postal Service� (43-9051).
Employment estimate and mean wage estimates for Office Machine Operators, Except Computer:
| Employment (1) | Employment RSE (3) |
Mean hourly wage |
Mean annual wage (2) |
Wage RSE (3) |
|---|---|---|---|---|
| 32,920 | 3.4 % | $ 17.84 | $ 37,110 | 0.6 % |
Percentile wage estimates for Office Machine Operators, Except Computer:
| Percentile | 10% | 25% | 50% (Median) |
75% | 90% |
|---|---|---|---|---|---|
| Hourly Wage | $ 12.50 | $ 14.34 | $ 17.61 | $ 19.92 | $ 23.32 |
| Annual Wage (2) | $ 26,000 | $ 29,820 | $ 36,630 | $ 41,420 | $ 48,500 |
Industries with the highest published employment and wages for Office Machine Operators, Except Computer are provided. For a list of all industries with employment in Office Machine Operators, Except Computer, see the Create Customized Tables function.
Industries with the highest levels of employment in Office Machine Operators, Except Computer:
| Industry | Employment (1) | Percent of industry employment | Hourly mean wage | Annual mean wage (2) |
|---|---|---|---|---|
| Business Support Services | 4,400 | 0.53 | $ 16.90 | $ 35,160 |
| Data Processing, Hosting, and Related Services | 3,560 | 0.94 | $ 15.12 | $ 31,450 |
| Credit Intermediation and Related Activities (5221 and 5223 only) | 2,210 | 0.11 | $ 18.15 | $ 37,760 |
| Employment Services | 1,380 | 0.04 | $ 15.70 | $ 32,660 |
| Insurance Carriers | 1,370 | 0.11 | $ 18.83 | $ 39,170 |
Industries with the highest concentration of employment in Office Machine Operators, Except Computer:
| Industry | Employment (1) | Percent of industry employment | Hourly mean wage | Annual mean wage (2) |
|---|---|---|---|---|
| Data Processing, Hosting, and Related Services | 3,560 | 0.94 | $ 15.12 | $ 31,450 |
| Business Support Services | 4,400 | 0.53 | $ 16.90 | $ 35,160 |
| Manufacturing and Reproducing Magnetic and Optical Media | 50 | 0.46 | $ 18.03 | $ 37,490 |
| Other Support Services | 550 | 0.20 | $ 13.43 | $ 27,920 |
| Professional and Commercial Equipment and Supplies Merchant Wholesalers | 1,040 | 0.16 | $ 17.78 | $ 36,980 |
Top paying industries for Office Machine Operators, Except Computer:
| Industry | Employment (1) | Percent of industry employment | Hourly mean wage | Annual mean wage (2) |
|---|---|---|---|---|
| Nonferrous Metal (except Aluminum) Production and Processing | 40 | 0.07 | $ 33.87 | $ 70,440 |
| Pharmaceutical and Medicine Manufacturing | 30 | 0.01 | $ 24.49 | $ 50,930 |
| Fabricated Metal Product Manufacturing (3321, 3322, 3325, 3326, and 3329 only) | 40 | 0.01 | $ 23.54 | $ 48,960 |
| Electronic Shopping and Mail-Order Houses | 390 | 0.09 | $ 22.20 | $ 46,180 |
| Local Government, excluding schools and hospitals (OEWS Designation) | 1,210 | 0.02 | $ 22.09 | $ 45,960 |
States and areas with the highest published employment, location quotients, and wages for Office Machine Operators, Except Computer are provided. For a list of all areas with employment in Office Machine Operators, Except Computer, see the Create Customized Tables function.
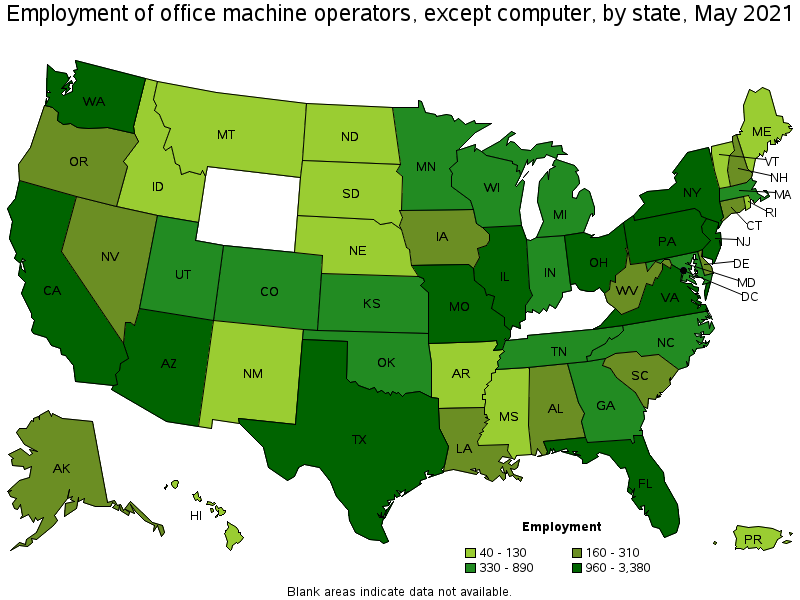
States with the highest employment level in Office Machine Operators, Except Computer:
| State | Employment (1) | Employment per thousand jobs | Location quotient (9) | Hourly mean wage | Annual mean wage (2) |
|---|---|---|---|---|---|
| Texas | 3,380 | 0.28 | 1.18 | $ 17.32 | $ 36,030 |
| New York | 2,920 | 0.34 | 1.44 | $ 19.79 | $ 41,170 |
| California | 2,550 | 0.15 | 0.66 | $ 19.87 | $ 41,330 |
| New Jersey | 1,630 | 0.42 | 1.81 | $ 18.04 | $ 37,530 |
| Pennsylvania | 1,620 | 0.29 | 1.24 | $ 16.15 | $ 33,590 |
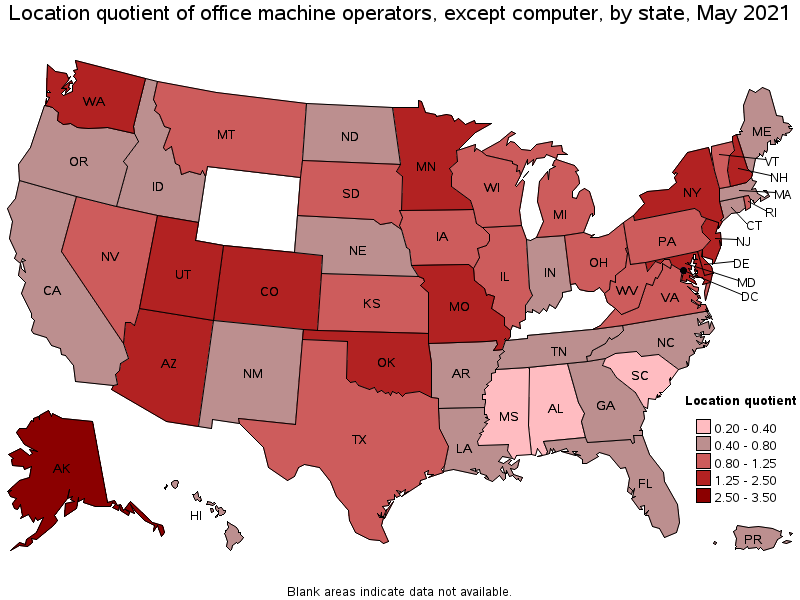
States with the highest concentration of jobs and location quotients in Office Machine Operators, Except Computer:
| State | Employment (1) | Employment per thousand jobs | Location quotient (9) | Hourly mean wage | Annual mean wage (2) |
|---|---|---|---|---|---|
| Alaska | 170 | 0.59 | 2.52 | $ 19.93 | $ 41,460 |
| Delaware | 230 | 0.52 | 2.21 | $ 19.05 | $ 39,620 |
| Missouri | 1,300 | 0.48 | 2.03 | $ 15.57 | $ 32,390 |
| Washington | 1,510 | 0.47 | 2.02 | $ 19.66 | $ 40,890 |
| New Hampshire | 290 | 0.45 | 1.94 | $ 15.90 | $ 33,060 |
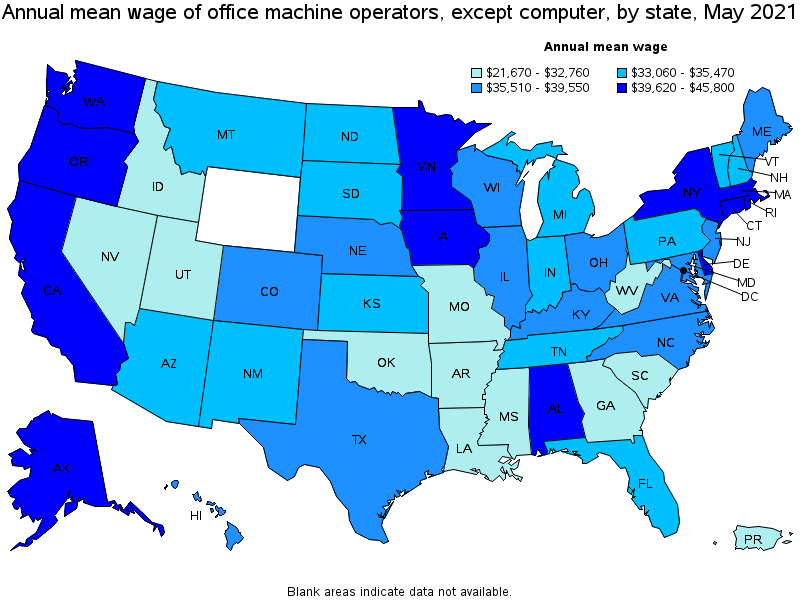
Top paying states for Office Machine Operators, Except Computer:
| State | Employment (1) | Employment per thousand jobs | Location quotient (9) | Hourly mean wage | Annual mean wage (2) |
|---|---|---|---|---|---|
| Connecticut | 230 | 0.15 | 0.62 | $ 22.02 | $ 45,800 |
| Oregon | 230 | 0.12 | 0.53 | $ 21.31 | $ 44,330 |
| District of Columbia | 270 | 0.41 | 1.77 | $ 21.12 | $ 43,930 |
| Rhode Island | 90 | 0.19 | 0.81 | $ 20.75 | $ 43,160 |
| Massachusetts | 470 | 0.14 | 0.59 | $ 20.39 | $ 42,420 |
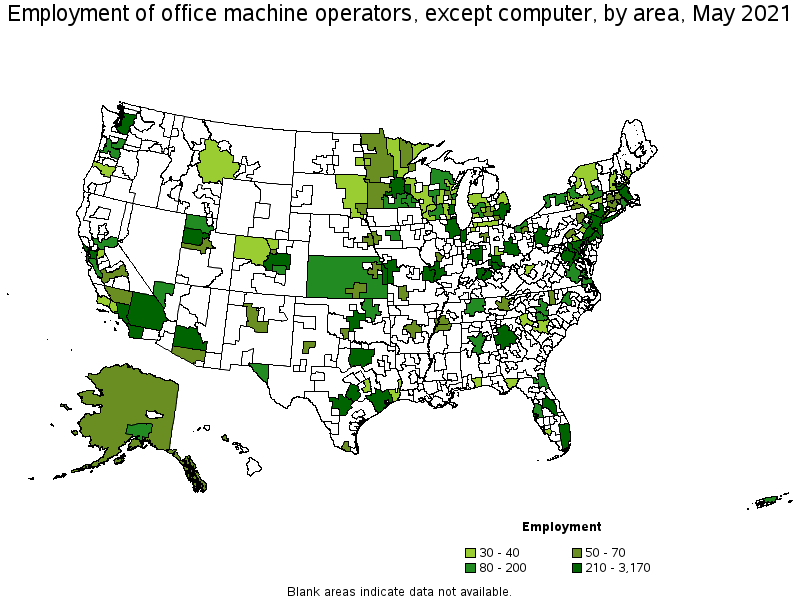
Metropolitan areas with the highest employment level in Office Machine Operators, Except Computer:
| Metropolitan area | Employment (1) | Employment per thousand jobs | Location quotient (9) | Hourly mean wage | Annual mean wage (2) |
|---|---|---|---|---|---|
| New York-Newark-Jersey City, NY-NJ-PA | 3,170 | 0.37 | 1.56 | $ 19.90 | $ 41,390 |
| Dallas-Fort Worth-Arlington, TX | 1,320 | 0.37 | 1.58 | $ 16.92 | $ 35,190 |
| Seattle-Tacoma-Bellevue, WA | 1,220 | 0.64 | 2.73 | $ 20.14 | $ 41,900 |
| Washington-Arlington-Alexandria, DC-VA-MD-WV | 1,070 | 0.36 | 1.56 | $ 19.47 | $ 40,490 |
| Philadelphia-Camden-Wilmington, PA-NJ-DE-MD | 1,040 | 0.39 | 1.67 | $ 17.42 | $ 36,230 |
| Chicago-Naperville-Elgin, IL-IN-WI | 950 | 0.22 | 0.96 | $ 18.47 | $ 38,410 |
| Los Angeles-Long Beach-Anaheim, CA | 940 | 0.16 | 0.70 | $ 18.92 | $ 39,360 |
| Phoenix-Mesa-Scottsdale, AZ | 840 | 0.40 | 1.71 | $ 16.43 | $ 34,180 |
| Houston-The Woodlands-Sugar Land, TX | 770 | 0.27 | 1.14 | $ 21.05 | $ 43,780 |
| St. Louis, MO-IL | 700 | 0.55 | 2.36 | $ 15.58 | $ 32,400 |
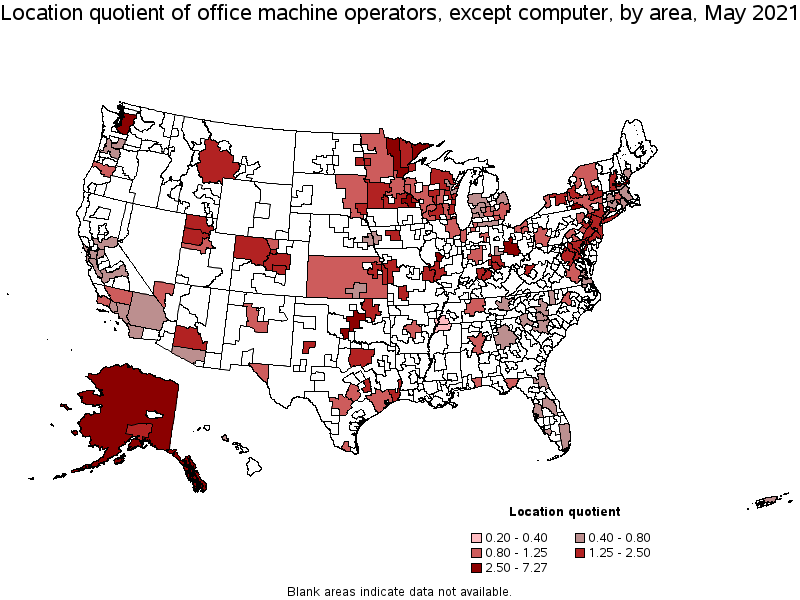
Metropolitan areas with the highest concentration of jobs and location quotients in Office Machine Operators, Except Computer:
| Metropolitan area | Employment (1) | Employment per thousand jobs | Location quotient (9) | Hourly mean wage | Annual mean wage (2) |
|---|---|---|---|---|---|
| Lawton, OK | 70 | 1.70 | 7.27 | $ 13.90 | $ 28,920 |
| Rochester, MN | 130 | 1.12 | 4.80 | $ 21.14 | $ 43,960 |
| Manchester, NH | 90 | 0.86 | 3.67 | $ 14.35 | $ 29,850 |
| Portsmouth, NH-ME | 70 | 0.74 | 3.17 | $ 17.85 | $ 37,130 |
| Seattle-Tacoma-Bellevue, WA | 1,220 | 0.64 | 2.73 | $ 20.14 | $ 41,900 |
| Binghamton, NY | 60 | 0.63 | 2.70 | $ 17.29 | $ 35,960 |
| Springfield, IL | 60 | 0.61 | 2.63 | $ 20.54 | $ 42,730 |
| Oklahoma City, OK | 360 | 0.59 | 2.53 | $ 13.77 | $ 28,650 |
| Columbus, OH | 600 | 0.59 | 2.53 | $ 18.63 | $ 38,760 |
| Sheboygan, WI | 30 | 0.55 | 2.36 | $ 18.92 | $ 39,360 |
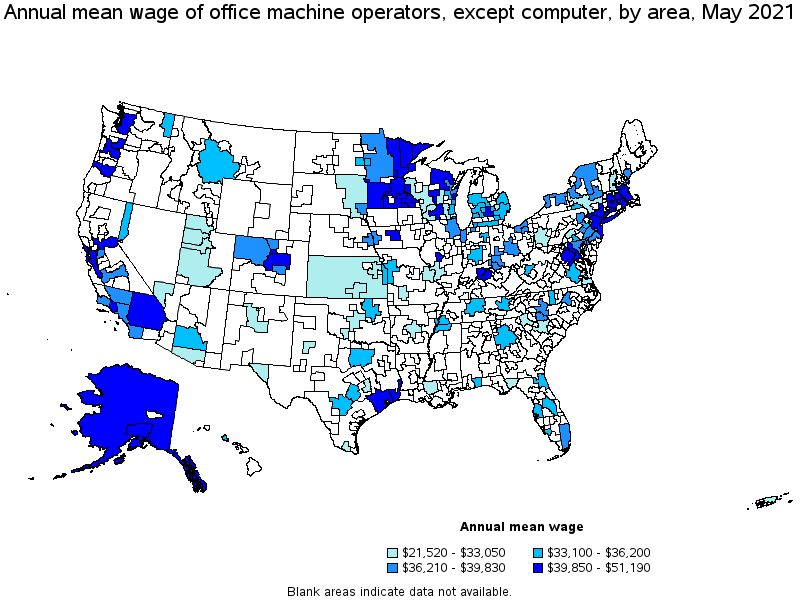
Top paying metropolitan areas for Office Machine Operators, Except Computer:
| Metropolitan area | Employment (1) | Employment per thousand jobs | Location quotient (9) | Hourly mean wage | Annual mean wage (2) |
|---|---|---|---|---|---|
| Beaumont-Port Arthur, TX | 40 | 0.29 | 1.25 | $ 24.61 | $ 51,190 |
| Bridgeport-Stamford-Norwalk, CT | 50 | 0.15 | 0.63 | $ 24.43 | $ 50,810 |
| San Jose-Sunnyvale-Santa Clara, CA | 150 | 0.14 | 0.60 | $ 23.13 | $ 48,110 |
| Eugene, OR | 40 | 0.27 | 1.17 | $ 23.03 | $ 47,900 |
| Hartford-West Hartford-East Hartford, CT | 70 | 0.13 | 0.57 | $ 22.11 | $ 45,980 |
| San Francisco-Oakland-Hayward, CA | 360 | 0.16 | 0.68 | $ 21.99 | $ 45,730 |
| New Haven, CT | 60 | 0.21 | 0.92 | $ 21.14 | $ 43,970 |
| Rochester, MN | 130 | 1.12 | 4.80 | $ 21.14 | $ 43,960 |
| Oxnard-Thousand Oaks-Ventura, CA | 40 | 0.15 | 0.65 | $ 21.07 | $ 43,830 |
| Houston-The Woodlands-Sugar Land, TX | 770 | 0.27 | 1.14 | $ 21.05 | $ 43,780 |
Nonmetropolitan areas with the highest employment in Office Machine Operators, Except Computer:
| Nonmetropolitan area | Employment (1) | Employment per thousand jobs | Location quotient (9) | Hourly mean wage | Annual mean wage (2) |
|---|---|---|---|---|---|
| Kansas nonmetropolitan area | 80 | 0.22 | 0.95 | $ 15.62 | $ 32,500 |
| Southeast Minnesota nonmetropolitan area | 80 | 0.53 | 2.28 | $ 20.77 | $ 43,210 |
| Northeastern Wisconsin nonmetropolitan area | 80 | 0.40 | 1.72 | $ 19.86 | $ 41,300 |
| Alaska nonmetropolitan area | 70 | 0.67 | 2.86 | $ 19.52 | $ 40,600 |
| Southwest Minnesota nonmetropolitan area | 50 | 0.46 | 1.95 | $ 21.49 | $ 44,690 |
Nonmetropolitan areas with the highest concentration of jobs and location quotients in Office Machine Operators, Except Computer:
| Nonmetropolitan area | Employment (1) | Employment per thousand jobs | Location quotient (9) | Hourly mean wage | Annual mean wage (2) |
|---|---|---|---|---|---|
| Northeast Minnesota nonmetropolitan area | 40 | 0.85 | 3.64 | $ 19.34 | $ 40,230 |
| Alaska nonmetropolitan area | 70 | 0.67 | 2.86 | $ 19.52 | $ 40,600 |
| Southeast Minnesota nonmetropolitan area | 80 | 0.53 | 2.28 | $ 20.77 | $ 43,210 |
| Southwest Minnesota nonmetropolitan area | 50 | 0.46 | 1.95 | $ 21.49 | $ 44,690 |
| Northeastern Wisconsin nonmetropolitan area | 80 | 0.40 | 1.72 | $ 19.86 | $ 41,300 |
Top paying nonmetropolitan areas for Office Machine Operators, Except Computer:
| Nonmetropolitan area | Employment (1) | Employment per thousand jobs | Location quotient (9) | Hourly mean wage | Annual mean wage (2) |
|---|---|---|---|---|---|
| Southwest Minnesota nonmetropolitan area | 50 | 0.46 | 1.95 | $ 21.49 | $ 44,690 |
| Southeast Minnesota nonmetropolitan area | 80 | 0.53 | 2.28 | $ 20.77 | $ 43,210 |
| Northeastern Wisconsin nonmetropolitan area | 80 | 0.40 | 1.72 | $ 19.86 | $ 41,300 |
| Alaska nonmetropolitan area | 70 | 0.67 | 2.86 | $ 19.52 | $ 40,600 |
| Northeast Minnesota nonmetropolitan area | 40 | 0.85 | 3.64 | $ 19.34 | $ 40,230 |
These estimates are calculated with data collected from employers in all industry sectors, all metropolitan and nonmetropolitan areas, and all states and the District of Columbia. The top employment and wage figures are provided above. The complete list is available in the downloadable XLS files.
The percentile wage estimate is the value of a wage below which a certain percent of workers fall. The median wage is the 50th percentile wage estimate—50 percent of workers earn less than the median and 50 percent of workers earn more than the median. More about percentile wages.
(1) Estimates for detailed occupations do not sum to the totals because the totals include occupations not shown separately. Estimates do not include self-employed workers.
(2) Annual wages have been calculated by multiplying the hourly mean wage by a "year-round, full-time" hours figure of 2,080 hours; for those occupations where there is not an hourly wage published, the annual wage has been directly calculated from the reported survey data.
(3) The relative standard error (RSE) is a measure of the reliability of a survey statistic. The smaller the relative standard error, the more precise the estimate.
(9) The location quotient is the ratio of the area concentration of occupational employment to the national average concentration. A location quotient greater than one indicates the occupation has a higher share of employment than average, and a location quotient less than one indicates the occupation is less prevalent in the area than average.
Other OEWS estimates and related information:
May 2021 National Occupational Employment and Wage Estimates
May 2021 State Occupational Employment and Wage Estimates
May 2021 Metropolitan and Nonmetropolitan Area Occupational Employment and Wage Estimates
May 2021 National Industry-Specific Occupational Employment and Wage Estimates
Last Modified Date: March 31, 2022