
An official website of the United States government
An official website of the United States government
The .gov means it's official.
Federal government websites often end in .gov or .mil. Before sharing sensitive information,
make sure you're on a federal government site.
The site is secure.
The
https:// ensures that you are connecting to the official website and that any
information you provide is encrypted and transmitted securely.
Drive and control equipment to support agricultural activities such as tilling soil; planting, cultivating, and harvesting crops; feeding and herding livestock; or removing animal waste. May perform tasks such as crop baling or hay bucking. May operate stationary equipment to perform post-harvest tasks such as husking, shelling, threshing, and ginning.
Employment estimate and mean wage estimates for Agricultural Equipment Operators:
| Employment (1) | Employment RSE (3) |
Mean hourly wage |
Mean annual wage (2) |
Wage RSE (3) |
|---|---|---|---|---|
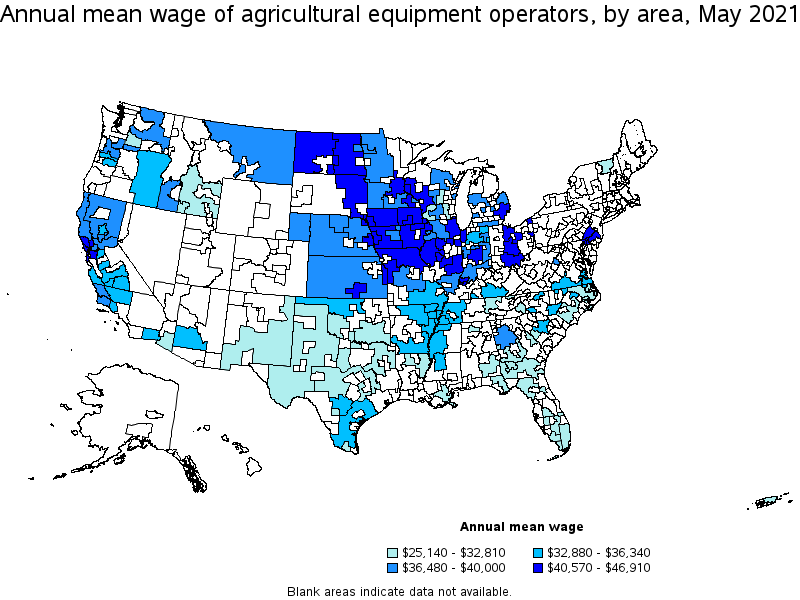
| 26,180 | 3.3 % | $ 17.44 | $ 36,280 | 0.9 % |
Percentile wage estimates for Agricultural Equipment Operators:
| Percentile | 10% | 25% | 50% (Median) |
75% | 90% |
|---|---|---|---|---|---|
| Hourly Wage | $ 12.26 | $ 14.20 | $ 17.48 | $ 19.39 | $ 22.86 |
| Annual Wage (2) | $ 25,490 | $ 29,540 | $ 36,360 | $ 40,330 | $ 47,540 |
Industries with the highest published employment and wages for Agricultural Equipment Operators are provided. For a list of all industries with employment in Agricultural Equipment Operators, see the Create Customized Tables function.
Industries with the highest levels of employment in Agricultural Equipment Operators:
| Industry | Employment (1) | Percent of industry employment | Hourly mean wage | Annual mean wage (2) |
|---|---|---|---|---|
| Support Activities for Crop Production | 14,640 | 4.36 | $ 16.56 | $ 34,430 |
| Merchant Wholesalers, Nondurable Goods (4241, 4247, and 4249 only) | 5,250 | 1.00 | $ 19.33 | $ 40,210 |
| Farm Product Raw Material Merchant Wholesalers | 1,950 | 2.86 | $ 18.84 | $ 39,190 |
| Employment Services | 350 | 0.01 | $ 17.51 | $ 36,420 |
| Scientific Research and Development Services | 330 | 0.04 | $ 17.41 | $ 36,220 |
Industries with the highest concentration of employment in Agricultural Equipment Operators:
| Industry | Employment (1) | Percent of industry employment | Hourly mean wage | Annual mean wage (2) |
|---|---|---|---|---|
| Support Activities for Crop Production | 14,640 | 4.36 | $ 16.56 | $ 34,430 |
| Farm Product Raw Material Merchant Wholesalers | 1,950 | 2.86 | $ 18.84 | $ 39,190 |
| Merchant Wholesalers, Nondurable Goods (4241, 4247, and 4249 only) | 5,250 | 1.00 | $ 19.33 | $ 40,210 |
| Support Activities for Animal Production | 220 | 0.69 | $ 15.98 | $ 33,230 |
| Grain and Oilseed Milling | 200 | 0.31 | $ 17.85 | $ 37,130 |
Top paying industries for Agricultural Equipment Operators:
| Industry | Employment (1) | Percent of industry employment | Hourly mean wage | Annual mean wage (2) |
|---|---|---|---|---|
| Real Estate | (8) | (8) | $ 20.76 | $ 43,190 |
| Colleges, Universities, and Professional Schools | 150 | 0.01 | $ 20.61 | $ 42,870 |
| Food and Beverage Stores (4451 and 4452 only) | (8) | (8) | $ 20.36 | $ 42,360 |
| Lawn and Garden Equipment and Supplies Stores | 200 | 0.11 | $ 20.19 | $ 41,990 |
| Beverage Manufacturing | 130 | 0.05 | $ 19.94 | $ 41,480 |
States and areas with the highest published employment, location quotients, and wages for Agricultural Equipment Operators are provided. For a list of all areas with employment in Agricultural Equipment Operators, see the Create Customized Tables function.
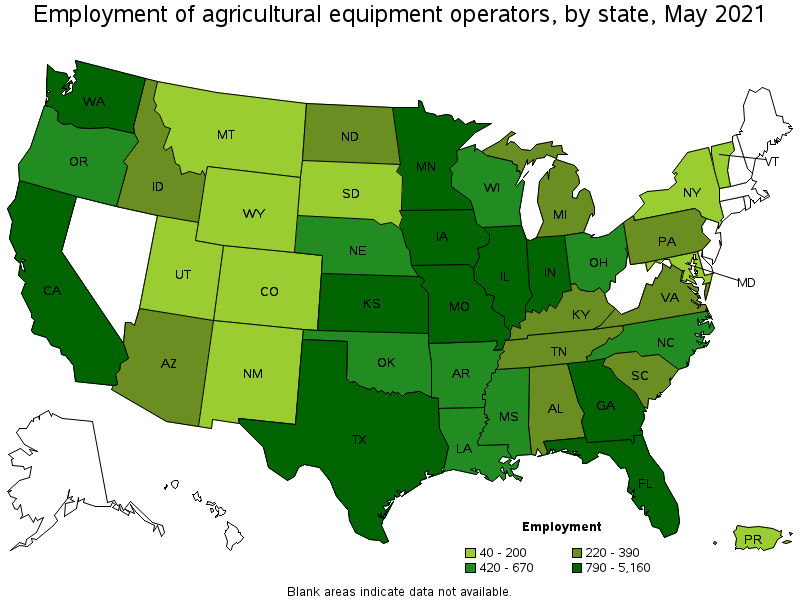
States with the highest employment level in Agricultural Equipment Operators:
| State | Employment (1) | Employment per thousand jobs | Location quotient (9) | Hourly mean wage | Annual mean wage (2) |
|---|---|---|---|---|---|
| California | 5,160 | 0.31 | 1.68 | $ 17.32 | $ 36,030 |
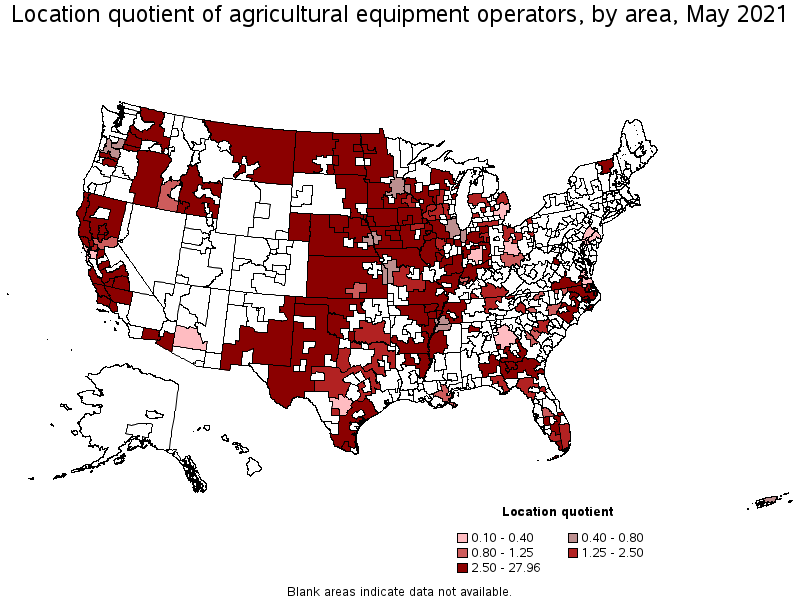
| Iowa | 2,050 | 1.38 | 7.44 | $ 19.41 | $ 40,370 |
| Texas | 1,630 | 0.13 | 0.72 | $ 15.06 | $ 31,320 |
| Florida | 1,610 | 0.19 | 1.01 | $ 14.68 | $ 30,540 |
| Illinois | 1,420 | 0.25 | 1.36 | $ 20.31 | $ 42,250 |
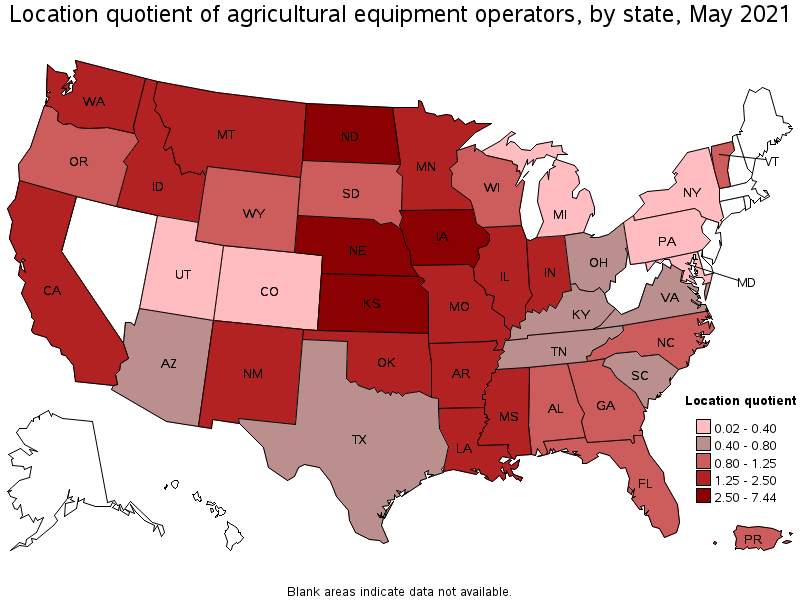
States with the highest concentration of jobs and location quotients in Agricultural Equipment Operators:
| State | Employment (1) | Employment per thousand jobs | Location quotient (9) | Hourly mean wage | Annual mean wage (2) |
|---|---|---|---|---|---|
| Iowa | 2,050 | 1.38 | 7.44 | $ 19.41 | $ 40,370 |
| North Dakota | 300 | 0.77 | 4.13 | $ 20.57 | $ 42,780 |
| Kansas | 960 | 0.72 | 3.88 | $ 19.06 | $ 39,640 |
| Nebraska | 530 | 0.56 | 2.99 | $ 18.06 | $ 37,550 |
| Mississippi | 490 | 0.44 | 2.39 | $ 16.13 | $ 33,540 |
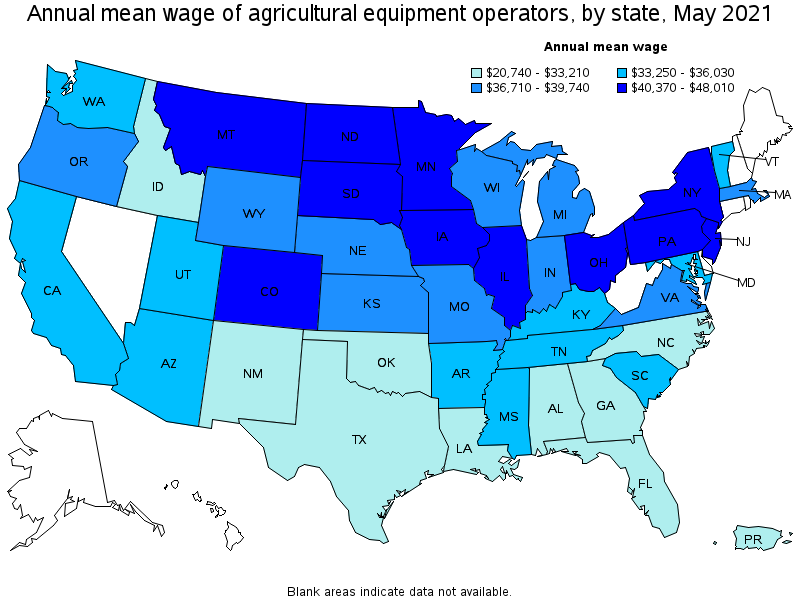
Top paying states for Agricultural Equipment Operators:
| State | Employment (1) | Employment per thousand jobs | Location quotient (9) | Hourly mean wage | Annual mean wage (2) |
|---|---|---|---|---|---|
| New Jersey | (8) | (8) | (8) | $ 23.08 | $ 48,010 |
| Colorado | 80 | 0.03 | 0.17 | $ 20.86 | $ 43,380 |
| South Dakota | 90 | 0.22 | 1.17 | $ 20.69 | $ 43,030 |
| Ohio | 580 | 0.11 | 0.60 | $ 20.64 | $ 42,920 |
| North Dakota | 300 | 0.77 | 4.13 | $ 20.57 | $ 42,780 |
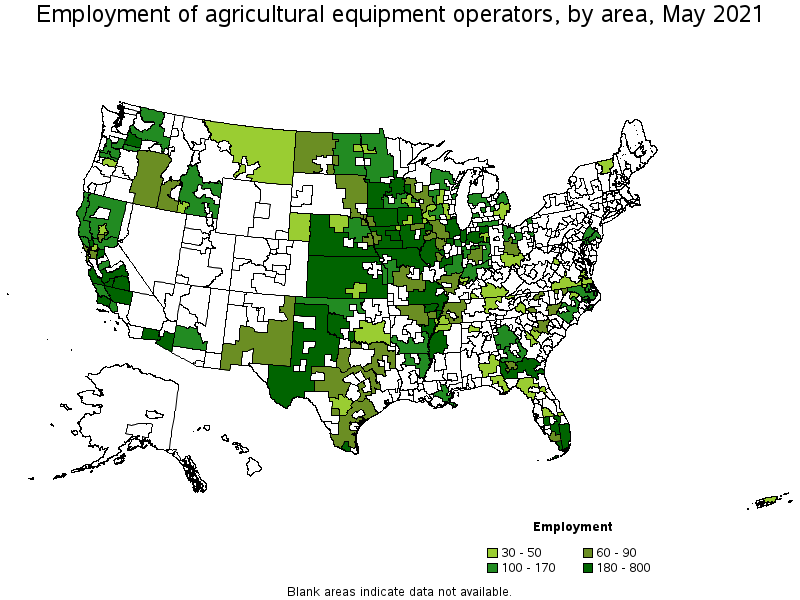
Metropolitan areas with the highest employment level in Agricultural Equipment Operators:
| Metropolitan area | Employment (1) | Employment per thousand jobs | Location quotient (9) | Hourly mean wage | Annual mean wage (2) |
|---|---|---|---|---|---|
| Salinas, CA | 670 | 3.97 | 21.37 | $ 16.59 | $ 34,500 |
| Miami-Fort Lauderdale-West Palm Beach, FL | 650 | 0.27 | 1.43 | $ 14.37 | $ 29,880 |
| Bakersfield, CA | 520 | 1.68 | 9.04 | $ 16.54 | $ 34,400 |
| Fresno, CA | 440 | 1.19 | 6.38 | $ 16.43 | $ 34,180 |
| Chicago-Naperville-Elgin, IL-IN-WI | 420 | 0.10 | 0.53 | $ 21.58 | $ 44,880 |
| Visalia-Porterville, CA | 400 | 2.67 | 14.34 | $ 16.34 | $ 33,990 |
| Des Moines-West Des Moines, IA | 330 | 0.92 | 4.95 | $ 17.67 | $ 36,740 |
| Napa, CA | 300 | 4.31 | 23.18 | $ 21.58 | $ 44,890 |
| Santa Maria-Santa Barbara, CA | 290 | 1.49 | 8.00 | $ 17.57 | $ 36,550 |
| Yakima, WA | 260 | 2.91 | 15.66 | $ 15.46 | $ 32,170 |
Metropolitan areas with the highest concentration of jobs and location quotients in Agricultural Equipment Operators:
| Metropolitan area | Employment (1) | Employment per thousand jobs | Location quotient (9) | Hourly mean wage | Annual mean wage (2) |
|---|---|---|---|---|---|
| Hanford-Corcoran, CA | 220 | 5.19 | 27.96 | $ 15.92 | $ 33,110 |
| Napa, CA | 300 | 4.31 | 23.18 | $ 21.58 | $ 44,890 |
| Salinas, CA | 670 | 3.97 | 21.37 | $ 16.59 | $ 34,500 |
| Yuma, AZ | 210 | 3.37 | 18.14 | $ 15.42 | $ 32,080 |
| El Centro, CA | 200 | 3.35 | 18.01 | $ 15.99 | $ 33,270 |
| Yakima, WA | 260 | 2.91 | 15.66 | $ 15.46 | $ 32,170 |
| Visalia-Porterville, CA | 400 | 2.67 | 14.34 | $ 16.34 | $ 33,990 |
| Merced, CA | 130 | 1.75 | 9.42 | $ 16.42 | $ 34,150 |
| Bakersfield, CA | 520 | 1.68 | 9.04 | $ 16.54 | $ 34,400 |
| Albany, GA | 90 | 1.57 | 8.44 | $ 15.02 | $ 31,250 |
Top paying metropolitan areas for Agricultural Equipment Operators:
| Metropolitan area | Employment (1) | Employment per thousand jobs | Location quotient (9) | Hourly mean wage | Annual mean wage (2) |
|---|---|---|---|---|---|
| Dubuque, IA | 30 | 0.59 | 3.17 | $ 21.85 | $ 45,450 |
| Wichita, KS | 50 | 0.19 | 1.03 | $ 21.80 | $ 45,340 |
| Kansas City, MO-KS | 130 | 0.13 | 0.71 | $ 21.75 | $ 45,240 |
| Napa, CA | 300 | 4.31 | 23.18 | $ 21.58 | $ 44,890 |
| Chicago-Naperville-Elgin, IL-IN-WI | 420 | 0.10 | 0.53 | $ 21.58 | $ 44,880 |
| Philadelphia-Camden-Wilmington, PA-NJ-DE-MD | 130 | 0.05 | 0.27 | $ 21.53 | $ 44,780 |
| Minneapolis-St. Paul-Bloomington, MN-WI | 180 | 0.10 | 0.54 | $ 21.44 | $ 44,600 |
| San Francisco-Oakland-Hayward, CA | 60 | 0.03 | 0.15 | $ 21.20 | $ 44,090 |
| Columbus, OH | 60 | 0.06 | 0.33 | $ 20.94 | $ 43,560 |
| Rochester, MN | 40 | 0.33 | 1.78 | $ 20.94 | $ 43,550 |
Nonmetropolitan areas with the highest employment in Agricultural Equipment Operators:
| Nonmetropolitan area | Employment (1) | Employment per thousand jobs | Location quotient (9) | Hourly mean wage | Annual mean wage (2) |
|---|---|---|---|---|---|
| Kansas nonmetropolitan area | 800 | 2.12 | 11.41 | $ 18.61 | $ 38,710 |
| West Texas Region of Texas nonmetropolitan area | 600 | 3.27 | 17.60 | $ 15.44 | $ 32,100 |
| Northwest Iowa nonmetropolitan area | 570 | 4.33 | 23.31 | $ 19.51 | $ 40,570 |
| Southeast Iowa nonmetropolitan area | 380 | 1.83 | 9.83 | $ 20.11 | $ 41,820 |
| Northwest Mississippi nonmetropolitan area | 310 | 3.58 | 19.28 | $ 15.91 | $ 33,090 |
Nonmetropolitan areas with the highest concentration of jobs and location quotients in Agricultural Equipment Operators:
| Nonmetropolitan area | Employment (1) | Employment per thousand jobs | Location quotient (9) | Hourly mean wage | Annual mean wage (2) |
|---|---|---|---|---|---|
| Northwest Iowa nonmetropolitan area | 570 | 4.33 | 23.31 | $ 19.51 | $ 40,570 |
| Northwest Mississippi nonmetropolitan area | 310 | 3.58 | 19.28 | $ 15.91 | $ 33,090 |
| South Florida nonmetropolitan area | 260 | 3.43 | 18.44 | $ 15.23 | $ 31,680 |
| West Texas Region of Texas nonmetropolitan area | 600 | 3.27 | 17.60 | $ 15.44 | $ 32,100 |
| East Arkansas nonmetropolitan area | 210 | 3.23 | 17.40 | $ 16.44 | $ 34,200 |
Top paying nonmetropolitan areas for Agricultural Equipment Operators:
| Nonmetropolitan area | Employment (1) | Employment per thousand jobs | Location quotient (9) | Hourly mean wage | Annual mean wage (2) |
|---|---|---|---|---|---|
| East North Dakota nonmetropolitan area | 110 | 1.74 | 9.34 | $ 22.55 | $ 46,910 |
| East Central Illinois nonmetropolitan area | 140 | 1.25 | 6.75 | $ 20.92 | $ 43,510 |
| East South Dakota nonmetropolitan area | 70 | 0.54 | 2.93 | $ 20.73 | $ 43,110 |
| West North Dakota nonmetropolitan area | 80 | 0.75 | 4.01 | $ 20.61 | $ 42,870 |
| Southern Ohio nonmetropolitan area | 30 | 0.22 | 1.18 | $ 20.60 | $ 42,850 |
These estimates are calculated with data collected from employers in all industry sectors, all metropolitan and nonmetropolitan areas, and all states and the District of Columbia. The top employment and wage figures are provided above. The complete list is available in the downloadable XLS files.
The percentile wage estimate is the value of a wage below which a certain percent of workers fall. The median wage is the 50th percentile wage estimate—50 percent of workers earn less than the median and 50 percent of workers earn more than the median. More about percentile wages.
(1) Estimates for detailed occupations do not sum to the totals because the totals include occupations not shown separately. Estimates do not include self-employed workers.
(2) Annual wages have been calculated by multiplying the hourly mean wage by a "year-round, full-time" hours figure of 2,080 hours; for those occupations where there is not an hourly wage published, the annual wage has been directly calculated from the reported survey data.
(3) The relative standard error (RSE) is a measure of the reliability of a survey statistic. The smaller the relative standard error, the more precise the estimate.
(8) Estimate not released.
(9) The location quotient is the ratio of the area concentration of occupational employment to the national average concentration. A location quotient greater than one indicates the occupation has a higher share of employment than average, and a location quotient less than one indicates the occupation is less prevalent in the area than average.
Other OEWS estimates and related information:
May 2021 National Occupational Employment and Wage Estimates
May 2021 State Occupational Employment and Wage Estimates
May 2021 Metropolitan and Nonmetropolitan Area Occupational Employment and Wage Estimates
May 2021 National Industry-Specific Occupational Employment and Wage Estimates
Last Modified Date: March 31, 2022