
An official website of the United States government
An official website of the United States government
The .gov means it's official.
Federal government websites often end in .gov or .mil. Before sharing sensitive information,
make sure you're on a federal government site.
The site is secure.
The
https:// ensures that you are connecting to the official website and that any
information you provide is encrypted and transmitted securely.
Construct, assemble, maintain, and repair stationary steam boilers and boiler house auxiliaries. Align structures or plate sections to assemble boiler frame tanks or vats, following blueprints. Work involves use of hand and power tools, plumb bobs, levels, wedges, dogs, or turnbuckles. Assist in testing assembled vessels. Direct cleaning of boilers and boiler furnaces. Inspect and repair boiler fittings, such as safety valves, regulators, automatic-control mechanisms, water columns, and auxiliary machines.
Employment estimate and mean wage estimates for Boilermakers:
| Employment (1) | Employment RSE (3) |
Mean hourly wage |
Mean annual wage (2) |
Wage RSE (3) |
|---|---|---|---|---|
| 12,920 | 5.7 % | $ 33.21 | $ 69,070 | 1.6 % |
Percentile wage estimates for Boilermakers:
| Percentile | 10% | 25% | 50% (Median) |
75% | 90% |
|---|---|---|---|---|---|
| Hourly Wage | $ 22.13 | $ 27.13 | $ 30.91 | $ 38.14 | $ 48.19 |
| Annual Wage (2) | $ 46,040 | $ 56,430 | $ 64,290 | $ 79,320 | $ 100,240 |
Industries with the highest published employment and wages for Boilermakers are provided. For a list of all industries with employment in Boilermakers, see the Create Customized Tables function.
Industries with the highest levels of employment in Boilermakers:
| Industry | Employment (1) | Percent of industry employment | Hourly mean wage | Annual mean wage (2) |
|---|---|---|---|---|
| Utility System Construction | 2,700 | 0.50 | $ 34.08 | $ 70,880 |
| Building Equipment Contractors | 2,620 | 0.12 | $ 33.51 | $ 69,690 |
| Nonresidential Building Construction | 2,390 | 0.31 | $ 39.15 | $ 81,440 |
| Fabricated Metal Product Manufacturing (3323 and 3324 only) | 710 | 0.15 | $ 26.88 | $ 55,910 |
| Commercial and Industrial Machinery and Equipment (except Automotive and Electronic) Repair and Maintenance | 620 | 0.30 | $ 30.91 | $ 64,290 |
Industries with the highest concentration of employment in Boilermakers:
| Industry | Employment (1) | Percent of industry employment | Hourly mean wage | Annual mean wage (2) |
|---|---|---|---|---|
| Metal Ore Mining | 210 | 0.51 | $ 28.28 | $ 58,820 |
| Utility System Construction | 2,700 | 0.50 | $ 34.08 | $ 70,880 |
| Nonresidential Building Construction | 2,390 | 0.31 | $ 39.15 | $ 81,440 |
| Commercial and Industrial Machinery and Equipment (except Automotive and Electronic) Repair and Maintenance | 620 | 0.30 | $ 30.91 | $ 64,290 |
| Fabricated Metal Product Manufacturing (3323 and 3324 only) | 710 | 0.15 | $ 26.88 | $ 55,910 |
Top paying industries for Boilermakers:
| Industry | Employment (1) | Percent of industry employment | Hourly mean wage | Annual mean wage (2) |
|---|---|---|---|---|
| Petroleum and Coal Products Manufacturing | 70 | 0.07 | $ 46.61 | $ 96,960 |
| Chemical Manufacturing (3251, 3252, 3253, and 3259 only) | 100 | 0.03 | $ 44.54 | $ 92,650 |
| Rail Transportation | 220 | 0.10 | $ 40.77 | $ 84,800 |
| Nonresidential Building Construction | 2,390 | 0.31 | $ 39.15 | $ 81,440 |
| Facilities Support Services | 60 | 0.04 | $ 36.29 | $ 75,480 |
States and areas with the highest published employment, location quotients, and wages for Boilermakers are provided. For a list of all areas with employment in Boilermakers, see the Create Customized Tables function.
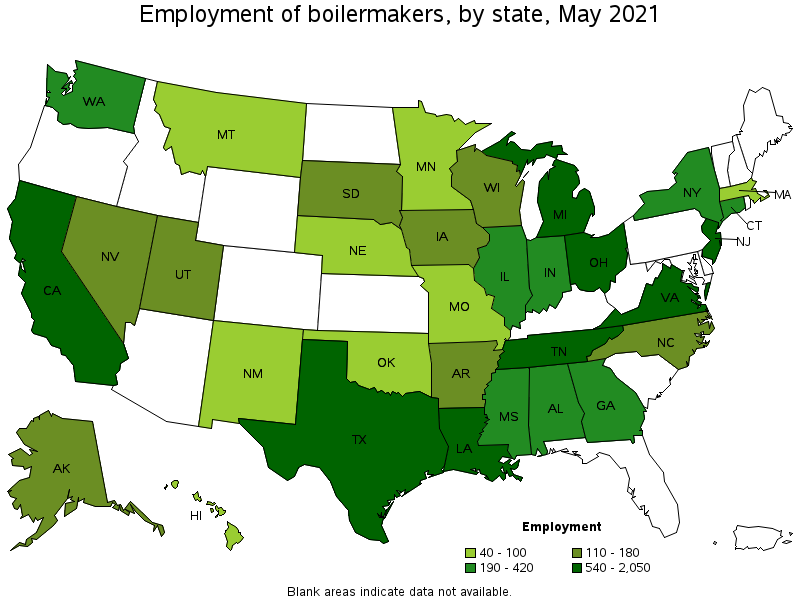
States with the highest employment level in Boilermakers:
| State | Employment (1) | Employment per thousand jobs | Location quotient (9) | Hourly mean wage | Annual mean wage (2) |
|---|---|---|---|---|---|
| Texas | 2,050 | 0.17 | 1.83 | $ 31.18 | $ 64,860 |
| Louisiana | 1,280 | 0.71 | 7.78 | $ 30.38 | $ 63,200 |
| Michigan | 970 | 0.24 | 2.60 | $ 35.05 | $ 72,890 |
| Ohio | 850 | 0.16 | 1.79 | $ 36.94 | $ 76,840 |
| California | 770 | 0.05 | 0.51 | $ 48.23 | $ 100,310 |
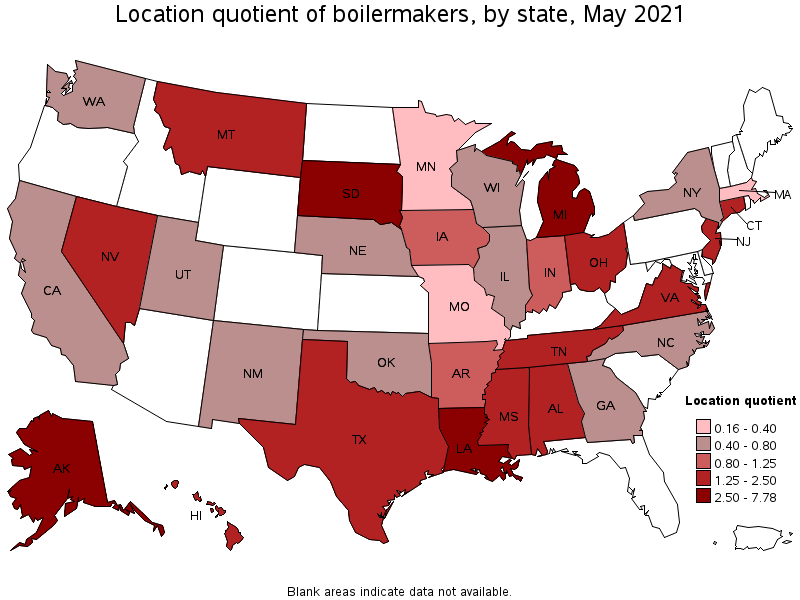
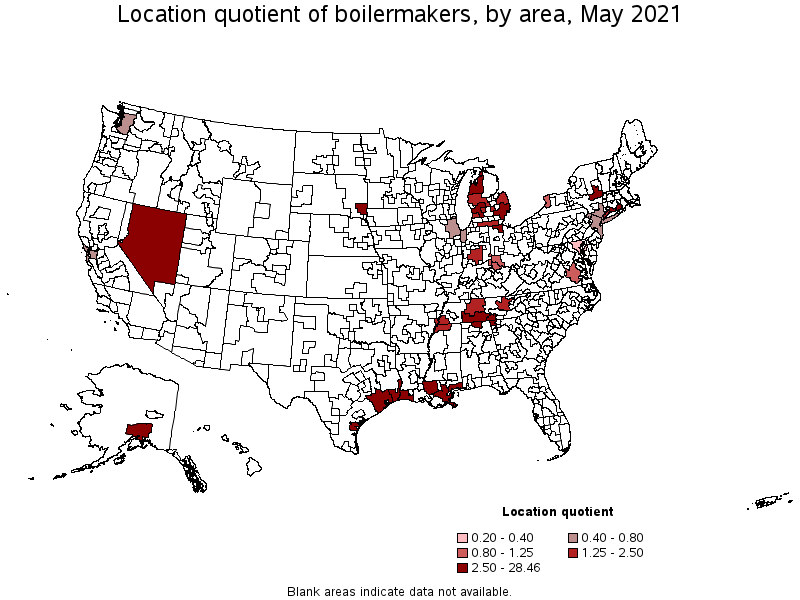
States with the highest concentration of jobs and location quotients in Boilermakers:
| State | Employment (1) | Employment per thousand jobs | Location quotient (9) | Hourly mean wage | Annual mean wage (2) |
|---|---|---|---|---|---|
| Louisiana | 1,280 | 0.71 | 7.78 | $ 30.38 | $ 63,200 |
| Alaska | 140 | 0.46 | 4.98 | $ 42.21 | $ 87,790 |
| South Dakota | 110 | 0.26 | 2.88 | $ 23.74 | $ 49,390 |
| Michigan | 970 | 0.24 | 2.60 | $ 35.05 | $ 72,890 |
| Tennessee | 540 | 0.18 | 1.99 | $ 28.88 | $ 60,080 |
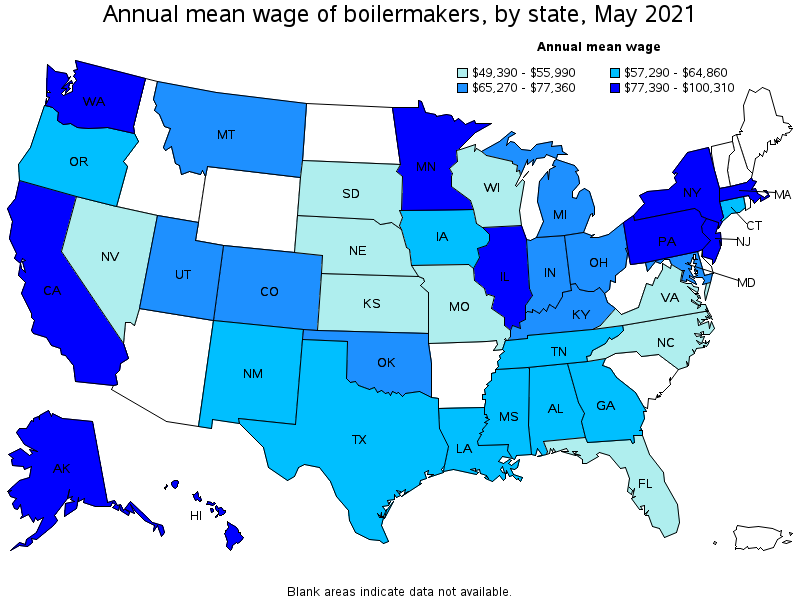
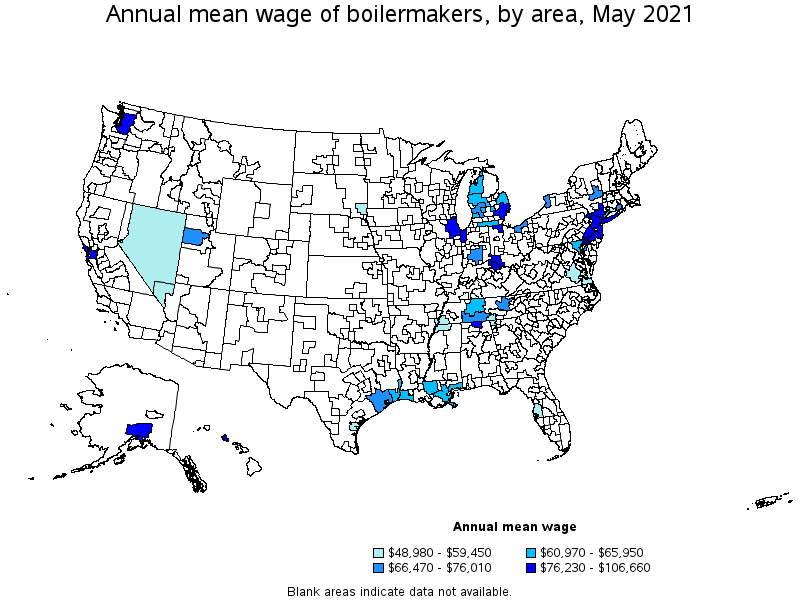
Top paying states for Boilermakers:
| State | Employment (1) | Employment per thousand jobs | Location quotient (9) | Hourly mean wage | Annual mean wage (2) |
|---|---|---|---|---|---|
| California | 770 | 0.05 | 0.51 | $ 48.23 | $ 100,310 |
| Illinois | 220 | 0.04 | 0.43 | $ 46.23 | $ 96,150 |
| Minnesota | 40 | 0.01 | 0.16 | $ 45.86 | $ 95,380 |
| Pennsylvania | (8) | (8) | (8) | $ 44.65 | $ 92,870 |
| Alaska | 140 | 0.46 | 4.98 | $ 42.21 | $ 87,790 |
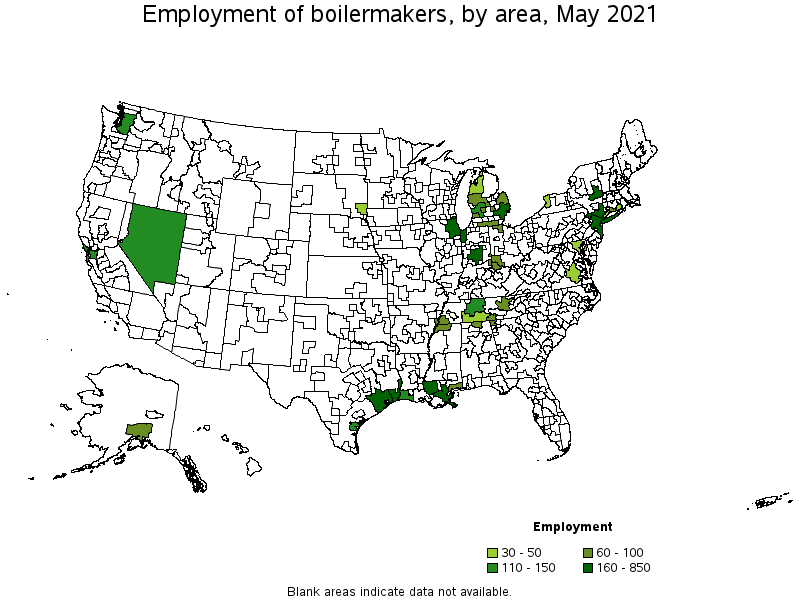
Metropolitan areas with the highest employment level in Boilermakers:
| Metropolitan area | Employment (1) | Employment per thousand jobs | Location quotient (9) | Hourly mean wage | Annual mean wage (2) |
|---|---|---|---|---|---|
| Houston-The Woodlands-Sugar Land, TX | 850 | 0.29 | 3.21 | $ 32.93 | $ 68,500 |
| Baton Rouge, LA | 680 | 1.86 | 20.32 | $ 31.71 | $ 65,950 |
| New York-Newark-Jersey City, NY-NJ-PA | 530 | 0.06 | 0.67 | $ 42.32 | $ 88,030 |
| Detroit-Warren-Dearborn, MI | 510 | 0.28 | 3.08 | $ 37.29 | $ 77,560 |
| Beaumont-Port Arthur, TX | 380 | 2.61 | 28.46 | $ 30.97 | $ 64,430 |
| Chicago-Naperville-Elgin, IL-IN-WI | 190 | 0.05 | 0.49 | $ 46.19 | $ 96,080 |
| New Orleans-Metairie, LA | 180 | 0.36 | 3.96 | $ 29.56 | $ 61,490 |
| Albany-Schenectady-Troy, NY | 160 | 0.37 | 4.08 | $ 36.55 | $ 76,010 |
| Indianapolis-Carmel-Anderson, IN | 160 | 0.15 | 1.68 | $ 35.38 | $ 73,590 |
| Grand Rapids-Wyoming, MI | 150 | 0.29 | 3.12 | $ 31.96 | $ 66,470 |
Metropolitan areas with the highest concentration of jobs and location quotients in Boilermakers:
| Metropolitan area | Employment (1) | Employment per thousand jobs | Location quotient (9) | Hourly mean wage | Annual mean wage (2) |
|---|---|---|---|---|---|
| Beaumont-Port Arthur, TX | 380 | 2.61 | 28.46 | $ 30.97 | $ 64,430 |
| Baton Rouge, LA | 680 | 1.86 | 20.32 | $ 31.71 | $ 65,950 |
| Lake Charles, LA | 110 | 1.24 | 13.52 | $ 30.36 | $ 63,140 |
| Corpus Christi, TX | 140 | 0.81 | 8.88 | $ 28.58 | $ 59,450 |
| Gulfport-Biloxi-Pascagoula, MS | 100 | 0.68 | 7.44 | $ 30.71 | $ 63,870 |
| Anchorage, AK | 100 | 0.62 | 6.75 | $ 40.57 | $ 84,380 |
| Huntsville, AL | 100 | 0.42 | 4.60 | $ 36.65 | $ 76,230 |
| Albany-Schenectady-Troy, NY | 160 | 0.37 | 4.08 | $ 36.55 | $ 76,010 |
| New Orleans-Metairie, LA | 180 | 0.36 | 3.96 | $ 29.56 | $ 61,490 |
| Norwich-New London-Westerly, CT-RI | 40 | 0.35 | 3.87 | $ 35.17 | $ 73,150 |
Top paying metropolitan areas for Boilermakers:
| Metropolitan area | Employment (1) | Employment per thousand jobs | Location quotient (9) | Hourly mean wage | Annual mean wage (2) |
|---|---|---|---|---|---|
| San Francisco-Oakland-Hayward, CA | 110 | 0.05 | 0.52 | $ 51.28 | $ 106,660 |
| Chicago-Naperville-Elgin, IL-IN-WI | 190 | 0.05 | 0.49 | $ 46.19 | $ 96,080 |
| Philadelphia-Camden-Wilmington, PA-NJ-DE-MD | (8) | (8) | (8) | $ 43.57 | $ 90,620 |
| New York-Newark-Jersey City, NY-NJ-PA | 530 | 0.06 | 0.67 | $ 42.32 | $ 88,030 |
| Anchorage, AK | 100 | 0.62 | 6.75 | $ 40.57 | $ 84,380 |
| Seattle-Tacoma-Bellevue, WA | 130 | 0.07 | 0.73 | $ 40.32 | $ 83,870 |
| Toledo, OH | 90 | 0.32 | 3.51 | $ 38.51 | $ 80,100 |
| Cincinnati, OH-KY-IN | 100 | 0.09 | 1.01 | $ 37.80 | $ 78,630 |
| Detroit-Warren-Dearborn, MI | 510 | 0.28 | 3.08 | $ 37.29 | $ 77,560 |
| Urban Honolulu, HI | (8) | (8) | (8) | $ 36.89 | $ 76,720 |
Nonmetropolitan areas with the highest employment in Boilermakers:
| Nonmetropolitan area | Employment (1) | Employment per thousand jobs | Location quotient (9) | Hourly mean wage | Annual mean wage (2) |
|---|---|---|---|---|---|
| Nevada nonmetropolitan area | 120 | 1.27 | 13.82 | $ 27.68 | $ 57,570 |
| Balance of Lower Peninsula of Michigan nonmetropolitan area | 60 | 0.22 | 2.39 | $ 29.73 | $ 61,830 |
| South Central Tennessee nonmetropolitan area | 40 | 0.39 | 4.22 | $ 33.05 | $ 68,730 |
| Northwest Lower Peninsula of Michigan nonmetropolitan area | 30 | 0.30 | 3.22 | $ 29.31 | $ 60,970 |
Nonmetropolitan areas with the highest concentration of jobs and location quotients in Boilermakers:
| Nonmetropolitan area | Employment (1) | Employment per thousand jobs | Location quotient (9) | Hourly mean wage | Annual mean wage (2) |
|---|---|---|---|---|---|
| Nevada nonmetropolitan area | 120 | 1.27 | 13.82 | $ 27.68 | $ 57,570 |
| South Central Tennessee nonmetropolitan area | 40 | 0.39 | 4.22 | $ 33.05 | $ 68,730 |
| Northwest Lower Peninsula of Michigan nonmetropolitan area | 30 | 0.30 | 3.22 | $ 29.31 | $ 60,970 |
| Balance of Lower Peninsula of Michigan nonmetropolitan area | 60 | 0.22 | 2.39 | $ 29.73 | $ 61,830 |
Top paying nonmetropolitan areas for Boilermakers:
| Nonmetropolitan area | Employment (1) | Employment per thousand jobs | Location quotient (9) | Hourly mean wage | Annual mean wage (2) |
|---|---|---|---|---|---|
| South Central Tennessee nonmetropolitan area | 40 | 0.39 | 4.22 | $ 33.05 | $ 68,730 |
| Balance of Lower Peninsula of Michigan nonmetropolitan area | 60 | 0.22 | 2.39 | $ 29.73 | $ 61,830 |
| Northwest Lower Peninsula of Michigan nonmetropolitan area | 30 | 0.30 | 3.22 | $ 29.31 | $ 60,970 |
| Nevada nonmetropolitan area | 120 | 1.27 | 13.82 | $ 27.68 | $ 57,570 |
These estimates are calculated with data collected from employers in all industry sectors, all metropolitan and nonmetropolitan areas, and all states and the District of Columbia. The top employment and wage figures are provided above. The complete list is available in the downloadable XLS files.
The percentile wage estimate is the value of a wage below which a certain percent of workers fall. The median wage is the 50th percentile wage estimate—50 percent of workers earn less than the median and 50 percent of workers earn more than the median. More about percentile wages.
(1) Estimates for detailed occupations do not sum to the totals because the totals include occupations not shown separately. Estimates do not include self-employed workers.
(2) Annual wages have been calculated by multiplying the hourly mean wage by a "year-round, full-time" hours figure of 2,080 hours; for those occupations where there is not an hourly wage published, the annual wage has been directly calculated from the reported survey data.
(3) The relative standard error (RSE) is a measure of the reliability of a survey statistic. The smaller the relative standard error, the more precise the estimate.
(8) Estimate not released.
(9) The location quotient is the ratio of the area concentration of occupational employment to the national average concentration. A location quotient greater than one indicates the occupation has a higher share of employment than average, and a location quotient less than one indicates the occupation is less prevalent in the area than average.
Other OEWS estimates and related information:
May 2021 National Occupational Employment and Wage Estimates
May 2021 State Occupational Employment and Wage Estimates
May 2021 Metropolitan and Nonmetropolitan Area Occupational Employment and Wage Estimates
May 2021 National Industry-Specific Occupational Employment and Wage Estimates
Last Modified Date: March 31, 2022