
An official website of the United States government
An official website of the United States government
The .gov means it's official.
Federal government websites often end in .gov or .mil. Before sharing sensitive information,
make sure you're on a federal government site.
The site is secure.
The
https:// ensures that you are connecting to the official website and that any
information you provide is encrypted and transmitted securely.
Construct, erect, install, or repair structures and fixtures made of wood and comparable materials, such as concrete forms; building frameworks, including partitions, joists, studding, and rafters; and wood stairways, window and door frames, and hardwood floors. May also install cabinets, siding, drywall, and batt or roll insulation. Includes brattice builders who build doors or brattices (ventilation walls or partitions) in underground passageways.
Employment estimate and mean wage estimates for Carpenters:
| Employment (1) | Employment RSE (3) |
Mean hourly wage |
Mean annual wage (2) |
Wage RSE (3) |
|---|---|---|---|---|
| 668,060 | 1.0 % | $ 26.53 | $ 55,190 | 0.5 % |
Percentile wage estimates for Carpenters:
| Percentile | 10% | 25% | 50% (Median) |
75% | 90% |
|---|---|---|---|---|---|
| Hourly Wage | $ 15.33 | $ 18.38 | $ 23.20 | $ 29.80 | $ 38.92 |
| Annual Wage (2) | $ 31,880 | $ 38,240 | $ 48,260 | $ 61,980 | $ 80,940 |
Industries with the highest published employment and wages for Carpenters are provided. For a list of all industries with employment in Carpenters, see the Create Customized Tables function.
Industries with the highest levels of employment in Carpenters:
| Industry | Employment (1) | Percent of industry employment | Hourly mean wage | Annual mean wage (2) |
|---|---|---|---|---|
| Residential Building Construction | 209,480 | 24.92 | $ 24.94 | $ 51,880 |
| Building Finishing Contractors | 112,370 | 13.89 | $ 27.59 | $ 57,390 |
| Nonresidential Building Construction | 110,540 | 14.20 | $ 29.84 | $ 62,060 |
| Foundation, Structure, and Building Exterior Contractors | 95,230 | 10.20 | $ 26.39 | $ 54,900 |
| Employment Services | 15,120 | 0.43 | $ 22.03 | $ 45,820 |
Industries with the highest concentration of employment in Carpenters:
| Industry | Employment (1) | Percent of industry employment | Hourly mean wage | Annual mean wage (2) |
|---|---|---|---|---|
| Residential Building Construction | 209,480 | 24.92 | $ 24.94 | $ 51,880 |
| Nonresidential Building Construction | 110,540 | 14.20 | $ 29.84 | $ 62,060 |
| Building Finishing Contractors | 112,370 | 13.89 | $ 27.59 | $ 57,390 |
| Foundation, Structure, and Building Exterior Contractors | 95,230 | 10.20 | $ 26.39 | $ 54,900 |
| Other Wood Product Manufacturing | 9,910 | 4.24 | $ 18.99 | $ 39,500 |
Top paying industries for Carpenters:
| Industry | Employment (1) | Percent of industry employment | Hourly mean wage | Annual mean wage (2) |
|---|---|---|---|---|
| Electric Power Generation, Transmission and Distribution | 30 | 0.01 | $ 41.57 | $ 86,460 |
| Specialty (except Psychiatric and Substance Abuse) Hospitals | 60 | 0.02 | $ 38.58 | $ 80,240 |
| Aerospace Product and Parts Manufacturing | 90 | 0.02 | $ 37.93 | $ 78,890 |
| Educational Support Services | 130 | 0.07 | $ 36.21 | $ 75,320 |
| Motion Picture and Video Industries | 510 | 0.16 | $ 36.08 | $ 75,040 |
States and areas with the highest published employment, location quotients, and wages for Carpenters are provided. For a list of all areas with employment in Carpenters, see the Create Customized Tables function.
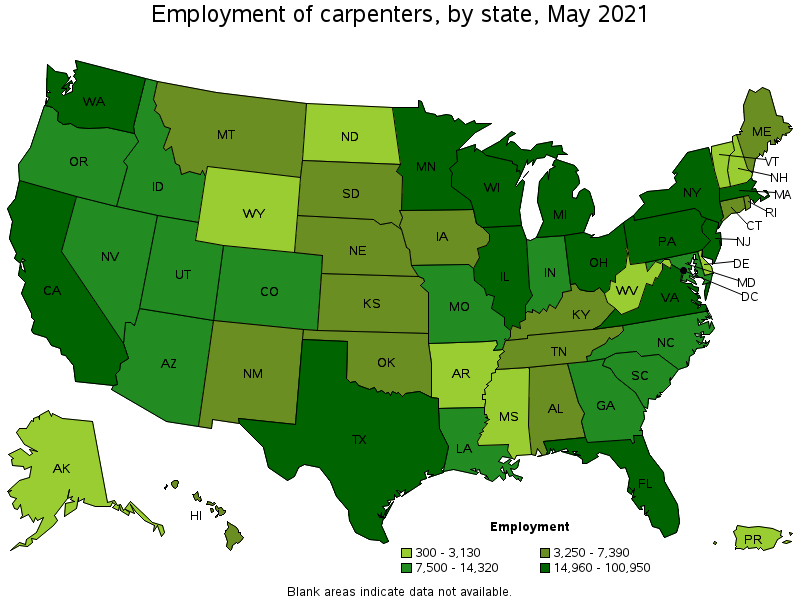
States with the highest employment level in Carpenters:
| State | Employment (1) | Employment per thousand jobs | Location quotient (9) | Hourly mean wage | Annual mean wage (2) |
|---|---|---|---|---|---|
| California | 100,950 | 6.11 | 1.29 | $ 31.57 | $ 65,670 |
| Florida | 45,040 | 5.23 | 1.10 | $ 21.14 | $ 43,980 |
| New York | 41,290 | 4.76 | 1.00 | $ 31.94 | $ 66,420 |
| Texas | 33,510 | 2.74 | 0.58 | $ 21.52 | $ 44,760 |
| Pennsylvania | 27,560 | 4.94 | 1.04 | $ 25.71 | $ 53,470 |
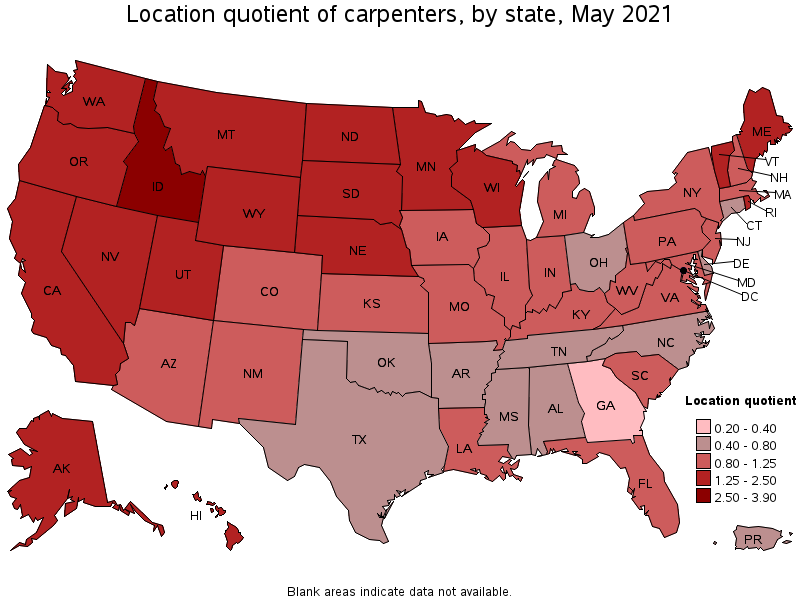
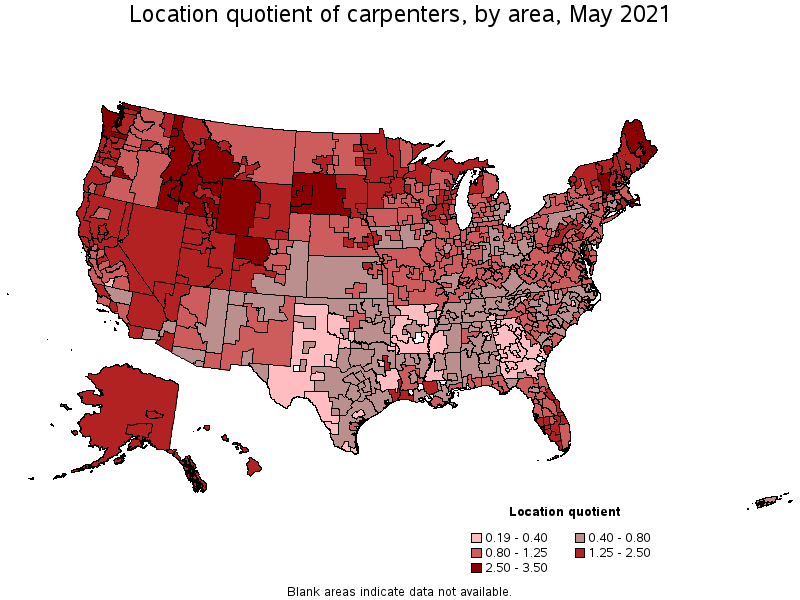
States with the highest concentration of jobs and location quotients in Carpenters:
| State | Employment (1) | Employment per thousand jobs | Location quotient (9) | Hourly mean wage | Annual mean wage (2) |
|---|---|---|---|---|---|
| Idaho | 9,120 | 12.04 | 2.54 | $ 20.09 | $ 41,780 |
| Hawaii | 5,670 | 10.34 | 2.18 | $ 38.08 | $ 79,200 |
| South Dakota | 4,270 | 10.13 | 2.14 | $ 19.36 | $ 40,260 |
| Wyoming | 2,580 | 9.91 | 2.09 | $ 25.45 | $ 52,930 |
| Vermont | 2,730 | 9.62 | 2.03 | $ 24.21 | $ 50,350 |
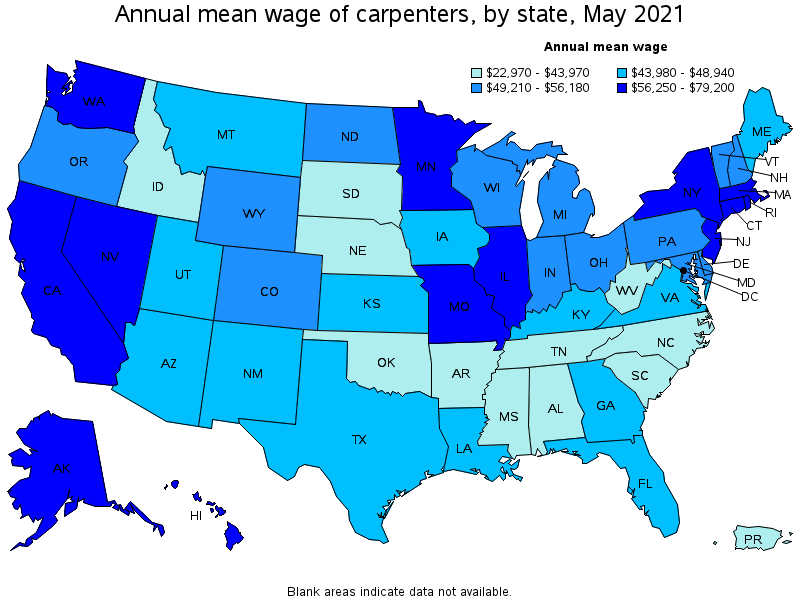
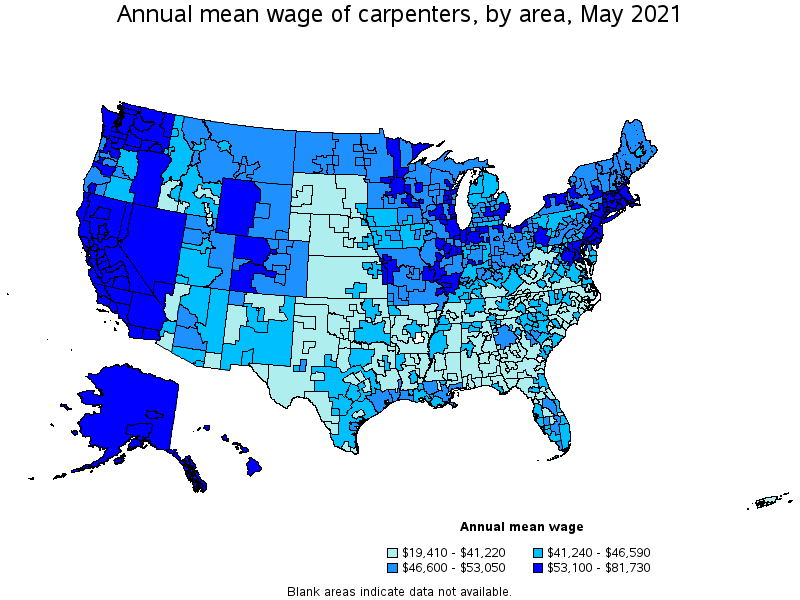
Top paying states for Carpenters:
| State | Employment (1) | Employment per thousand jobs | Location quotient (9) | Hourly mean wage | Annual mean wage (2) |
|---|---|---|---|---|---|
| Hawaii | 5,670 | 10.34 | 2.18 | $ 38.08 | $ 79,200 |
| New Jersey | 14,960 | 3.89 | 0.82 | $ 34.40 | $ 71,550 |
| Alaska | 2,280 | 7.71 | 1.63 | $ 32.78 | $ 68,180 |
| Illinois | 22,840 | 4.06 | 0.86 | $ 31.99 | $ 66,530 |
| New York | 41,290 | 4.76 | 1.00 | $ 31.94 | $ 66,420 |
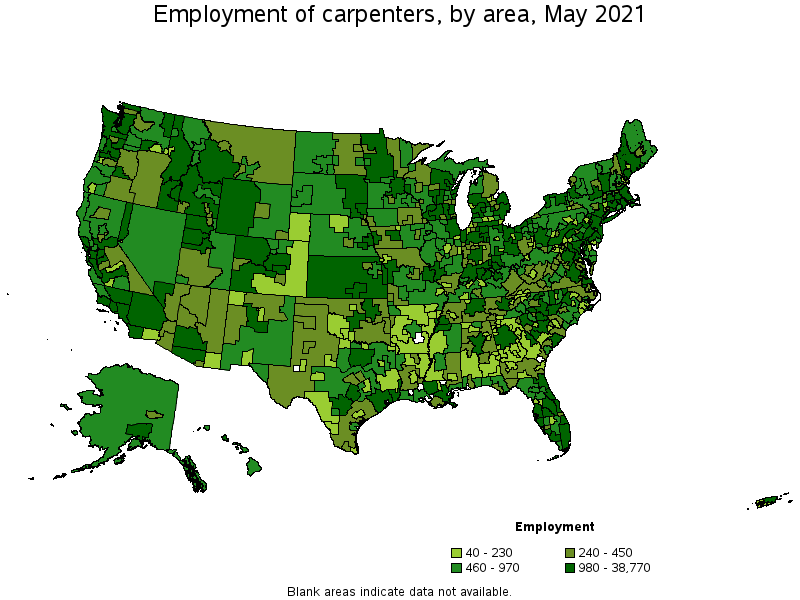
Metropolitan areas with the highest employment level in Carpenters:
| Metropolitan area | Employment (1) | Employment per thousand jobs | Location quotient (9) | Hourly mean wage | Annual mean wage (2) |
|---|---|---|---|---|---|
| New York-Newark-Jersey City, NY-NJ-PA | 38,770 | 4.47 | 0.94 | $ 34.58 | $ 71,930 |
| Los Angeles-Long Beach-Anaheim, CA | 29,570 | 5.17 | 1.09 | $ 30.58 | $ 63,610 |
| Chicago-Naperville-Elgin, IL-IN-WI | 16,550 | 3.91 | 0.82 | $ 33.35 | $ 69,370 |
| Seattle-Tacoma-Bellevue, WA | 15,260 | 7.96 | 1.68 | $ 33.71 | $ 70,110 |
| Riverside-San Bernardino-Ontario, CA | 14,930 | 9.76 | 2.06 | $ 28.56 | $ 59,400 |
| Boston-Cambridge-Nashua, MA-NH | 12,980 | 5.02 | 1.06 | $ 32.40 | $ 67,390 |
| San Francisco-Oakland-Hayward, CA | 12,940 | 5.77 | 1.22 | $ 37.64 | $ 78,280 |
| Miami-Fort Lauderdale-West Palm Beach, FL | 12,590 | 5.13 | 1.08 | $ 22.13 | $ 46,020 |
| Washington-Arlington-Alexandria, DC-VA-MD-WV | 12,050 | 4.11 | 0.87 | $ 26.98 | $ 56,120 |
| Minneapolis-St. Paul-Bloomington, MN-WI | 11,700 | 6.42 | 1.35 | $ 29.06 | $ 60,450 |
Metropolitan areas with the highest concentration of jobs and location quotients in Carpenters:
| Metropolitan area | Employment (1) | Employment per thousand jobs | Location quotient (9) | Hourly mean wage | Annual mean wage (2) |
|---|---|---|---|---|---|
| Coeur d'Alene, ID | 940 | 14.36 | 3.03 | $ 20.55 | $ 42,750 |
| Rapid City, SD | 920 | 13.75 | 2.90 | $ 19.29 | $ 40,120 |
| Barnstable Town, MA | 1,300 | 13.46 | 2.84 | $ 27.40 | $ 57,000 |
| Bend-Redmond, OR | 1,090 | 13.06 | 2.75 | $ 24.28 | $ 50,510 |
| Boise City, ID | 4,320 | 12.69 | 2.68 | $ 19.72 | $ 41,030 |
| Bellingham, WA | 980 | 11.92 | 2.51 | $ 31.31 | $ 65,130 |
| St. George, UT | 830 | 11.00 | 2.32 | $ 21.36 | $ 44,430 |
| Santa Rosa, CA | 2,100 | 10.92 | 2.30 | $ 35.07 | $ 72,940 |
| Bremerton-Silverdale, WA | 930 | 10.73 | 2.26 | $ 29.05 | $ 60,420 |
| Longview, TX | 960 | 10.68 | 2.25 | $ 20.49 | $ 42,620 |
Top paying metropolitan areas for Carpenters:
| Metropolitan area | Employment (1) | Employment per thousand jobs | Location quotient (9) | Hourly mean wage | Annual mean wage (2) |
|---|---|---|---|---|---|
| Urban Honolulu, HI | 4,050 | 10.26 | 2.16 | $ 39.29 | $ 81,730 |
| San Jose-Sunnyvale-Santa Clara, CA | 4,750 | 4.45 | 0.94 | $ 37.83 | $ 78,680 |
| San Francisco-Oakland-Hayward, CA | 12,940 | 5.77 | 1.22 | $ 37.64 | $ 78,280 |
| Kahului-Wailuku-Lahaina, HI | 670 | 10.49 | 2.21 | $ 36.69 | $ 76,320 |
| Santa Rosa, CA | 2,100 | 10.92 | 2.30 | $ 35.07 | $ 72,940 |
| New York-Newark-Jersey City, NY-NJ-PA | 38,770 | 4.47 | 0.94 | $ 34.58 | $ 71,930 |
| Vallejo-Fairfield, CA | 750 | 5.76 | 1.21 | $ 34.37 | $ 71,490 |
| Anchorage, AK | 1,190 | 7.38 | 1.56 | $ 34.05 | $ 70,820 |
| Trenton, NJ | 510 | 2.23 | 0.47 | $ 33.96 | $ 70,640 |
| Seattle-Tacoma-Bellevue, WA | 15,260 | 7.96 | 1.68 | $ 33.71 | $ 70,110 |
Nonmetropolitan areas with the highest employment in Carpenters:
| Nonmetropolitan area | Employment (1) | Employment per thousand jobs | Location quotient (9) | Hourly mean wage | Annual mean wage (2) |
|---|---|---|---|---|---|
| Southwest Maine nonmetropolitan area | 1,980 | 10.83 | 2.28 | $ 22.85 | $ 47,520 |
| Southwest Montana nonmetropolitan area | 1,660 | 12.00 | 2.53 | $ 24.81 | $ 51,600 |
| Western Washington nonmetropolitan area | 1,460 | 12.19 | 2.57 | $ 29.29 | $ 60,930 |
| Northwest Minnesota nonmetropolitan area | 1,450 | 7.96 | 1.68 | $ 23.39 | $ 48,660 |
| Northwest Colorado nonmetropolitan area | 1,390 | 11.93 | 2.52 | $ 27.07 | $ 56,300 |
Nonmetropolitan areas with the highest concentration of jobs and location quotients in Carpenters:
| Nonmetropolitan area | Employment (1) | Employment per thousand jobs | Location quotient (9) | Hourly mean wage | Annual mean wage (2) |
|---|---|---|---|---|---|
| Northwestern Idaho nonmetropolitan area | 1,080 | 15.49 | 3.27 | $ 20.63 | $ 42,900 |
| Western Wyoming nonmetropolitan area | 1,270 | 13.48 | 2.84 | $ 26.87 | $ 55,900 |
| Southeast-Central Idaho nonmetropolitan area | 1,110 | 12.83 | 2.71 | $ 21.53 | $ 44,790 |
| West South Dakota nonmetropolitan area | 760 | 12.75 | 2.69 | $ 18.46 | $ 38,400 |
| Southern Vermont nonmetropolitan area | 1,210 | 12.58 | 2.65 | $ 24.09 | $ 50,120 |
Top paying nonmetropolitan areas for Carpenters:
| Nonmetropolitan area | Employment (1) | Employment per thousand jobs | Location quotient (9) | Hourly mean wage | Annual mean wage (2) |
|---|---|---|---|---|---|
| Hawaii / Kauai nonmetropolitan area | 940 | 10.62 | 2.24 | $ 33.85 | $ 70,410 |
| North Coast Region of California nonmetropolitan area | 760 | 7.64 | 1.61 | $ 31.64 | $ 65,810 |
| North Valley-Northern Mountains Region of California nonmetropolitan area | 920 | 9.41 | 1.98 | $ 31.14 | $ 64,770 |
| Connecticut nonmetropolitan area | 130 | 4.11 | 0.87 | $ 30.60 | $ 63,650 |
| Alaska nonmetropolitan area | 790 | 8.12 | 1.71 | $ 30.54 | $ 63,530 |
These estimates are calculated with data collected from employers in all industry sectors, all metropolitan and nonmetropolitan areas, and all states and the District of Columbia. The top employment and wage figures are provided above. The complete list is available in the downloadable XLS files.
The percentile wage estimate is the value of a wage below which a certain percent of workers fall. The median wage is the 50th percentile wage estimate—50 percent of workers earn less than the median and 50 percent of workers earn more than the median. More about percentile wages.
(1) Estimates for detailed occupations do not sum to the totals because the totals include occupations not shown separately. Estimates do not include self-employed workers.
(2) Annual wages have been calculated by multiplying the hourly mean wage by a "year-round, full-time" hours figure of 2,080 hours; for those occupations where there is not an hourly wage published, the annual wage has been directly calculated from the reported survey data.
(3) The relative standard error (RSE) is a measure of the reliability of a survey statistic. The smaller the relative standard error, the more precise the estimate.
(9) The location quotient is the ratio of the area concentration of occupational employment to the national average concentration. A location quotient greater than one indicates the occupation has a higher share of employment than average, and a location quotient less than one indicates the occupation is less prevalent in the area than average.
Other OEWS estimates and related information:
May 2021 National Occupational Employment and Wage Estimates
May 2021 State Occupational Employment and Wage Estimates
May 2021 Metropolitan and Nonmetropolitan Area Occupational Employment and Wage Estimates
May 2021 National Industry-Specific Occupational Employment and Wage Estimates
Last Modified Date: March 31, 2022