
An official website of the United States government
An official website of the United States government
The .gov means it's official.
Federal government websites often end in .gov or .mil. Before sharing sensitive information,
make sure you're on a federal government site.
The site is secure.
The
https:// ensures that you are connecting to the official website and that any
information you provide is encrypted and transmitted securely.
Assemble, install, alter, and repair pipelines or pipe systems that carry water, steam, air, or other liquids or gases. May install heating and cooling equipment and mechanical control systems. Includes sprinkler fitters.
Employment estimate and mean wage estimates for Plumbers, Pipefitters, and Steamfitters:
| Employment (1) | Employment RSE (3) |
Mean hourly wage |
Mean annual wage (2) |
Wage RSE (3) |
|---|---|---|---|---|
| 417,620 | 1.4 % | $ 30.46 | $ 63,350 | 0.7 % |
Percentile wage estimates for Plumbers, Pipefitters, and Steamfitters:
| Percentile | 10% | 25% | 50% (Median) |
75% | 90% |
|---|---|---|---|---|---|
| Hourly Wage | $ 17.65 | $ 22.40 | $ 28.79 | $ 37.45 | $ 48.04 |
| Annual Wage (2) | $ 36,700 | $ 46,590 | $ 59,880 | $ 77,890 | $ 99,920 |
Industries with the highest published employment and wages for Plumbers, Pipefitters, and Steamfitters are provided. For a list of all industries with employment in Plumbers, Pipefitters, and Steamfitters, see the Create Customized Tables function.
Industries with the highest levels of employment in Plumbers, Pipefitters, and Steamfitters:
| Industry | Employment (1) | Percent of industry employment | Hourly mean wage | Annual mean wage (2) |
|---|---|---|---|---|
| Building Equipment Contractors | 310,420 | 13.83 | $ 30.72 | $ 63,900 |
| Utility System Construction | 14,910 | 2.76 | $ 30.08 | $ 62,570 |
| Local Government, excluding schools and hospitals (OEWS Designation) | 10,640 | 0.20 | $ 27.57 | $ 57,340 |
| Nonresidential Building Construction | 10,120 | 1.30 | $ 33.20 | $ 69,060 |
| Employment Services | 6,880 | 0.20 | $ 23.70 | $ 49,290 |
Industries with the highest concentration of employment in Plumbers, Pipefitters, and Steamfitters:
| Industry | Employment (1) | Percent of industry employment | Hourly mean wage | Annual mean wage (2) |
|---|---|---|---|---|
| Building Equipment Contractors | 310,420 | 13.83 | $ 30.72 | $ 63,900 |
| Natural Gas Distribution | 6,000 | 5.47 | $ 35.22 | $ 73,260 |
| Pipeline Transportation of Natural Gas | 960 | 3.17 | $ 37.72 | $ 78,450 |
| Utility System Construction | 14,910 | 2.76 | $ 30.08 | $ 62,570 |
| Ship and Boat Building | 3,790 | 2.62 | $ 26.98 | $ 56,120 |
Top paying industries for Plumbers, Pipefitters, and Steamfitters:
| Industry | Employment (1) | Percent of industry employment | Hourly mean wage | Annual mean wage (2) |
|---|---|---|---|---|
| Petroleum and Coal Products Manufacturing | 380 | 0.37 | $ 43.97 | $ 91,450 |
| Electric Power Generation, Transmission and Distribution | 1,070 | 0.28 | $ 43.87 | $ 91,240 |
| Pharmaceutical and Medicine Manufacturing | 120 | 0.04 | $ 43.12 | $ 89,700 |
| Other Pipeline Transportation | 60 | 0.75 | $ 42.51 | $ 88,410 |
| Technical and Trade Schools | 120 | 0.09 | $ 42.42 | $ 88,240 |
States and areas with the highest published employment, location quotients, and wages for Plumbers, Pipefitters, and Steamfitters are provided. For a list of all areas with employment in Plumbers, Pipefitters, and Steamfitters, see the Create Customized Tables function.
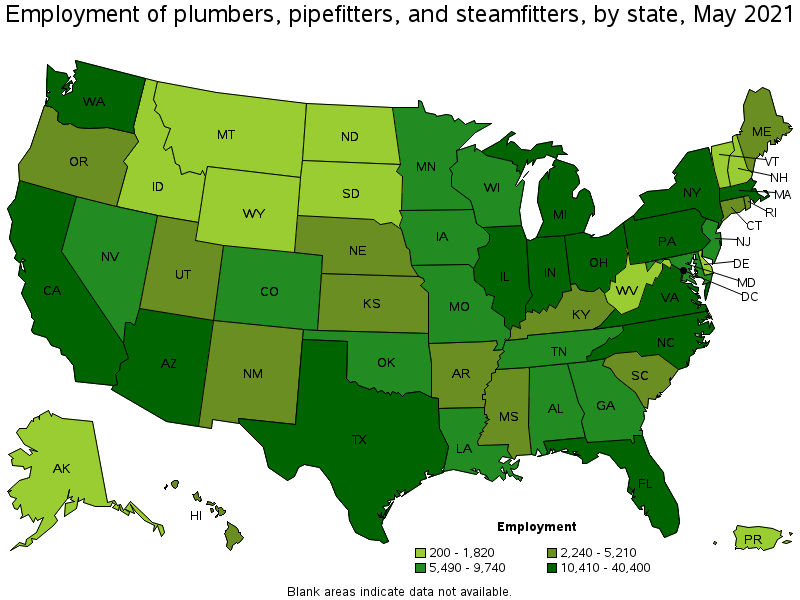
States with the highest employment level in Plumbers, Pipefitters, and Steamfitters:
| State | Employment (1) | Employment per thousand jobs | Location quotient (9) | Hourly mean wage | Annual mean wage (2) |
|---|---|---|---|---|---|
| California | 40,400 | 2.44 | 0.82 | $ 34.62 | $ 72,000 |
| Texas | 36,920 | 3.02 | 1.02 | $ 25.23 | $ 52,470 |
| New York | 25,800 | 2.98 | 1.00 | $ 37.26 | $ 77,490 |
| Florida | 23,800 | 2.77 | 0.93 | $ 23.13 | $ 48,120 |
| Illinois | 15,790 | 2.81 | 0.95 | $ 41.44 | $ 86,200 |
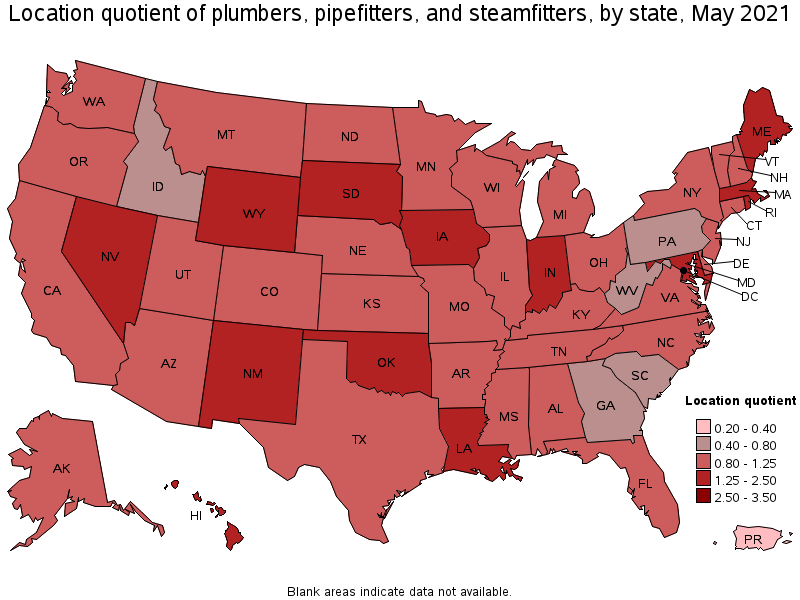
States with the highest concentration of jobs and location quotients in Plumbers, Pipefitters, and Steamfitters:
| State | Employment (1) | Employment per thousand jobs | Location quotient (9) | Hourly mean wage | Annual mean wage (2) |
|---|---|---|---|---|---|
| Rhode Island | 2,240 | 4.90 | 1.65 | $ 31.29 | $ 65,090 |
| Nevada | 6,160 | 4.78 | 1.61 | $ 31.13 | $ 64,750 |
| Louisiana | 8,490 | 4.73 | 1.60 | $ 27.42 | $ 57,040 |
| Hawaii | 2,330 | 4.26 | 1.44 | $ 35.02 | $ 72,830 |
| Wyoming | 1,090 | 4.20 | 1.42 | $ 25.77 | $ 53,610 |
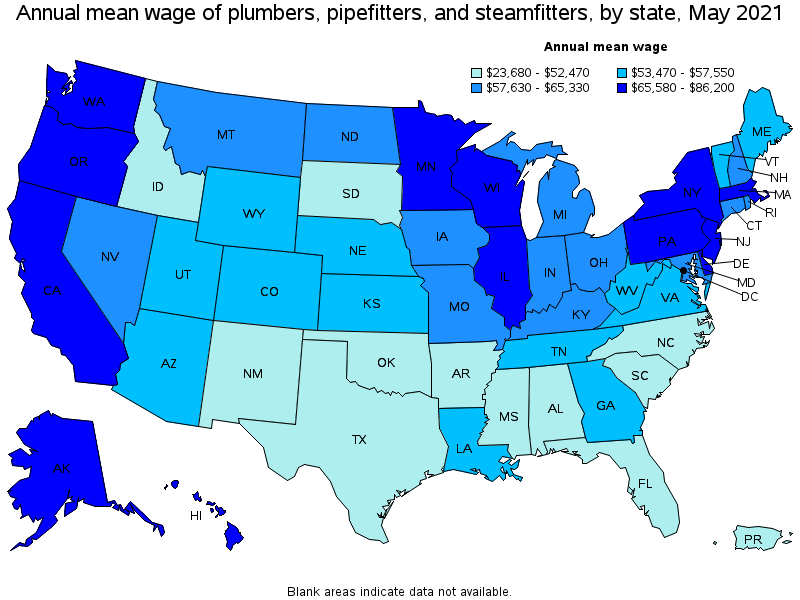
Top paying states for Plumbers, Pipefitters, and Steamfitters:
| State | Employment (1) | Employment per thousand jobs | Location quotient (9) | Hourly mean wage | Annual mean wage (2) |
|---|---|---|---|---|---|
| Illinois | 15,790 | 2.81 | 0.95 | $ 41.44 | $ 86,200 |
| Alaska | 940 | 3.19 | 1.07 | $ 41.01 | $ 85,300 |
| Massachusetts | 12,920 | 3.81 | 1.28 | $ 40.43 | $ 84,090 |
| New Jersey | 9,740 | 2.53 | 0.85 | $ 39.78 | $ 82,740 |
| Oregon | 4,980 | 2.73 | 0.92 | $ 39.17 | $ 81,470 |
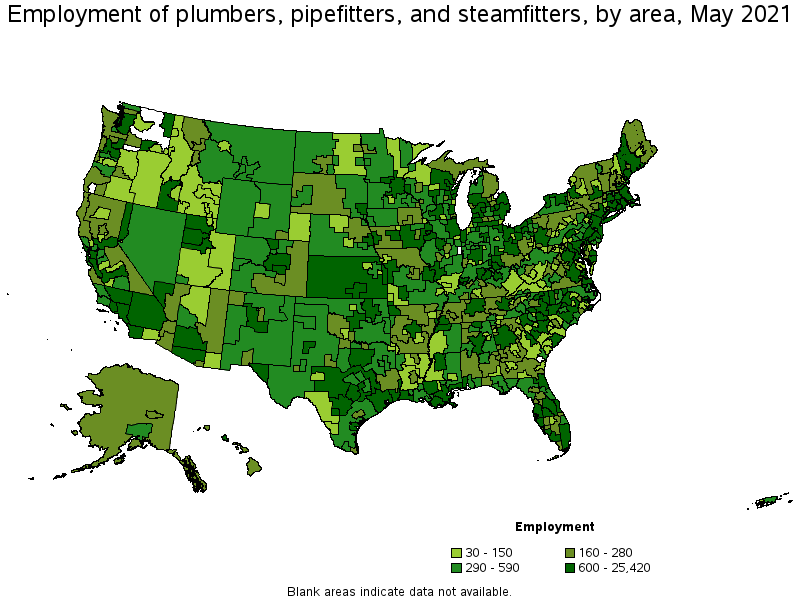
Metropolitan areas with the highest employment level in Plumbers, Pipefitters, and Steamfitters:
| Metropolitan area | Employment (1) | Employment per thousand jobs | Location quotient (9) | Hourly mean wage | Annual mean wage (2) |
|---|---|---|---|---|---|
| New York-Newark-Jersey City, NY-NJ-PA | 25,420 | 2.93 | 0.99 | $ 39.86 | $ 82,900 |
| Los Angeles-Long Beach-Anaheim, CA | 12,630 | 2.21 | 0.75 | $ 32.17 | $ 66,910 |
| Chicago-Naperville-Elgin, IL-IN-WI | 11,780 | 2.78 | 0.94 | $ 42.88 | $ 89,190 |
| Dallas-Fort Worth-Arlington, TX | 10,580 | 2.95 | 0.99 | $ 25.01 | $ 52,010 |
| Boston-Cambridge-Nashua, MA-NH | 9,590 | 3.71 | 1.25 | $ 41.03 | $ 85,340 |
| Houston-The Woodlands-Sugar Land, TX | 9,330 | 3.22 | 1.09 | $ 27.11 | $ 56,380 |
| Phoenix-Mesa-Scottsdale, AZ | 7,920 | 3.74 | 1.26 | $ 27.19 | $ 56,560 |
| Washington-Arlington-Alexandria, DC-VA-MD-WV | 7,890 | 2.69 | 0.91 | $ 30.44 | $ 63,310 |
| Philadelphia-Camden-Wilmington, PA-NJ-DE-MD | 6,960 | 2.62 | 0.88 | $ 34.40 | $ 71,540 |
| Miami-Fort Lauderdale-West Palm Beach, FL | 5,940 | 2.42 | 0.82 | $ 23.78 | $ 49,460 |
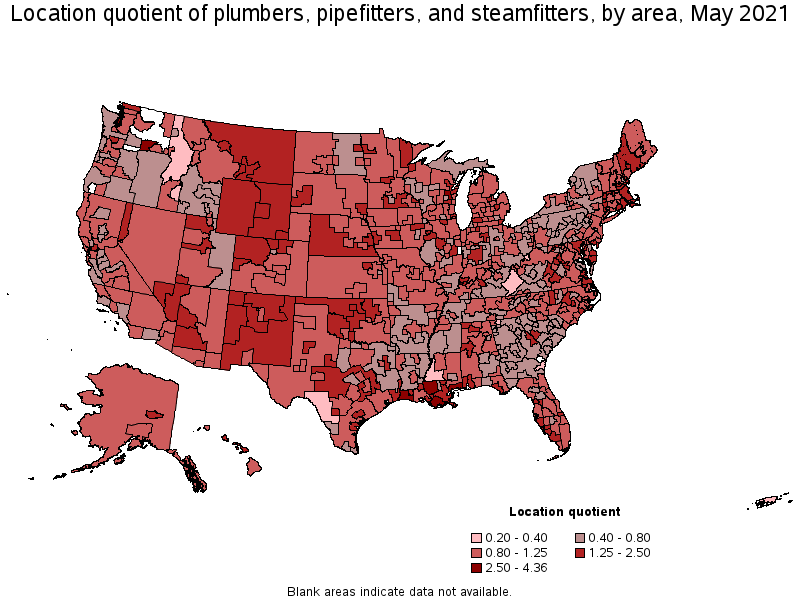
Metropolitan areas with the highest concentration of jobs and location quotients in Plumbers, Pipefitters, and Steamfitters:
| Metropolitan area | Employment (1) | Employment per thousand jobs | Location quotient (9) | Hourly mean wage | Annual mean wage (2) |
|---|---|---|---|---|---|
| Kokomo, IN | 470 | 12.93 | 4.36 | $ 34.23 | $ 71,210 |
| Bremerton-Silverdale, WA | 970 | 11.27 | 3.80 | $ 31.75 | $ 66,040 |
| Gulfport-Biloxi-Pascagoula, MS | 1,300 | 8.95 | 3.02 | $ 24.99 | $ 51,970 |
| Appleton, WI | 1,010 | 8.59 | 2.90 | $ 36.71 | $ 76,350 |
| Lake Charles, LA | 720 | 7.97 | 2.69 | $ 31.75 | $ 66,050 |
| Houma-Thibodaux, LA | 620 | 7.73 | 2.61 | $ 22.50 | $ 46,810 |
| Baton Rouge, LA | 2,810 | 7.66 | 2.58 | $ 30.30 | $ 63,030 |
| Kennewick-Richland, WA | 890 | 7.63 | 2.58 | $ 40.29 | $ 83,800 |
| St. Cloud, MN | 690 | 7.00 | 2.36 | $ 33.60 | $ 69,890 |
| Fond du Lac, WI | 300 | 6.90 | 2.33 | $ 33.48 | $ 69,640 |
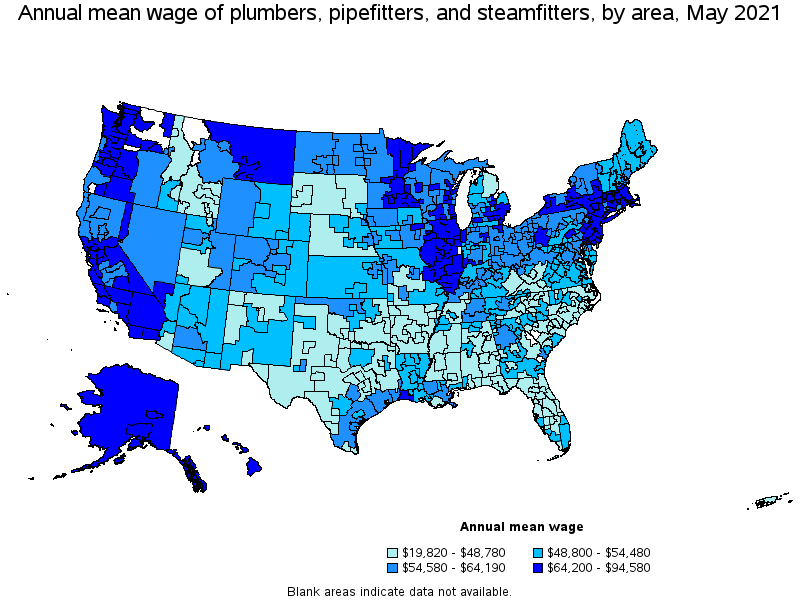
Top paying metropolitan areas for Plumbers, Pipefitters, and Steamfitters:
| Metropolitan area | Employment (1) | Employment per thousand jobs | Location quotient (9) | Hourly mean wage | Annual mean wage (2) |
|---|---|---|---|---|---|
| San Jose-Sunnyvale-Santa Clara, CA | 2,440 | 2.28 | 0.77 | $ 45.47 | $ 94,580 |
| San Francisco-Oakland-Hayward, CA | 5,600 | 2.50 | 0.84 | $ 43.03 | $ 89,500 |
| Chicago-Naperville-Elgin, IL-IN-WI | 11,780 | 2.78 | 0.94 | $ 42.88 | $ 89,190 |
| Fairbanks, AK | 190 | 5.41 | 1.82 | $ 42.17 | $ 87,710 |
| Anchorage, AK | 500 | 3.07 | 1.04 | $ 41.42 | $ 86,140 |
| Seattle-Tacoma-Bellevue, WA | 5,880 | 3.07 | 1.03 | $ 41.37 | $ 86,040 |
| Champaign-Urbana, IL | 490 | 4.96 | 1.67 | $ 41.15 | $ 85,580 |
| Boston-Cambridge-Nashua, MA-NH | 9,590 | 3.71 | 1.25 | $ 41.03 | $ 85,340 |
| Napa, CA | 130 | 1.84 | 0.62 | $ 40.81 | $ 84,890 |
| Portland-Vancouver-Hillsboro, OR-WA | 3,870 | 3.44 | 1.16 | $ 40.80 | $ 84,860 |
Nonmetropolitan areas with the highest employment in Plumbers, Pipefitters, and Steamfitters:
| Nonmetropolitan area | Employment (1) | Employment per thousand jobs | Location quotient (9) | Hourly mean wage | Annual mean wage (2) |
|---|---|---|---|---|---|
| Kansas nonmetropolitan area | 1,010 | 2.69 | 0.91 | $ 23.68 | $ 49,260 |
| Hill Country Region of Texas nonmetropolitan area | 840 | 4.43 | 1.49 | $ 21.85 | $ 45,450 |
| Southwest Maine nonmetropolitan area | 810 | 4.43 | 1.49 | $ 25.48 | $ 52,990 |
| North Northeastern Ohio nonmetropolitan area (noncontiguous) | 780 | 2.47 | 0.83 | $ 29.88 | $ 62,150 |
| Piedmont North Carolina nonmetropolitan area | 770 | 3.16 | 1.07 | $ 19.65 | $ 40,870 |
Nonmetropolitan areas with the highest concentration of jobs and location quotients in Plumbers, Pipefitters, and Steamfitters:
| Nonmetropolitan area | Employment (1) | Employment per thousand jobs | Location quotient (9) | Hourly mean wage | Annual mean wage (2) |
|---|---|---|---|---|---|
| Massachusetts nonmetropolitan area | 300 | 5.14 | 1.74 | $ 35.93 | $ 74,730 |
| Northwest Colorado nonmetropolitan area | 590 | 5.06 | 1.71 | $ 28.55 | $ 59,390 |
| Southwest Louisiana nonmetropolitan area | 330 | 4.99 | 1.68 | $ 25.97 | $ 54,020 |
| East-Central Montana nonmetropolitan area | 290 | 4.72 | 1.59 | $ 34.10 | $ 70,930 |
| Southwest Oklahoma nonmetropolitan area | 270 | 4.60 | 1.55 | $ 21.37 | $ 44,440 |
Top paying nonmetropolitan areas for Plumbers, Pipefitters, and Steamfitters:
| Nonmetropolitan area | Employment (1) | Employment per thousand jobs | Location quotient (9) | Hourly mean wage | Annual mean wage (2) |
|---|---|---|---|---|---|
| Central East New York nonmetropolitan area | 230 | 1.56 | 0.52 | $ 40.12 | $ 83,450 |
| Alaska nonmetropolitan area | 260 | 2.66 | 0.90 | $ 39.39 | $ 81,930 |
| Massachusetts nonmetropolitan area | 300 | 5.14 | 1.74 | $ 35.93 | $ 74,730 |
| Northwest Illinois nonmetropolitan area | 410 | 3.27 | 1.10 | $ 35.23 | $ 73,270 |
| Hawaii / Kauai nonmetropolitan area | 270 | 3.09 | 1.04 | $ 34.40 | $ 71,550 |
These estimates are calculated with data collected from employers in all industry sectors, all metropolitan and nonmetropolitan areas, and all states and the District of Columbia. The top employment and wage figures are provided above. The complete list is available in the downloadable XLS files.
The percentile wage estimate is the value of a wage below which a certain percent of workers fall. The median wage is the 50th percentile wage estimate—50 percent of workers earn less than the median and 50 percent of workers earn more than the median. More about percentile wages.
(1) Estimates for detailed occupations do not sum to the totals because the totals include occupations not shown separately. Estimates do not include self-employed workers.
(2) Annual wages have been calculated by multiplying the hourly mean wage by a "year-round, full-time" hours figure of 2,080 hours; for those occupations where there is not an hourly wage published, the annual wage has been directly calculated from the reported survey data.
(3) The relative standard error (RSE) is a measure of the reliability of a survey statistic. The smaller the relative standard error, the more precise the estimate.
(9) The location quotient is the ratio of the area concentration of occupational employment to the national average concentration. A location quotient greater than one indicates the occupation has a higher share of employment than average, and a location quotient less than one indicates the occupation is less prevalent in the area than average.
Other OEWS estimates and related information:
May 2021 National Occupational Employment and Wage Estimates
May 2021 State Occupational Employment and Wage Estimates
May 2021 Metropolitan and Nonmetropolitan Area Occupational Employment and Wage Estimates
May 2021 National Industry-Specific Occupational Employment and Wage Estimates
Last Modified Date: March 31, 2022