
An official website of the United States government
An official website of the United States government
The .gov means it's official.
Federal government websites often end in .gov or .mil. Before sharing sensitive information,
make sure you're on a federal government site.
The site is secure.
The
https:// ensures that you are connecting to the official website and that any
information you provide is encrypted and transmitted securely.
Erect and repair fences and fence gates, using hand and power tools.
Employment estimate and mean wage estimates for Fence Erectors:
| Employment (1) | Employment RSE (3) |
Mean hourly wage |
Mean annual wage (2) |
Wage RSE (3) |
|---|---|---|---|---|
| 24,470 | 5.7 % | $ 19.78 | $ 41,140 | 1.6 % |
Percentile wage estimates for Fence Erectors:
| Percentile | 10% | 25% | 50% (Median) |
75% | 90% |
|---|---|---|---|---|---|
| Hourly Wage | $ 13.86 | $ 15.35 | $ 18.12 | $ 22.38 | $ 27.99 |
| Annual Wage (2) | $ 28,830 | $ 31,920 | $ 37,700 | $ 46,550 | $ 58,210 |
Industries with the highest published employment and wages for Fence Erectors are provided. For a list of all industries with employment in Fence Erectors, see the Create Customized Tables function.
Industries with the highest levels of employment in Fence Erectors:
| Industry | Employment (1) | Percent of industry employment | Hourly mean wage | Annual mean wage (2) |
|---|---|---|---|---|
| Other Specialty Trade Contractors | 20,570 | 2.88 | $ 19.43 | $ 40,410 |
| Fabricated Metal Product Manufacturing (3323 and 3324 only) | 660 | 0.14 | $ 23.06 | $ 47,960 |
| Foundation, Structure, and Building Exterior Contractors | 450 | 0.05 | $ 21.47 | $ 44,650 |
| Rental and leasing services (5322, 5323, and 5324 only) | 430 | 0.15 | $ 21.15 | $ 43,990 |
| Highway, Street, and Bridge Construction | 400 | 0.11 | $ 24.56 | $ 51,080 |
Industries with the highest concentration of employment in Fence Erectors:
| Industry | Employment (1) | Percent of industry employment | Hourly mean wage | Annual mean wage (2) |
|---|---|---|---|---|
| Other Specialty Trade Contractors | 20,570 | 2.88 | $ 19.43 | $ 40,410 |
| Rental and leasing services (5322, 5323, and 5324 only) | 430 | 0.15 | $ 21.15 | $ 43,990 |
| Fabricated Metal Product Manufacturing (3323 and 3324 only) | 660 | 0.14 | $ 23.06 | $ 47,960 |
| Highway, Street, and Bridge Construction | 400 | 0.11 | $ 24.56 | $ 51,080 |
| Foundation, Structure, and Building Exterior Contractors | 450 | 0.05 | $ 21.47 | $ 44,650 |
Top paying industries for Fence Erectors:
| Industry | Employment (1) | Percent of industry employment | Hourly mean wage | Annual mean wage (2) |
|---|---|---|---|---|
| Building Material and Supplies Dealers | (8) | (8) | $ 27.32 | $ 56,830 |
| Highway, Street, and Bridge Construction | 400 | 0.11 | $ 24.56 | $ 51,080 |
| Fabricated Metal Product Manufacturing (3321, 3322, 3325, 3326, and 3329 only) | (8) | (8) | $ 23.06 | $ 47,960 |
| Fabricated Metal Product Manufacturing (3323 and 3324 only) | 660 | 0.14 | $ 23.06 | $ 47,960 |
| Building Equipment Contractors | 210 | 0.01 | $ 22.19 | $ 46,160 |
States and areas with the highest published employment, location quotients, and wages for Fence Erectors are provided. For a list of all areas with employment in Fence Erectors, see the Create Customized Tables function.
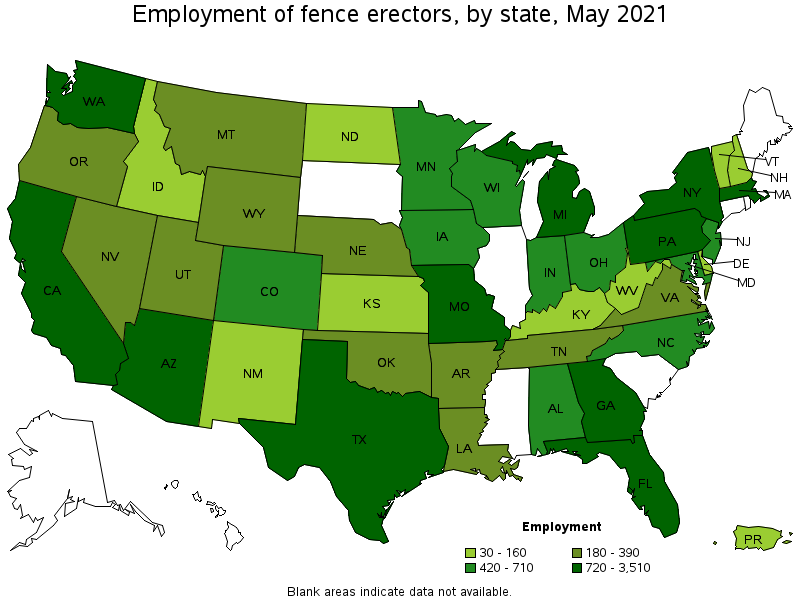
States with the highest employment level in Fence Erectors:
| State | Employment (1) | Employment per thousand jobs | Location quotient (9) | Hourly mean wage | Annual mean wage (2) |
|---|---|---|---|---|---|
| California | 3,510 | 0.21 | 1.22 | $ 22.72 | $ 47,260 |
| Florida | 1,780 | 0.21 | 1.19 | $ 17.73 | $ 36,890 |
| Texas | 1,730 | 0.14 | 0.82 | $ 17.43 | $ 36,250 |
| New York | 1,340 | 0.15 | 0.89 | $ 23.47 | $ 48,820 |
| Massachusetts | 1,110 | 0.33 | 1.89 | $ 21.30 | $ 44,300 |
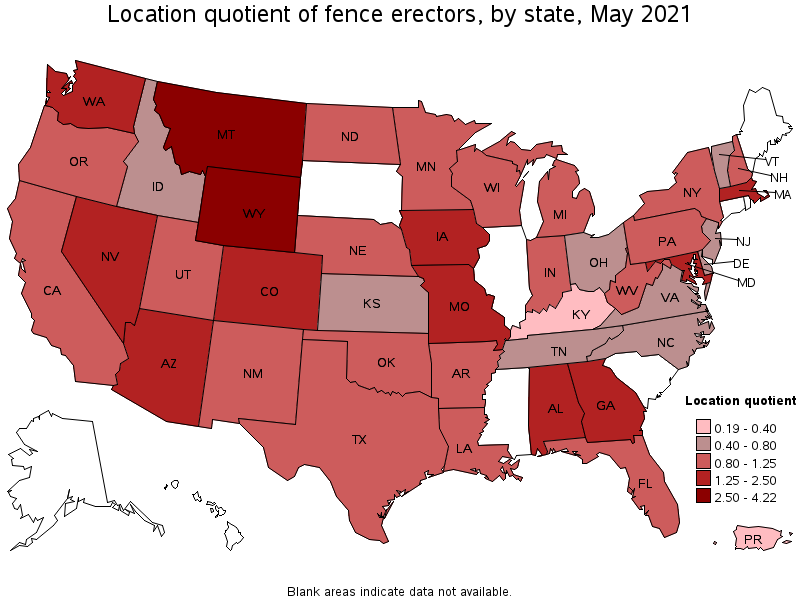
States with the highest concentration of jobs and location quotients in Fence Erectors:
| State | Employment (1) | Employment per thousand jobs | Location quotient (9) | Hourly mean wage | Annual mean wage (2) |
|---|---|---|---|---|---|
| Wyoming | 190 | 0.73 | 4.22 | $ 19.05 | $ 39,630 |
| Montana | 300 | 0.64 | 3.69 | $ 18.38 | $ 38,240 |
| Massachusetts | 1,110 | 0.33 | 1.89 | $ 21.30 | $ 44,300 |
| Iowa | 450 | 0.31 | 1.76 | $ 17.56 | $ 36,520 |
| Arizona | 840 | 0.29 | 1.69 | $ 19.67 | $ 40,900 |
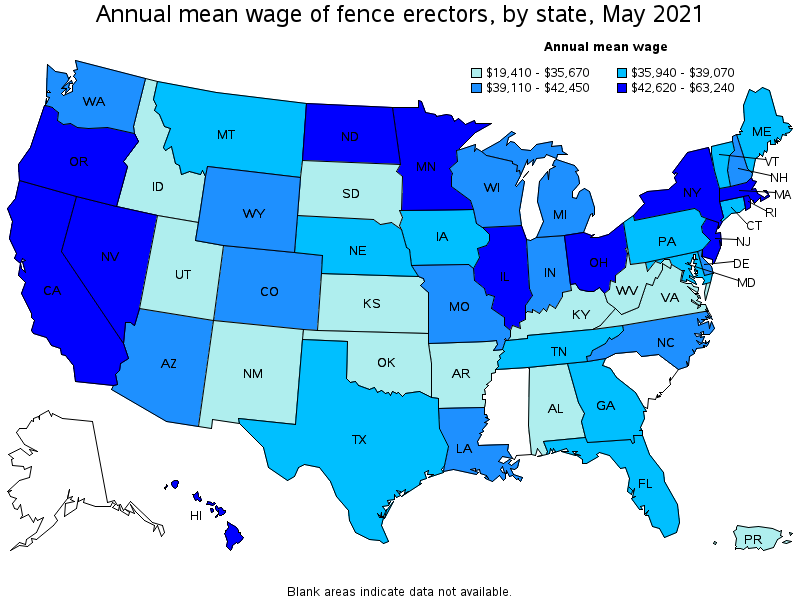
Top paying states for Fence Erectors:
| State | Employment (1) | Employment per thousand jobs | Location quotient (9) | Hourly mean wage | Annual mean wage (2) |
|---|---|---|---|---|---|
| New Jersey | 480 | 0.12 | 0.72 | $ 30.40 | $ 63,240 |
| Hawaii | (8) | (8) | (8) | $ 26.00 | $ 54,090 |
| New York | 1,340 | 0.15 | 0.89 | $ 23.47 | $ 48,820 |
| North Dakota | 80 | 0.21 | 1.21 | $ 23.17 | $ 48,180 |
| California | 3,510 | 0.21 | 1.22 | $ 22.72 | $ 47,260 |
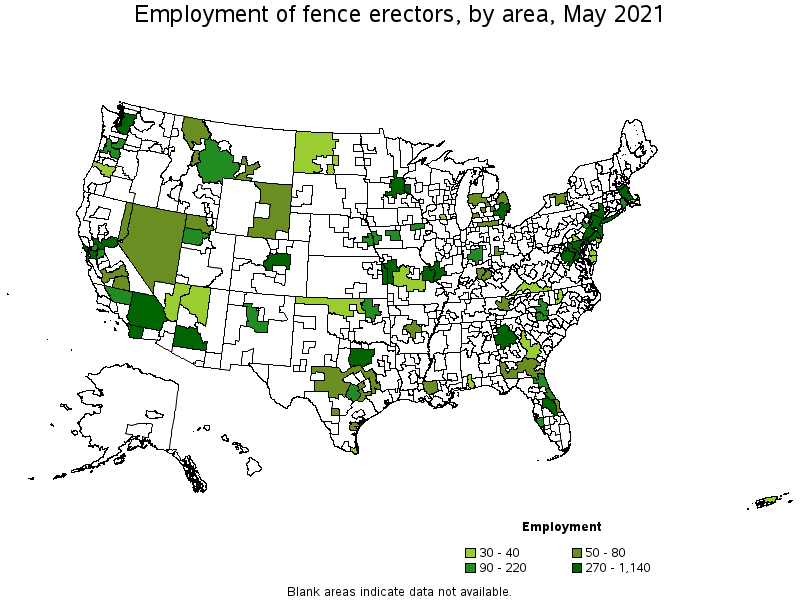
Metropolitan areas with the highest employment level in Fence Erectors:
| Metropolitan area | Employment (1) | Employment per thousand jobs | Location quotient (9) | Hourly mean wage | Annual mean wage (2) |
|---|---|---|---|---|---|
| New York-Newark-Jersey City, NY-NJ-PA | 1,140 | 0.13 | 0.76 | $ 26.11 | $ 54,310 |
| Boston-Cambridge-Nashua, MA-NH | 860 | 0.33 | 1.91 | $ 21.65 | $ 45,040 |
| Atlanta-Sandy Springs-Roswell, GA | 630 | 0.24 | 1.40 | $ 18.53 | $ 38,540 |
| Phoenix-Mesa-Scottsdale, AZ | 610 | 0.29 | 1.65 | $ 20.31 | $ 42,250 |
| Dallas-Fort Worth-Arlington, TX | 510 | 0.14 | 0.81 | $ 18.09 | $ 37,640 |
| San Francisco-Oakland-Hayward, CA | 490 | 0.22 | 1.26 | $ 23.26 | $ 48,370 |
| Minneapolis-St. Paul-Bloomington, MN-WI | 460 | 0.25 | 1.46 | $ 21.90 | $ 45,560 |
| Detroit-Warren-Dearborn, MI | 430 | 0.24 | 1.38 | $ 21.03 | $ 43,750 |
| Riverside-San Bernardino-Ontario, CA | 420 | 0.27 | 1.56 | $ 23.82 | $ 49,540 |
| Seattle-Tacoma-Bellevue, WA | 400 | 0.21 | 1.20 | $ 21.57 | $ 44,860 |
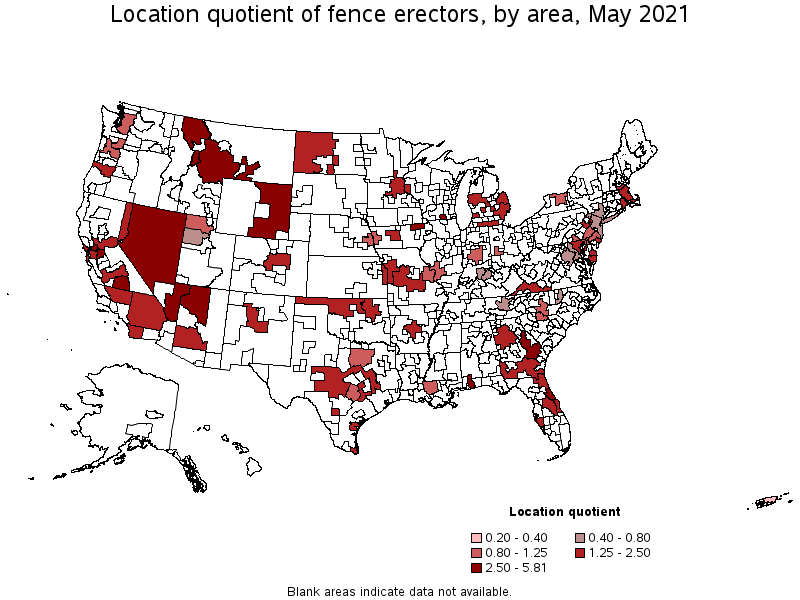
Metropolitan areas with the highest concentration of jobs and location quotients in Fence Erectors:
| Metropolitan area | Employment (1) | Employment per thousand jobs | Location quotient (9) | Hourly mean wage | Annual mean wage (2) |
|---|---|---|---|---|---|
| Cedar Rapids, IA | 120 | 0.91 | 5.25 | $ 18.21 | $ 37,880 |
| Vallejo-Fairfield, CA | 90 | 0.72 | 4.13 | $ 22.39 | $ 46,580 |
| Lake Havasu City-Kingman, AZ | 40 | 0.71 | 4.09 | $ 18.09 | $ 37,630 |
| Billings, MT | 50 | 0.61 | 3.50 | $ 19.58 | $ 40,730 |
| Flagstaff, AZ | 30 | 0.55 | 3.19 | $ 16.02 | $ 33,320 |
| Deltona-Daytona Beach-Ormond Beach, FL | 110 | 0.55 | 3.18 | $ 15.88 | $ 33,030 |
| Visalia-Porterville, CA | 80 | 0.55 | 3.15 | $ 18.32 | $ 38,110 |
| Janesville-Beloit, WI | 30 | 0.53 | 3.04 | $ 18.94 | $ 39,400 |
| Daphne-Fairhope-Foley, AL | 40 | 0.51 | 2.94 | $ 15.80 | $ 32,870 |
| Stockton-Lodi, CA | 120 | 0.45 | 2.59 | $ 24.78 | $ 51,550 |
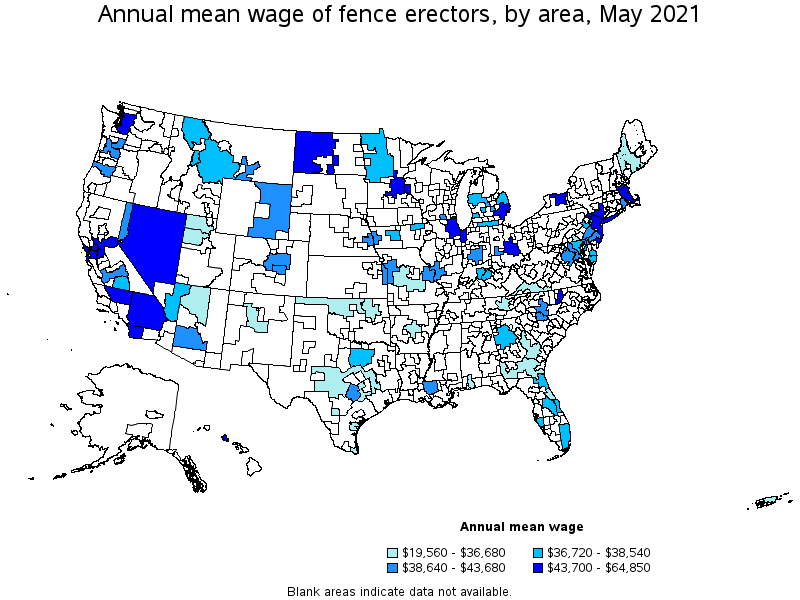
Top paying metropolitan areas for Fence Erectors:
| Metropolitan area | Employment (1) | Employment per thousand jobs | Location quotient (9) | Hourly mean wage | Annual mean wage (2) |
|---|---|---|---|---|---|
| Atlantic City-Hammonton, NJ | 40 | 0.36 | 2.05 | $ 31.18 | $ 64,850 |
| Rochester, NY | 80 | 0.17 | 0.97 | $ 28.29 | $ 58,850 |
| New York-Newark-Jersey City, NY-NJ-PA | 1,140 | 0.13 | 0.76 | $ 26.11 | $ 54,310 |
| Urban Honolulu, HI | (8) | (8) | (8) | $ 25.86 | $ 53,800 |
| Chicago-Naperville-Elgin, IL-IN-WI | (8) | (8) | (8) | $ 25.12 | $ 52,240 |
| Stockton-Lodi, CA | 120 | 0.45 | 2.59 | $ 24.78 | $ 51,550 |
| Riverside-San Bernardino-Ontario, CA | 420 | 0.27 | 1.56 | $ 23.82 | $ 49,540 |
| San Francisco-Oakland-Hayward, CA | 490 | 0.22 | 1.26 | $ 23.26 | $ 48,370 |
| Columbus, OH | (8) | (8) | (8) | $ 23.17 | $ 48,190 |
| Sacramento--Roseville--Arden-Arcade, CA | 300 | 0.31 | 1.77 | $ 23.14 | $ 48,140 |
Nonmetropolitan areas with the highest employment in Fence Erectors:
| Nonmetropolitan area | Employment (1) | Employment per thousand jobs | Location quotient (9) | Hourly mean wage | Annual mean wage (2) |
|---|---|---|---|---|---|
| Southwest Montana nonmetropolitan area | 110 | 0.80 | 4.61 | $ 18.35 | $ 38,160 |
| West Montana nonmetropolitan area | 80 | 1.01 | 5.81 | $ 17.98 | $ 37,400 |
| Hill Country Region of Texas nonmetropolitan area | 80 | 0.40 | 2.32 | $ 16.10 | $ 33,480 |
| Balance of Lower Peninsula of Michigan nonmetropolitan area | 80 | 0.30 | 1.73 | $ 18.06 | $ 37,560 |
| Nevada nonmetropolitan area | 70 | 0.76 | 4.35 | $ 21.01 | $ 43,700 |
Nonmetropolitan areas with the highest concentration of jobs and location quotients in Fence Erectors:
| Nonmetropolitan area | Employment (1) | Employment per thousand jobs | Location quotient (9) | Hourly mean wage | Annual mean wage (2) |
|---|---|---|---|---|---|
| West Montana nonmetropolitan area | 80 | 1.01 | 5.81 | $ 17.98 | $ 37,400 |
| Eastern Wyoming nonmetropolitan area | 70 | 0.86 | 4.97 | $ 18.93 | $ 39,370 |
| Southwest Montana nonmetropolitan area | 110 | 0.80 | 4.61 | $ 18.35 | $ 38,160 |
| Nevada nonmetropolitan area | 70 | 0.76 | 4.35 | $ 21.01 | $ 43,700 |
| East Georgia nonmetropolitan area | 40 | 0.51 | 2.92 | $ 13.73 | $ 28,560 |
Top paying nonmetropolitan areas for Fence Erectors:
| Nonmetropolitan area | Employment (1) | Employment per thousand jobs | Location quotient (9) | Hourly mean wage | Annual mean wage (2) |
|---|---|---|---|---|---|
| West North Dakota nonmetropolitan area | 30 | 0.32 | 1.84 | $ 26.10 | $ 54,290 |
| Nevada nonmetropolitan area | 70 | 0.76 | 4.35 | $ 21.01 | $ 43,700 |
| Eastern Wyoming nonmetropolitan area | 70 | 0.86 | 4.97 | $ 18.93 | $ 39,370 |
| Southwest Montana nonmetropolitan area | 110 | 0.80 | 4.61 | $ 18.35 | $ 38,160 |
| Balance of Lower Peninsula of Michigan nonmetropolitan area | 80 | 0.30 | 1.73 | $ 18.06 | $ 37,560 |
These estimates are calculated with data collected from employers in all industry sectors, all metropolitan and nonmetropolitan areas, and all states and the District of Columbia. The top employment and wage figures are provided above. The complete list is available in the downloadable XLS files.
The percentile wage estimate is the value of a wage below which a certain percent of workers fall. The median wage is the 50th percentile wage estimate—50 percent of workers earn less than the median and 50 percent of workers earn more than the median. More about percentile wages.
(1) Estimates for detailed occupations do not sum to the totals because the totals include occupations not shown separately. Estimates do not include self-employed workers.
(2) Annual wages have been calculated by multiplying the hourly mean wage by a "year-round, full-time" hours figure of 2,080 hours; for those occupations where there is not an hourly wage published, the annual wage has been directly calculated from the reported survey data.
(3) The relative standard error (RSE) is a measure of the reliability of a survey statistic. The smaller the relative standard error, the more precise the estimate.
(8) Estimate not released.
(9) The location quotient is the ratio of the area concentration of occupational employment to the national average concentration. A location quotient greater than one indicates the occupation has a higher share of employment than average, and a location quotient less than one indicates the occupation is less prevalent in the area than average.
Other OEWS estimates and related information:
May 2021 National Occupational Employment and Wage Estimates
May 2021 State Occupational Employment and Wage Estimates
May 2021 Metropolitan and Nonmetropolitan Area Occupational Employment and Wage Estimates
May 2021 National Industry-Specific Occupational Employment and Wage Estimates
Last Modified Date: March 31, 2022