
An official website of the United States government
An official website of the United States government
The .gov means it's official.
Federal government websites often end in .gov or .mil. Before sharing sensitive information,
make sure you're on a federal government site.
The site is secure.
The
https:// ensures that you are connecting to the official website and that any
information you provide is encrypted and transmitted securely.
Maintain highways, municipal and rural roads, airport runways, and rights-of-way. Duties include patching broken or eroded pavement and repairing guard rails, highway markers, and snow fences. May also mow or clear brush from along road, or plow snow from roadway. Excludes �Tree Trimmers and Pruners� (37-3013).
Employment estimate and mean wage estimates for Highway Maintenance Workers:
| Employment (1) | Employment RSE (3) |
Mean hourly wage |
Mean annual wage (2) |
Wage RSE (3) |
|---|---|---|---|---|
| 141,150 | 1.2 % | $ 21.32 | $ 44,340 | 0.4 % |
Percentile wage estimates for Highway Maintenance Workers:
| Percentile | 10% | 25% | 50% (Median) |
75% | 90% |
|---|---|---|---|---|---|
| Hourly Wage | $ 14.01 | $ 17.65 | $ 22.06 | $ 23.32 | $ 29.31 |
| Annual Wage (2) | $ 29,130 | $ 36,700 | $ 45,880 | $ 48,500 | $ 60,970 |
Industries with the highest published employment and wages for Highway Maintenance Workers are provided. For a list of all industries with employment in Highway Maintenance Workers, see the Create Customized Tables function.
Industries with the highest levels of employment in Highway Maintenance Workers:
| Industry | Employment (1) | Percent of industry employment | Hourly mean wage | Annual mean wage (2) |
|---|---|---|---|---|
| Local Government, excluding schools and hospitals (OEWS Designation) | 97,770 | 1.82 | $ 21.30 | $ 44,300 |
| State Government, excluding schools and hospitals (OEWS Designation) | 34,650 | 1.58 | $ 21.77 | $ 45,280 |
| Highway, Street, and Bridge Construction | 5,020 | 1.41 | $ 20.35 | $ 42,330 |
| Other Specialty Trade Contractors | 500 | 0.07 | $ 17.81 | $ 37,050 |
| Employment Services | 410 | 0.01 | $ 16.28 | $ 33,850 |
Industries with the highest concentration of employment in Highway Maintenance Workers:
| Industry | Employment (1) | Percent of industry employment | Hourly mean wage | Annual mean wage (2) |
|---|---|---|---|---|
| Local Government, excluding schools and hospitals (OEWS Designation) | 97,770 | 1.82 | $ 21.30 | $ 44,300 |
| State Government, excluding schools and hospitals (OEWS Designation) | 34,650 | 1.58 | $ 21.77 | $ 45,280 |
| Highway, Street, and Bridge Construction | 5,020 | 1.41 | $ 20.35 | $ 42,330 |
| Other Specialty Trade Contractors | 500 | 0.07 | $ 17.81 | $ 37,050 |
| Water, Sewage and Other Systems | 30 | 0.06 | $ 13.02 | $ 27,080 |
Top paying industries for Highway Maintenance Workers:
| Industry | Employment (1) | Percent of industry employment | Hourly mean wage | Annual mean wage (2) |
|---|---|---|---|---|
| Rental and leasing services (5322, 5323, and 5324 only) | 180 | 0.06 | $ 33.66 | $ 70,010 |
| Federal Executive Branch (OEWS Designation) | 40 | (7) | $ 26.55 | $ 55,220 |
| Foundation, Structure, and Building Exterior Contractors | (8) | (8) | $ 22.07 | $ 45,900 |
| Building Equipment Contractors | 100 | (7) | $ 21.79 | $ 45,310 |
| State Government, excluding schools and hospitals (OEWS Designation) | 34,650 | 1.58 | $ 21.77 | $ 45,280 |
States and areas with the highest published employment, location quotients, and wages for Highway Maintenance Workers are provided. For a list of all areas with employment in Highway Maintenance Workers, see the Create Customized Tables function.
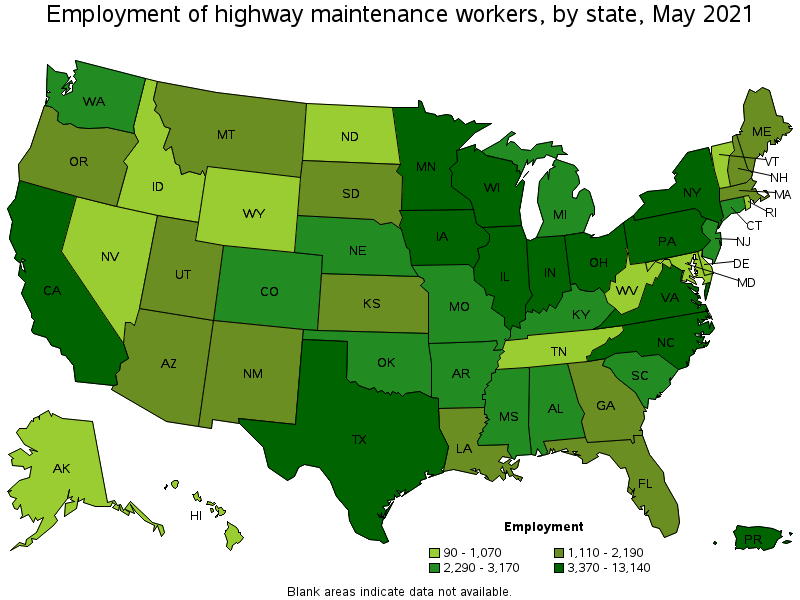
States with the highest employment level in Highway Maintenance Workers:
| State | Employment (1) | Employment per thousand jobs | Location quotient (9) | Hourly mean wage | Annual mean wage (2) |
|---|---|---|---|---|---|
| New York | 13,140 | 1.52 | 1.51 | $ 23.75 | $ 49,390 |
| Pennsylvania | 11,560 | 2.07 | 2.07 | $ 21.99 | $ 45,740 |
| California | 7,940 | 0.48 | 0.48 | $ 26.32 | $ 54,750 |
| Ohio | 6,730 | 1.29 | 1.29 | $ 21.44 | $ 44,590 |
| Texas | 6,210 | 0.51 | 0.51 | $ 16.89 | $ 35,130 |
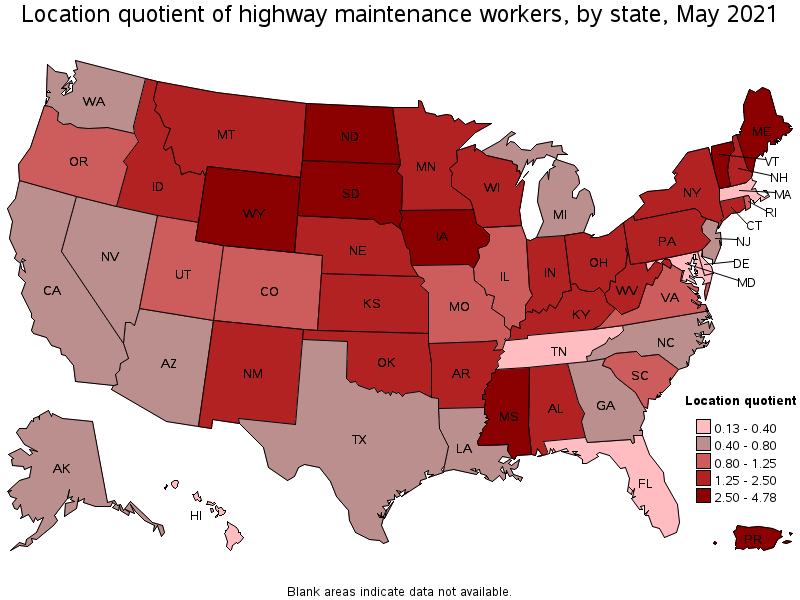
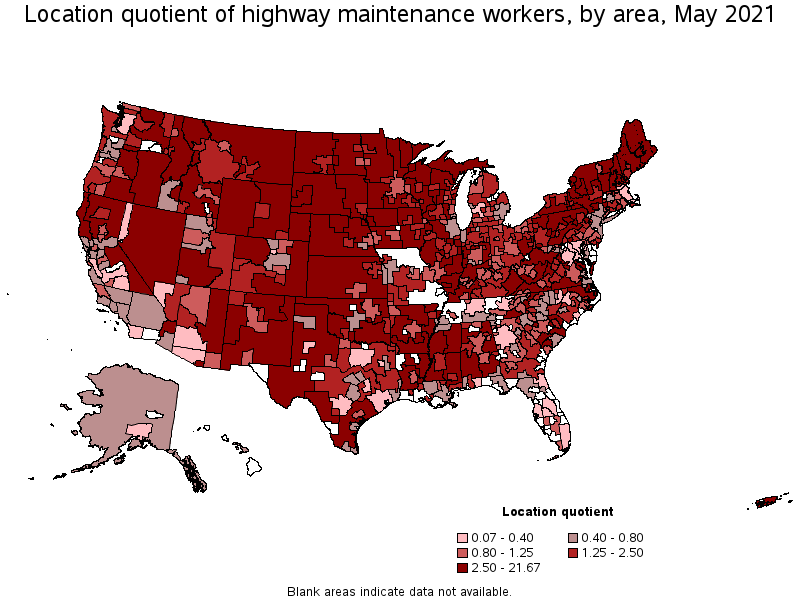
States with the highest concentration of jobs and location quotients in Highway Maintenance Workers:
| State | Employment (1) | Employment per thousand jobs | Location quotient (9) | Hourly mean wage | Annual mean wage (2) |
|---|---|---|---|---|---|
| South Dakota | 1,910 | 4.54 | 4.53 | $ 18.64 | $ 38,770 |
| Wyoming | 850 | 3.26 | 3.25 | $ 20.42 | $ 42,470 |
| Mississippi | 3,080 | 2.80 | 2.79 | $ 14.56 | $ 30,290 |
| Vermont | 780 | 2.76 | 2.76 | $ 22.44 | $ 46,670 |
| North Dakota | 1,070 | 2.71 | 2.71 | $ 23.73 | $ 49,360 |
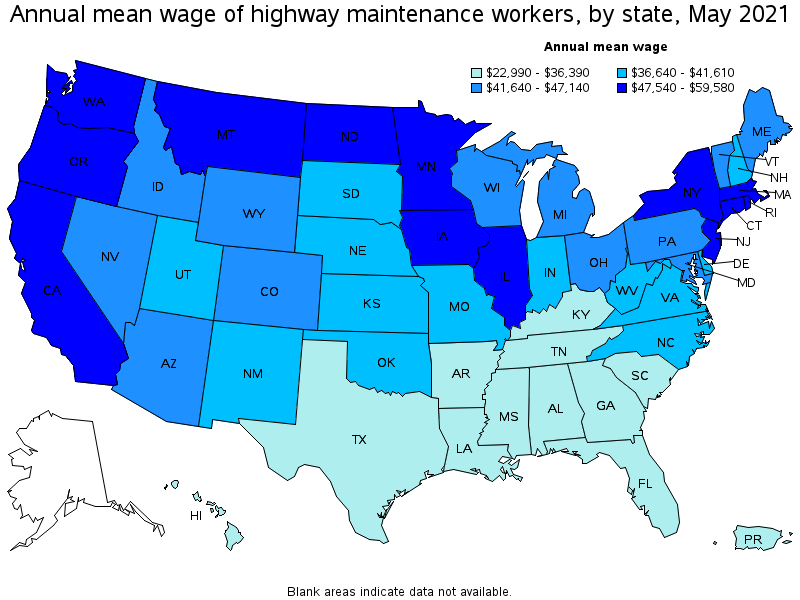
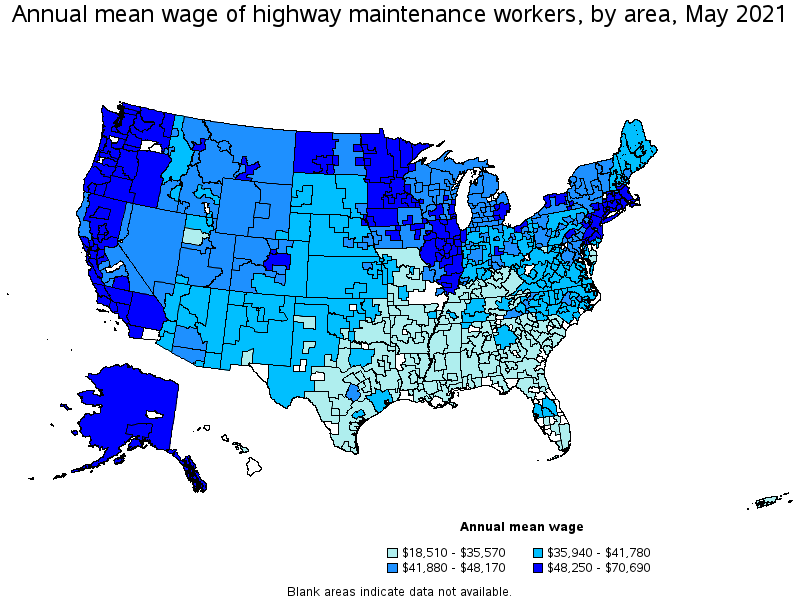
Top paying states for Highway Maintenance Workers:
| State | Employment (1) | Employment per thousand jobs | Location quotient (9) | Hourly mean wage | Annual mean wage (2) |
|---|---|---|---|---|---|
| Washington | 2,440 | 0.76 | 0.76 | $ 28.64 | $ 59,580 |
| Connecticut | 2,360 | 1.50 | 1.50 | $ 27.56 | $ 57,330 |
| Illinois | 6,080 | 1.08 | 1.08 | $ 26.65 | $ 55,430 |
| California | 7,940 | 0.48 | 0.48 | $ 26.32 | $ 54,750 |
| Minnesota | 4,900 | 1.79 | 1.79 | $ 26.18 | $ 54,460 |
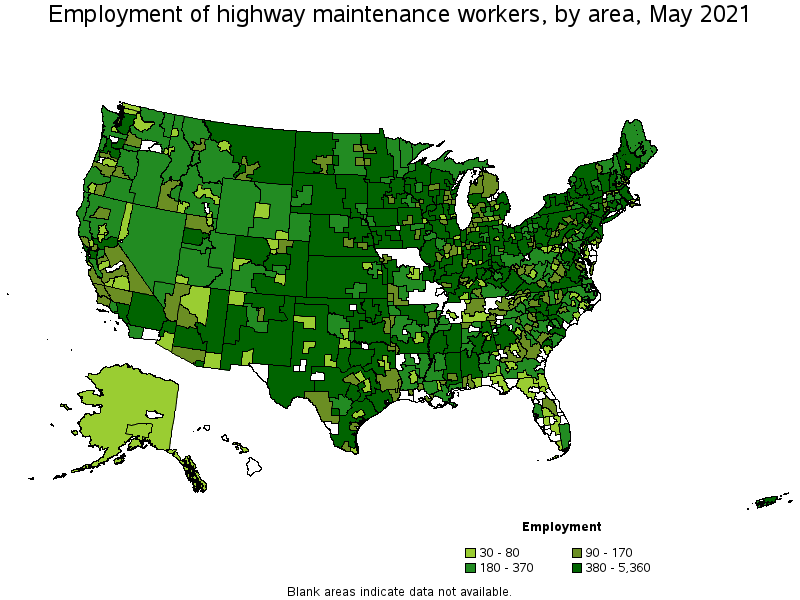
Metropolitan areas with the highest employment level in Highway Maintenance Workers:
| Metropolitan area | Employment (1) | Employment per thousand jobs | Location quotient (9) | Hourly mean wage | Annual mean wage (2) |
|---|---|---|---|---|---|
| New York-Newark-Jersey City, NY-NJ-PA | 5,360 | 0.62 | 0.62 | $ 25.97 | $ 54,010 |
| Philadelphia-Camden-Wilmington, PA-NJ-DE-MD | 3,150 | 1.19 | 1.19 | $ 23.89 | $ 49,680 |
| Los Angeles-Long Beach-Anaheim, CA | 2,390 | 0.42 | 0.42 | $ 25.23 | $ 52,480 |
| Chicago-Naperville-Elgin, IL-IN-WI | 2,340 | 0.55 | 0.55 | $ 27.65 | $ 57,520 |
| Minneapolis-St. Paul-Bloomington, MN-WI | 2,240 | 1.23 | 1.23 | $ 27.45 | $ 57,100 |
| Pittsburgh, PA | 1,880 | 1.81 | 1.80 | $ 23.03 | $ 47,910 |
| St. Louis, MO-IL | 1,390 | 1.08 | 1.08 | $ 22.48 | $ 46,760 |
| Cleveland-Elyria, OH | 1,120 | 1.16 | 1.16 | $ 24.41 | $ 50,760 |
| Buffalo-Cheektowaga-Niagara Falls, NY | 1,070 | 2.14 | 2.14 | $ 23.98 | $ 49,880 |
| Rochester, NY | 1,060 | 2.26 | 2.26 | $ 23.59 | $ 49,070 |
Metropolitan areas with the highest concentration of jobs and location quotients in Highway Maintenance Workers:
| Metropolitan area | Employment (1) | Employment per thousand jobs | Location quotient (9) | Hourly mean wage | Annual mean wage (2) |
|---|---|---|---|---|---|
| Watertown-Fort Drum, NY | 330 | 8.73 | 8.71 | $ 20.81 | $ 43,280 |
| Glens Falls, NY | 280 | 5.76 | 5.75 | $ 21.00 | $ 43,680 |
| Kingston, NY | 260 | 4.79 | 4.78 | $ 23.75 | $ 49,410 |
| Utica-Rome, NY | 490 | 4.30 | 4.29 | $ 21.27 | $ 44,250 |
| Michigan City-La Porte, IN | 160 | 4.13 | 4.12 | $ 18.58 | $ 38,640 |
| Binghamton, NY | 370 | 4.03 | 4.02 | $ 21.28 | $ 44,260 |
| Bangor, ME | 250 | 3.95 | 3.95 | $ 19.49 | $ 40,530 |
| Johnstown, PA | 160 | 3.40 | 3.39 | $ 17.40 | $ 36,190 |
| Gettysburg, PA | 100 | 3.24 | 3.24 | $ 21.78 | $ 45,290 |
| Syracuse, NY | 910 | 3.23 | 3.23 | $ 22.45 | $ 46,690 |
Top paying metropolitan areas for Highway Maintenance Workers:
| Metropolitan area | Employment (1) | Employment per thousand jobs | Location quotient (9) | Hourly mean wage | Annual mean wage (2) |
|---|---|---|---|---|---|
| San Jose-Sunnyvale-Santa Clara, CA | 300 | 0.28 | 0.28 | $ 33.99 | $ 70,690 |
| Seattle-Tacoma-Bellevue, WA | 710 | 0.37 | 0.37 | $ 32.38 | $ 67,340 |
| San Francisco-Oakland-Hayward, CA | 1,050 | 0.47 | 0.47 | $ 31.51 | $ 65,550 |
| Olympia-Tumwater, WA | 60 | 0.57 | 0.56 | $ 30.80 | $ 64,070 |
| Napa, CA | 40 | 0.63 | 0.63 | $ 29.68 | $ 61,730 |
| Santa Rosa, CA | 100 | 0.52 | 0.52 | $ 29.11 | $ 60,540 |
| Bremerton-Silverdale, WA | 100 | 1.17 | 1.17 | $ 28.95 | $ 60,220 |
| Bridgeport-Stamford-Norwalk, CT | 470 | 1.24 | 1.24 | $ 28.86 | $ 60,020 |
| Sacramento--Roseville--Arden-Arcade, CA | 540 | 0.55 | 0.55 | $ 28.81 | $ 59,930 |
| Santa Cruz-Watsonville, CA | 70 | 0.80 | 0.80 | $ 28.63 | $ 59,550 |
Nonmetropolitan areas with the highest employment in Highway Maintenance Workers:
| Nonmetropolitan area | Employment (1) | Employment per thousand jobs | Location quotient (9) | Hourly mean wage | Annual mean wage (2) |
|---|---|---|---|---|---|
| Southwest New York nonmetropolitan area | 1,460 | 8.76 | 8.74 | $ 22.41 | $ 46,610 |
| Central East New York nonmetropolitan area | 1,420 | 9.48 | 9.46 | $ 21.86 | $ 45,480 |
| Kansas nonmetropolitan area | 1,380 | 3.69 | 3.68 | $ 17.52 | $ 36,430 |
| Southern Pennsylvania nonmetropolitan area | 1,320 | 7.34 | 7.33 | $ 19.13 | $ 39,780 |
| Northern Pennsylvania nonmetropolitan area | 1,160 | 7.92 | 7.90 | $ 20.03 | $ 41,670 |
Nonmetropolitan areas with the highest concentration of jobs and location quotients in Highway Maintenance Workers:
| Nonmetropolitan area | Employment (1) | Employment per thousand jobs | Location quotient (9) | Hourly mean wage | Annual mean wage (2) |
|---|---|---|---|---|---|
| West South Dakota nonmetropolitan area | 680 | 11.27 | 11.25 | $ 18.13 | $ 37,710 |
| Northwestern Wisconsin nonmetropolitan area | 480 | 10.07 | 10.05 | $ 20.26 | $ 42,140 |
| Central East New York nonmetropolitan area | 1,420 | 9.48 | 9.46 | $ 21.86 | $ 45,480 |
| Northwest Nebraska nonmetropolitan area | 350 | 9.15 | 9.13 | $ 18.26 | $ 37,970 |
| Southwest New York nonmetropolitan area | 1,460 | 8.76 | 8.74 | $ 22.41 | $ 46,610 |
Top paying nonmetropolitan areas for Highway Maintenance Workers:
| Nonmetropolitan area | Employment (1) | Employment per thousand jobs | Location quotient (9) | Hourly mean wage | Annual mean wage (2) |
|---|---|---|---|---|---|
| Alaska nonmetropolitan area | 60 | 0.66 | 0.66 | $ 32.39 | $ 67,370 |
| Western Washington nonmetropolitan area | 260 | 2.18 | 2.18 | $ 27.08 | $ 56,320 |
| Connecticut nonmetropolitan area | 160 | 5.08 | 5.07 | $ 26.55 | $ 55,230 |
| Eastern Washington nonmetropolitan area | 280 | 3.01 | 3.01 | $ 26.23 | $ 54,550 |
| Northwest Illinois nonmetropolitan area | 510 | 4.02 | 4.01 | $ 25.78 | $ 53,630 |
These estimates are calculated with data collected from employers in all industry sectors, all metropolitan and nonmetropolitan areas, and all states and the District of Columbia. The top employment and wage figures are provided above. The complete list is available in the downloadable XLS files.
The percentile wage estimate is the value of a wage below which a certain percent of workers fall. The median wage is the 50th percentile wage estimate—50 percent of workers earn less than the median and 50 percent of workers earn more than the median. More about percentile wages.
(1) Estimates for detailed occupations do not sum to the totals because the totals include occupations not shown separately. Estimates do not include self-employed workers.
(2) Annual wages have been calculated by multiplying the hourly mean wage by a "year-round, full-time" hours figure of 2,080 hours; for those occupations where there is not an hourly wage published, the annual wage has been directly calculated from the reported survey data.
(3) The relative standard error (RSE) is a measure of the reliability of a survey statistic. The smaller the relative standard error, the more precise the estimate.
(7) The value is less than .005 percent of industry employment.
(8) Estimate not released.
(9) The location quotient is the ratio of the area concentration of occupational employment to the national average concentration. A location quotient greater than one indicates the occupation has a higher share of employment than average, and a location quotient less than one indicates the occupation is less prevalent in the area than average.
Other OEWS estimates and related information:
May 2021 National Occupational Employment and Wage Estimates
May 2021 State Occupational Employment and Wage Estimates
May 2021 Metropolitan and Nonmetropolitan Area Occupational Employment and Wage Estimates
May 2021 National Industry-Specific Occupational Employment and Wage Estimates
Last Modified Date: March 31, 2022