
An official website of the United States government
An official website of the United States government
The .gov means it's official.
Federal government websites often end in .gov or .mil. Before sharing sensitive information,
make sure you're on a federal government site.
The site is secure.
The
https:// ensures that you are connecting to the official website and that any
information you provide is encrypted and transmitted securely.
Clean and repair septic tanks, sewer lines, or drains. May patch walls and partitions of tank, replace damaged drain tile, or repair breaks in underground piping.
Employment estimate and mean wage estimates for Septic Tank Servicers and Sewer Pipe Cleaners:
| Employment (1) | Employment RSE (3) |
Mean hourly wage |
Mean annual wage (2) |
Wage RSE (3) |
|---|---|---|---|---|
| 28,620 | 2.4 % | $ 21.82 | $ 45,390 | 0.8 % |
Percentile wage estimates for Septic Tank Servicers and Sewer Pipe Cleaners:
| Percentile | 10% | 25% | 50% (Median) |
75% | 90% |
|---|---|---|---|---|---|
| Hourly Wage | $ 14.09 | $ 17.42 | $ 21.54 | $ 23.97 | $ 29.76 |
| Annual Wage (2) | $ 29,310 | $ 36,240 | $ 44,810 | $ 49,850 | $ 61,890 |
Industries with the highest published employment and wages for Septic Tank Servicers and Sewer Pipe Cleaners are provided. For a list of all industries with employment in Septic Tank Servicers and Sewer Pipe Cleaners, see the Create Customized Tables function.
Industries with the highest levels of employment in Septic Tank Servicers and Sewer Pipe Cleaners:
| Industry | Employment (1) | Percent of industry employment | Hourly mean wage | Annual mean wage (2) |
|---|---|---|---|---|
| Remediation and Other Waste Management Services | 15,110 | 9.44 | $ 20.62 | $ 42,890 |
| Local Government, excluding schools and hospitals (OEWS Designation) | 8,250 | 0.15 | $ 23.43 | $ 48,730 |
| Other Specialty Trade Contractors | 1,450 | 0.20 | $ 21.92 | $ 45,600 |
| Building Equipment Contractors | 1,030 | 0.05 | $ 22.74 | $ 47,310 |
| Utility System Construction | 880 | 0.16 | $ 25.13 | $ 52,270 |
Industries with the highest concentration of employment in Septic Tank Servicers and Sewer Pipe Cleaners:
| Industry | Employment (1) | Percent of industry employment | Hourly mean wage | Annual mean wage (2) |
|---|---|---|---|---|
| Remediation and Other Waste Management Services | 15,110 | 9.44 | $ 20.62 | $ 42,890 |
| Water, Sewage and Other Systems | 160 | 0.31 | $ 25.22 | $ 52,450 |
| Other Specialty Trade Contractors | 1,450 | 0.20 | $ 21.92 | $ 45,600 |
| Waste Treatment and Disposal | 180 | 0.19 | $ 23.15 | $ 48,160 |
| Utility System Construction | 880 | 0.16 | $ 25.13 | $ 52,270 |
Top paying industries for Septic Tank Servicers and Sewer Pipe Cleaners:
| Industry | Employment (1) | Percent of industry employment | Hourly mean wage | Annual mean wage (2) |
|---|---|---|---|---|
| Services to Buildings and Dwellings | 450 | 0.02 | $ 25.24 | $ 52,510 |
| Water, Sewage and Other Systems | 160 | 0.31 | $ 25.22 | $ 52,450 |
| Utility System Construction | 880 | 0.16 | $ 25.13 | $ 52,270 |
| Other Professional, Scientific, and Technical Services | (8) | (8) | $ 23.64 | $ 49,180 |
| Architectural, Engineering, and Related Services | 80 | 0.01 | $ 23.62 | $ 49,130 |
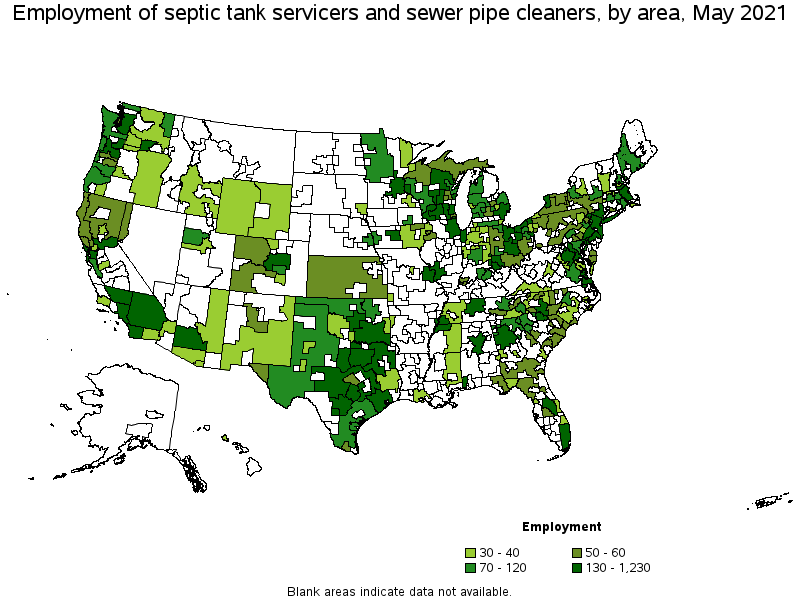
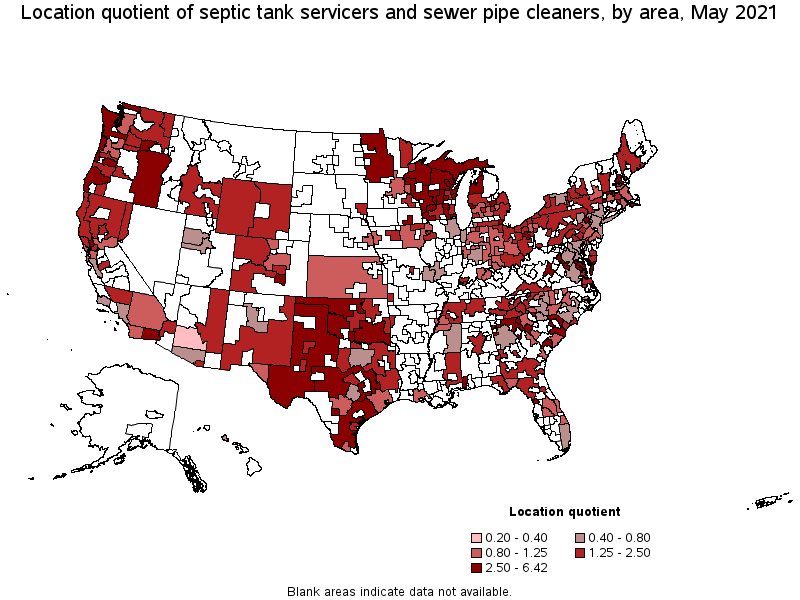
States and areas with the highest published employment, location quotients, and wages for Septic Tank Servicers and Sewer Pipe Cleaners are provided. For a list of all areas with employment in Septic Tank Servicers and Sewer Pipe Cleaners, see the Create Customized Tables function.
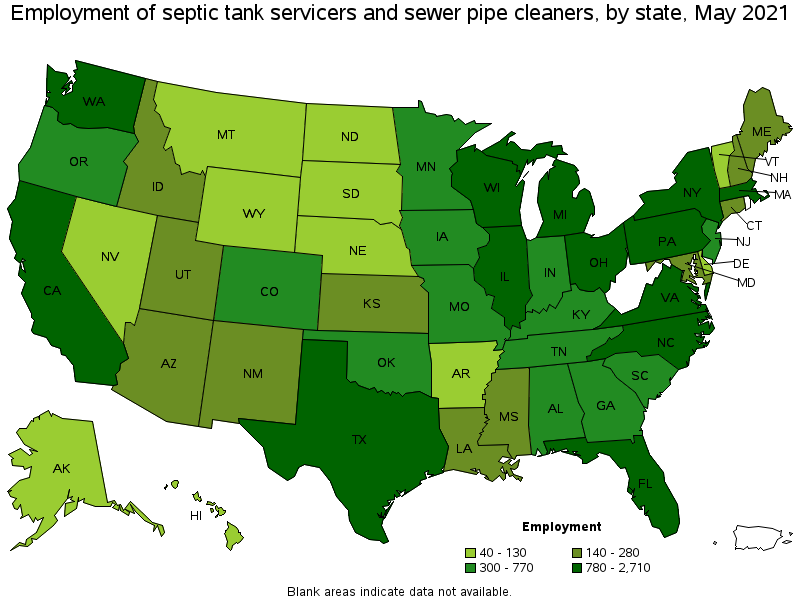
States with the highest employment level in Septic Tank Servicers and Sewer Pipe Cleaners:
| State | Employment (1) | Employment per thousand jobs | Location quotient (9) | Hourly mean wage | Annual mean wage (2) |
|---|---|---|---|---|---|
| California | 2,710 | 0.16 | 0.81 | $ 25.32 | $ 52,660 |
| Texas | 2,390 | 0.20 | 0.96 | $ 17.56 | $ 36,530 |
| Michigan | 1,470 | 0.36 | 1.78 | $ 20.56 | $ 42,760 |
| New York | 1,440 | 0.17 | 0.82 | $ 22.36 | $ 46,510 |
| Wisconsin | 1,420 | 0.52 | 2.54 | $ 23.42 | $ 48,710 |
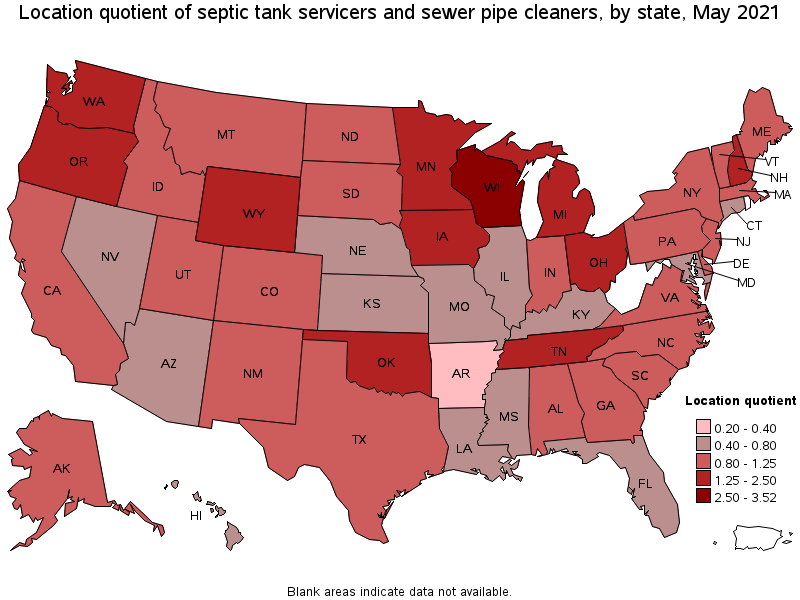
States with the highest concentration of jobs and location quotients in Septic Tank Servicers and Sewer Pipe Cleaners:
| State | Employment (1) | Employment per thousand jobs | Location quotient (9) | Hourly mean wage | Annual mean wage (2) |
|---|---|---|---|---|---|
| Wisconsin | 1,420 | 0.52 | 2.54 | $ 23.42 | $ 48,710 |
| Oklahoma | 770 | 0.49 | 2.43 | $ 18.21 | $ 37,870 |
| Wyoming | 110 | 0.42 | 2.08 | $ 18.42 | $ 38,310 |
| Oregon | 670 | 0.37 | 1.81 | $ 26.40 | $ 54,920 |
| Michigan | 1,470 | 0.36 | 1.78 | $ 20.56 | $ 42,760 |
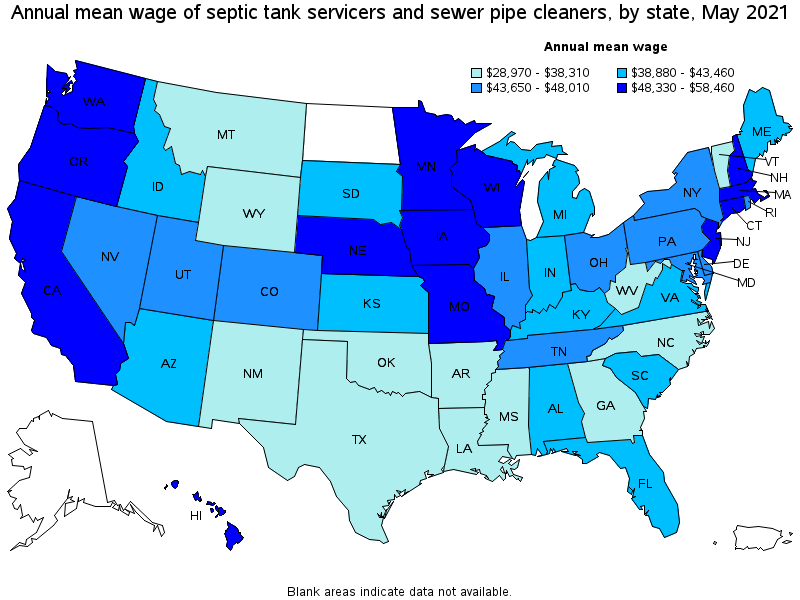
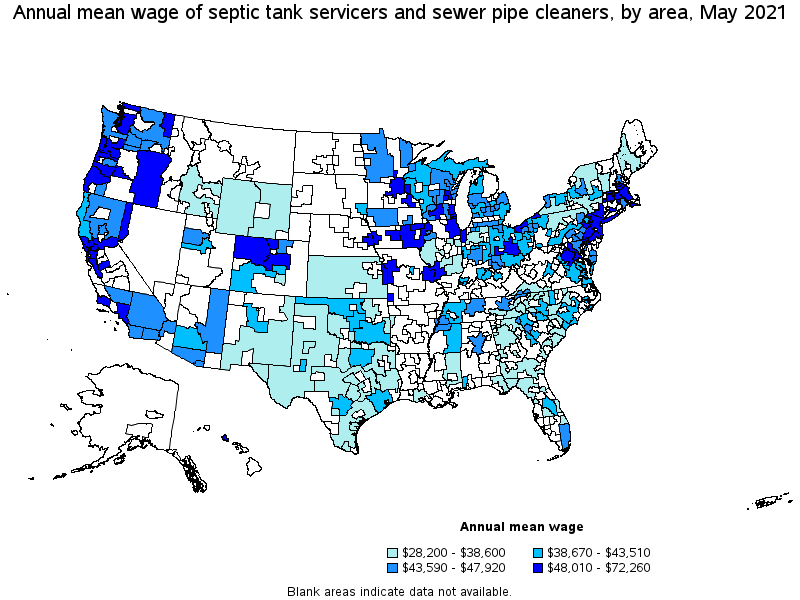
Top paying states for Septic Tank Servicers and Sewer Pipe Cleaners:
| State | Employment (1) | Employment per thousand jobs | Location quotient (9) | Hourly mean wage | Annual mean wage (2) |
|---|---|---|---|---|---|
| Hawaii | 70 | 0.13 | 0.64 | $ 28.10 | $ 58,460 |
| New Jersey | 650 | 0.17 | 0.83 | $ 27.18 | $ 56,530 |
| Massachusetts | 780 | 0.23 | 1.13 | $ 26.49 | $ 55,110 |
| Oregon | 670 | 0.37 | 1.81 | $ 26.40 | $ 54,920 |
| Washington | 1,100 | 0.34 | 1.69 | $ 25.65 | $ 53,350 |
Metropolitan areas with the highest employment level in Septic Tank Servicers and Sewer Pipe Cleaners:
| Metropolitan area | Employment (1) | Employment per thousand jobs | Location quotient (9) | Hourly mean wage | Annual mean wage (2) |
|---|---|---|---|---|---|
| New York-Newark-Jersey City, NY-NJ-PA | 1,230 | 0.14 | 0.70 | $ 25.48 | $ 53,000 |
| Detroit-Warren-Dearborn, MI | 560 | 0.31 | 1.53 | $ 20.71 | $ 43,070 |
| Philadelphia-Camden-Wilmington, PA-NJ-DE-MD | 540 | 0.20 | 1.00 | $ 25.13 | $ 52,280 |
| Houston-The Woodlands-Sugar Land, TX | 540 | 0.18 | 0.91 | $ 18.90 | $ 39,310 |
| Chicago-Naperville-Elgin, IL-IN-WI | 520 | 0.12 | 0.61 | $ 23.82 | $ 49,540 |
| Boston-Cambridge-Nashua, MA-NH | 520 | 0.20 | 0.99 | $ 27.38 | $ 56,960 |
| Los Angeles-Long Beach-Anaheim, CA | 510 | 0.09 | 0.44 | $ 24.21 | $ 50,350 |
| Seattle-Tacoma-Bellevue, WA | 460 | 0.24 | 1.17 | $ 27.37 | $ 56,930 |
| Minneapolis-St. Paul-Bloomington, MN-WI | 420 | 0.23 | 1.15 | $ 25.31 | $ 52,650 |
| San Francisco-Oakland-Hayward, CA | 390 | 0.17 | 0.86 | $ 34.74 | $ 72,260 |
Metropolitan areas with the highest concentration of jobs and location quotients in Septic Tank Servicers and Sewer Pipe Cleaners:
| Metropolitan area | Employment (1) | Employment per thousand jobs | Location quotient (9) | Hourly mean wage | Annual mean wage (2) |
|---|---|---|---|---|---|
| Kennewick-Richland, WA | 150 | 1.30 | 6.42 | $ 22.81 | $ 47,450 |
| Bellingham, WA | 90 | 1.06 | 5.24 | $ 28.84 | $ 59,980 |
| Albany, OR | 50 | 1.05 | 5.15 | $ 22.65 | $ 47,120 |
| Homosassa Springs, FL | 30 | 1.02 | 5.04 | $ 16.35 | $ 34,010 |
| Monroe, MI | 30 | 0.95 | 4.69 | $ 18.98 | $ 39,490 |
| East Stroudsburg, PA | 50 | 0.89 | 4.41 | $ 19.86 | $ 41,310 |
| Mobile, AL | 140 | 0.87 | 4.28 | $ 19.74 | $ 41,050 |
| Napa, CA | 60 | 0.83 | 4.09 | $ 26.86 | $ 55,870 |
| Waterloo-Cedar Falls, IA | 70 | 0.78 | 3.86 | $ 23.04 | $ 47,920 |
| Muskegon, MI | 40 | 0.76 | 3.75 | $ 21.50 | $ 44,730 |
Top paying metropolitan areas for Septic Tank Servicers and Sewer Pipe Cleaners:
| Metropolitan area | Employment (1) | Employment per thousand jobs | Location quotient (9) | Hourly mean wage | Annual mean wage (2) |
|---|---|---|---|---|---|
| San Francisco-Oakland-Hayward, CA | 390 | 0.17 | 0.86 | $ 34.74 | $ 72,260 |
| Vallejo-Fairfield, CA | 40 | 0.33 | 1.64 | $ 31.40 | $ 65,320 |
| Joplin, MO | 30 | 0.42 | 2.08 | $ 31.35 | $ 65,210 |
| San Jose-Sunnyvale-Santa Clara, CA | 120 | 0.11 | 0.56 | $ 29.10 | $ 60,530 |
| Bellingham, WA | 90 | 1.06 | 5.24 | $ 28.84 | $ 59,980 |
| Portland-Vancouver-Hillsboro, OR-WA | 250 | 0.22 | 1.10 | $ 28.33 | $ 58,920 |
| Santa Maria-Santa Barbara, CA | 30 | 0.15 | 0.76 | $ 27.49 | $ 57,180 |
| Boston-Cambridge-Nashua, MA-NH | 520 | 0.20 | 0.99 | $ 27.38 | $ 56,960 |
| Seattle-Tacoma-Bellevue, WA | 460 | 0.24 | 1.17 | $ 27.37 | $ 56,930 |
| Bend-Redmond, OR | 30 | 0.37 | 1.83 | $ 26.86 | $ 55,870 |
Nonmetropolitan areas with the highest employment in Septic Tank Servicers and Sewer Pipe Cleaners:
| Nonmetropolitan area | Employment (1) | Employment per thousand jobs | Location quotient (9) | Hourly mean wage | Annual mean wage (2) |
|---|---|---|---|---|---|
| Northeastern Wisconsin nonmetropolitan area | 210 | 1.09 | 5.35 | $ 22.68 | $ 47,180 |
| South Central Wisconsin nonmetropolitan area | 160 | 0.79 | 3.90 | $ 21.76 | $ 45,260 |
| Hill Country Region of Texas nonmetropolitan area | 160 | 0.83 | 4.08 | $ 15.64 | $ 32,530 |
| Southeast Oklahoma nonmetropolitan area | 140 | 0.89 | 4.38 | $ 18.83 | $ 39,160 |
| North Northeastern Ohio nonmetropolitan area (noncontiguous) | 140 | 0.45 | 2.24 | $ 20.06 | $ 41,720 |
Nonmetropolitan areas with the highest concentration of jobs and location quotients in Septic Tank Servicers and Sewer Pipe Cleaners:
| Nonmetropolitan area | Employment (1) | Employment per thousand jobs | Location quotient (9) | Hourly mean wage | Annual mean wage (2) |
|---|---|---|---|---|---|
| Northwestern Wisconsin nonmetropolitan area | 60 | 1.18 | 5.81 | $ 20.36 | $ 42,350 |
| Northwest Oklahoma nonmetropolitan area | 110 | 1.14 | 5.64 | $ 18.59 | $ 38,670 |
| Coast Oregon nonmetropolitan area | 120 | 1.12 | 5.49 | $ 24.93 | $ 51,850 |
| Northeastern Wisconsin nonmetropolitan area | 210 | 1.09 | 5.35 | $ 22.68 | $ 47,180 |
| Upper Savannah South Carolina nonmetropolitan area | 70 | 0.94 | 4.61 | $ 22.00 | $ 45,760 |
Top paying nonmetropolitan areas for Septic Tank Servicers and Sewer Pipe Cleaners:
| Nonmetropolitan area | Employment (1) | Employment per thousand jobs | Location quotient (9) | Hourly mean wage | Annual mean wage (2) |
|---|---|---|---|---|---|
| Massachusetts nonmetropolitan area | 30 | 0.58 | 2.84 | $ 25.21 | $ 52,450 |
| Coast Oregon nonmetropolitan area | 120 | 1.12 | 5.49 | $ 24.93 | $ 51,850 |
| Eastern Oregon nonmetropolitan area | 40 | 0.62 | 3.04 | $ 24.85 | $ 51,690 |
| Northwest Colorado nonmetropolitan area | 50 | 0.46 | 2.27 | $ 24.03 | $ 49,990 |
| Southeast Iowa nonmetropolitan area | 40 | 0.21 | 1.04 | $ 23.11 | $ 48,060 |
These estimates are calculated with data collected from employers in all industry sectors, all metropolitan and nonmetropolitan areas, and all states and the District of Columbia. The top employment and wage figures are provided above. The complete list is available in the downloadable XLS files.
The percentile wage estimate is the value of a wage below which a certain percent of workers fall. The median wage is the 50th percentile wage estimate—50 percent of workers earn less than the median and 50 percent of workers earn more than the median. More about percentile wages.
(1) Estimates for detailed occupations do not sum to the totals because the totals include occupations not shown separately. Estimates do not include self-employed workers.
(2) Annual wages have been calculated by multiplying the hourly mean wage by a "year-round, full-time" hours figure of 2,080 hours; for those occupations where there is not an hourly wage published, the annual wage has been directly calculated from the reported survey data.
(3) The relative standard error (RSE) is a measure of the reliability of a survey statistic. The smaller the relative standard error, the more precise the estimate.
(8) Estimate not released.
(9) The location quotient is the ratio of the area concentration of occupational employment to the national average concentration. A location quotient greater than one indicates the occupation has a higher share of employment than average, and a location quotient less than one indicates the occupation is less prevalent in the area than average.
Other OEWS estimates and related information:
May 2021 National Occupational Employment and Wage Estimates
May 2021 State Occupational Employment and Wage Estimates
May 2021 Metropolitan and Nonmetropolitan Area Occupational Employment and Wage Estimates
May 2021 National Industry-Specific Occupational Employment and Wage Estimates
Last Modified Date: March 31, 2022