
An official website of the United States government
An official website of the United States government
The .gov means it's official.
Federal government websites often end in .gov or .mil. Before sharing sensitive information,
make sure you're on a federal government site.
The site is secure.
The
https:// ensures that you are connecting to the official website and that any
information you provide is encrypted and transmitted securely.
Inspect, test, repair, or maintain electrical equipment in generating stations, substations, and in-service relays.
Employment estimate and mean wage estimates for Electrical and Electronics Repairers, Powerhouse, Substation, and Relay:
| Employment (1) | Employment RSE (3) |
Mean hourly wage |
Mean annual wage (2) |
Wage RSE (3) |
|---|---|---|---|---|
| 22,490 | 2.5 % | $ 42.13 | $ 87,640 | 0.9 % |
Percentile wage estimates for Electrical and Electronics Repairers, Powerhouse, Substation, and Relay:
| Percentile | 10% | 25% | 50% (Median) |
75% | 90% |
|---|---|---|---|---|---|
| Hourly Wage | $ 28.63 | $ 36.61 | $ 44.91 | $ 48.88 | $ 57.69 |
| Annual Wage (2) | $ 59,540 | $ 76,140 | $ 93,420 | $ 101,680 | $ 120,000 |
Industries with the highest published employment and wages for Electrical and Electronics Repairers, Powerhouse, Substation, and Relay are provided. For a list of all industries with employment in Electrical and Electronics Repairers, Powerhouse, Substation, and Relay, see the Create Customized Tables function.
Industries with the highest levels of employment in Electrical and Electronics Repairers, Powerhouse, Substation, and Relay:
| Industry | Employment (1) | Percent of industry employment | Hourly mean wage | Annual mean wage (2) |
|---|---|---|---|---|
| Electric Power Generation, Transmission and Distribution | 14,220 | 3.78 | $ 44.63 | $ 92,820 |
| Local Government, excluding schools and hospitals (OEWS Designation) | 3,340 | 0.06 | $ 40.00 | $ 83,190 |
| Utility System Construction | 1,030 | 0.19 | $ 37.72 | $ 78,450 |
| Management of Companies and Enterprises | 540 | 0.02 | $ 32.38 | $ 67,360 |
| Commercial and Industrial Machinery and Equipment (except Automotive and Electronic) Repair and Maintenance | 510 | 0.24 | $ 30.78 | $ 64,030 |
Industries with the highest concentration of employment in Electrical and Electronics Repairers, Powerhouse, Substation, and Relay:
| Industry | Employment (1) | Percent of industry employment | Hourly mean wage | Annual mean wage (2) |
|---|---|---|---|---|
| Electric Power Generation, Transmission and Distribution | 14,220 | 3.78 | $ 44.63 | $ 92,820 |
| Natural Gas Distribution | 260 | 0.24 | $ 41.43 | $ 86,170 |
| Commercial and Industrial Machinery and Equipment (except Automotive and Electronic) Repair and Maintenance | 510 | 0.24 | $ 30.78 | $ 64,030 |
| Pipeline Transportation of Natural Gas | 70 | 0.22 | $ 41.85 | $ 87,050 |
| Utility System Construction | 1,030 | 0.19 | $ 37.72 | $ 78,450 |
Top paying industries for Electrical and Electronics Repairers, Powerhouse, Substation, and Relay:
| Industry | Employment (1) | Percent of industry employment | Hourly mean wage | Annual mean wage (2) |
|---|---|---|---|---|
| Electric Power Generation, Transmission and Distribution | 14,220 | 3.78 | $ 44.63 | $ 92,820 |
| Federal Executive Branch (OEWS Designation) | 380 | 0.02 | $ 44.06 | $ 91,640 |
| Pipeline Transportation of Natural Gas | 70 | 0.22 | $ 41.85 | $ 87,050 |
| Natural Gas Distribution | 260 | 0.24 | $ 41.43 | $ 86,170 |
| Architectural, Engineering, and Related Services | 370 | 0.02 | $ 41.23 | $ 85,760 |
States and areas with the highest published employment, location quotients, and wages for Electrical and Electronics Repairers, Powerhouse, Substation, and Relay are provided. For a list of all areas with employment in Electrical and Electronics Repairers, Powerhouse, Substation, and Relay, see the Create Customized Tables function.
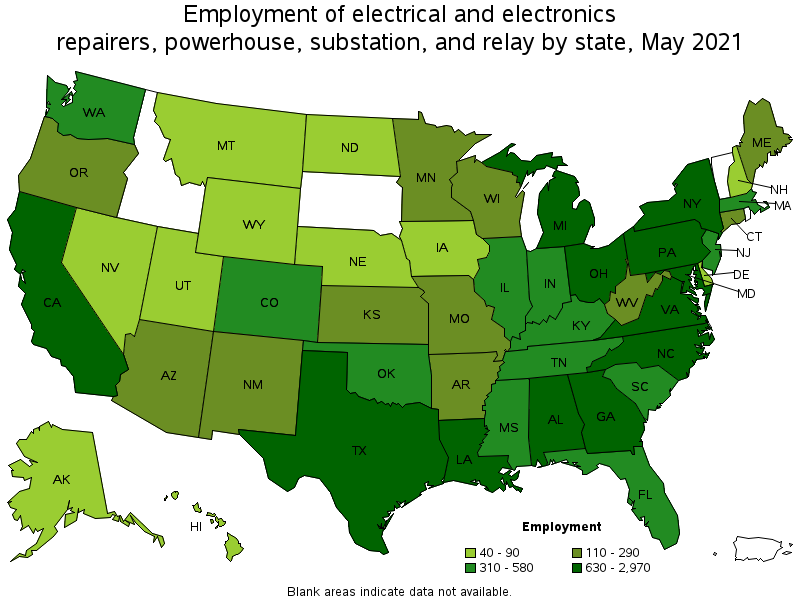
States with the highest employment level in Electrical and Electronics Repairers, Powerhouse, Substation, and Relay:
| State | Employment (1) | Employment per thousand jobs | Location quotient (9) | Hourly mean wage | Annual mean wage (2) |
|---|---|---|---|---|---|
| New York | 2,970 | 0.34 | 2.15 | $ 42.45 | $ 88,290 |
| Texas | 2,090 | 0.17 | 1.07 | $ 37.67 | $ 78,350 |
| California | 1,760 | 0.11 | 0.67 | $ 50.83 | $ 105,730 |
| Michigan | 1,190 | 0.29 | 1.84 | $ 43.48 | $ 90,430 |
| Pennsylvania | 1,010 | 0.18 | 1.13 | $ 39.57 | $ 82,310 |
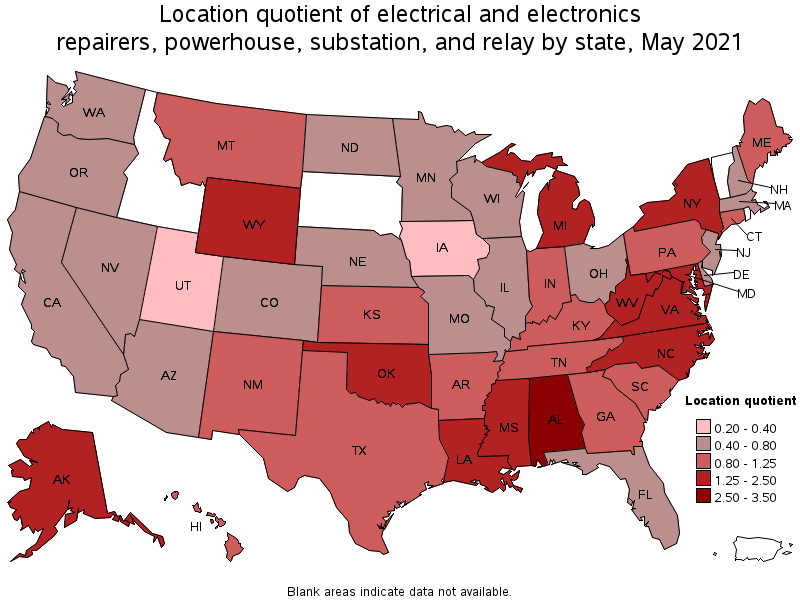
States with the highest concentration of jobs and location quotients in Electrical and Electronics Repairers, Powerhouse, Substation, and Relay:
| State | Employment (1) | Employment per thousand jobs | Location quotient (9) | Hourly mean wage | Annual mean wage (2) |
|---|---|---|---|---|---|
| Alabama | 900 | 0.46 | 2.91 | $ 45.57 | $ 94,790 |
| Louisiana | 670 | 0.37 | 2.34 | $ 32.05 | $ 66,670 |
| New York | 2,970 | 0.34 | 2.15 | $ 42.45 | $ 88,290 |
| Oklahoma | 510 | 0.33 | 2.05 | $ 35.78 | $ 74,420 |
| Michigan | 1,190 | 0.29 | 1.84 | $ 43.48 | $ 90,430 |
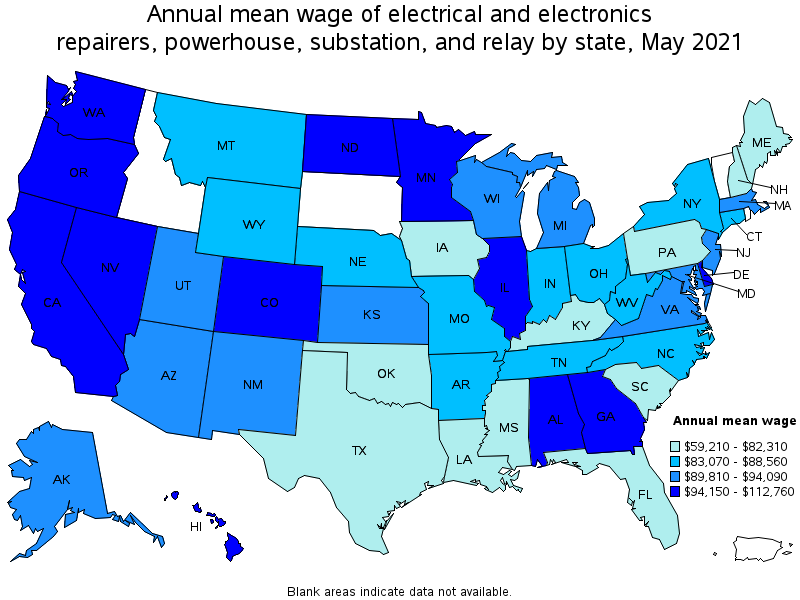
Top paying states for Electrical and Electronics Repairers, Powerhouse, Substation, and Relay:
| State | Employment (1) | Employment per thousand jobs | Location quotient (9) | Hourly mean wage | Annual mean wage (2) |
|---|---|---|---|---|---|
| Oregon | 210 | 0.12 | 0.72 | $ 54.21 | $ 112,760 |
| Hawaii | 90 | 0.16 | 1.02 | $ 51.41 | $ 106,930 |
| Minnesota | 230 | 0.08 | 0.53 | $ 51.10 | $ 106,280 |
| California | 1,760 | 0.11 | 0.67 | $ 50.83 | $ 105,730 |
| Washington | 310 | 0.10 | 0.61 | $ 48.94 | $ 101,790 |
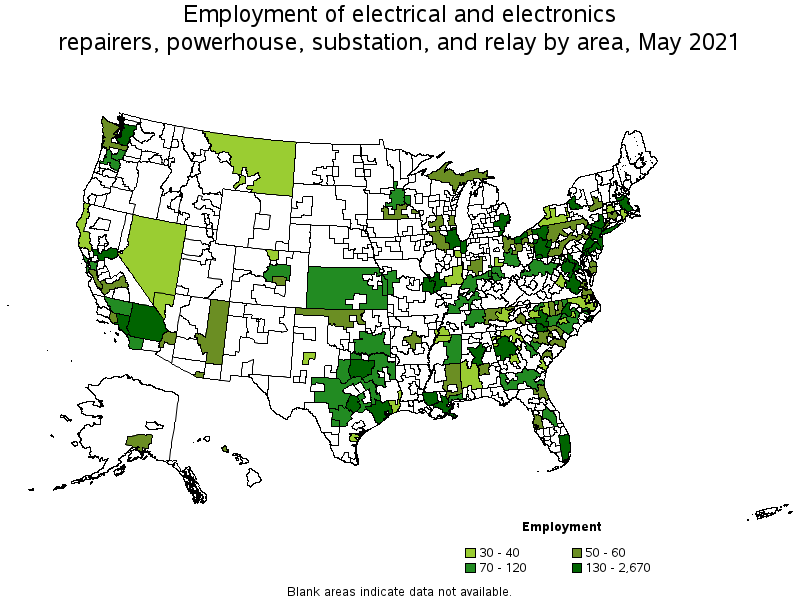
Metropolitan areas with the highest employment level in Electrical and Electronics Repairers, Powerhouse, Substation, and Relay:
| Metropolitan area | Employment (1) | Employment per thousand jobs | Location quotient (9) | Hourly mean wage | Annual mean wage (2) |
|---|---|---|---|---|---|
| New York-Newark-Jersey City, NY-NJ-PA | 2,670 | 0.31 | 1.92 | $ 42.67 | $ 88,750 |
| Washington-Arlington-Alexandria, DC-VA-MD-WV | 540 | 0.18 | 1.15 | $ 42.89 | $ 89,210 |
| Los Angeles-Long Beach-Anaheim, CA | 510 | 0.09 | 0.56 | $ 52.55 | $ 109,290 |
| Detroit-Warren-Dearborn, MI | 420 | 0.23 | 1.46 | $ 44.23 | $ 92,000 |
| Houston-The Woodlands-Sugar Land, TX | 380 | 0.13 | 0.83 | $ 39.61 | $ 82,390 |
| Dallas-Fort Worth-Arlington, TX | 380 | 0.11 | 0.67 | $ 38.42 | $ 79,910 |
| Birmingham-Hoover, AL | 370 | 0.76 | 4.77 | $ 46.75 | $ 97,230 |
| Atlanta-Sandy Springs-Roswell, GA | 360 | 0.14 | 0.88 | $ 49.35 | $ 102,650 |
| Riverside-San Bernardino-Ontario, CA | 320 | 0.21 | 1.30 | $ 52.56 | $ 109,320 |
| Austin-Round Rock, TX | 310 | 0.29 | 1.80 | $ 42.62 | $ 88,660 |
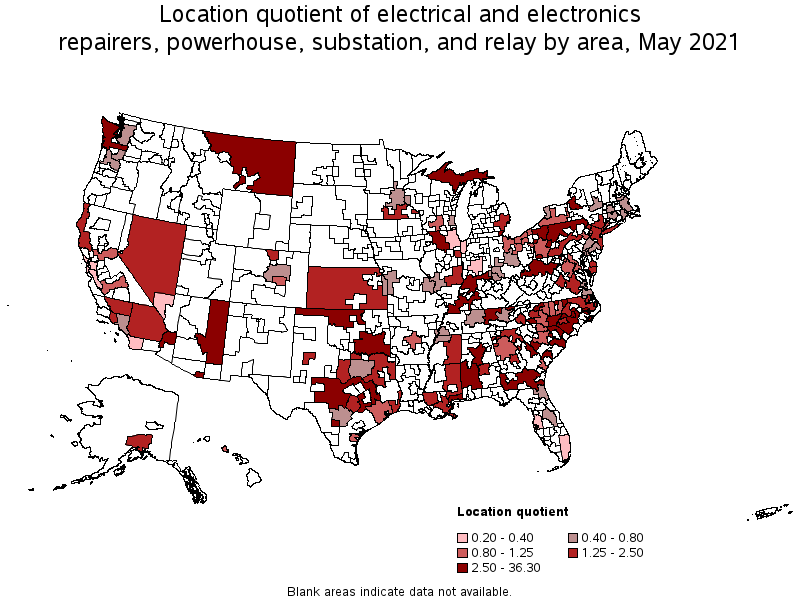
Metropolitan areas with the highest concentration of jobs and location quotients in Electrical and Electronics Repairers, Powerhouse, Substation, and Relay:
| Metropolitan area | Employment (1) | Employment per thousand jobs | Location quotient (9) | Hourly mean wage | Annual mean wage (2) |
|---|---|---|---|---|---|
| Monroe, MI | 210 | 5.79 | 36.30 | $ 47.02 | $ 97,800 |
| Goldsboro, NC | 40 | 1.10 | 6.90 | $ 39.55 | $ 82,260 |
| Syracuse, NY | 250 | 0.89 | 5.56 | $ 43.88 | $ 91,270 |
| Birmingham-Hoover, AL | 370 | 0.76 | 4.77 | $ 46.75 | $ 97,230 |
| Augusta-Richmond County, GA-SC | 110 | 0.50 | 3.15 | $ 45.26 | $ 94,140 |
| Gulfport-Biloxi-Pascagoula, MS | 70 | 0.50 | 3.13 | $ 39.09 | $ 81,310 |
| Montgomery, AL | 60 | 0.38 | 2.38 | $ 42.53 | $ 88,470 |
| New Orleans-Metairie, LA | 190 | 0.37 | 2.34 | $ 34.40 | $ 71,560 |
| Baton Rouge, LA | 140 | 0.37 | 2.32 | $ 33.11 | $ 68,860 |
| Charlottesville, VA | 40 | 0.33 | 2.06 | $ 44.09 | $ 91,710 |
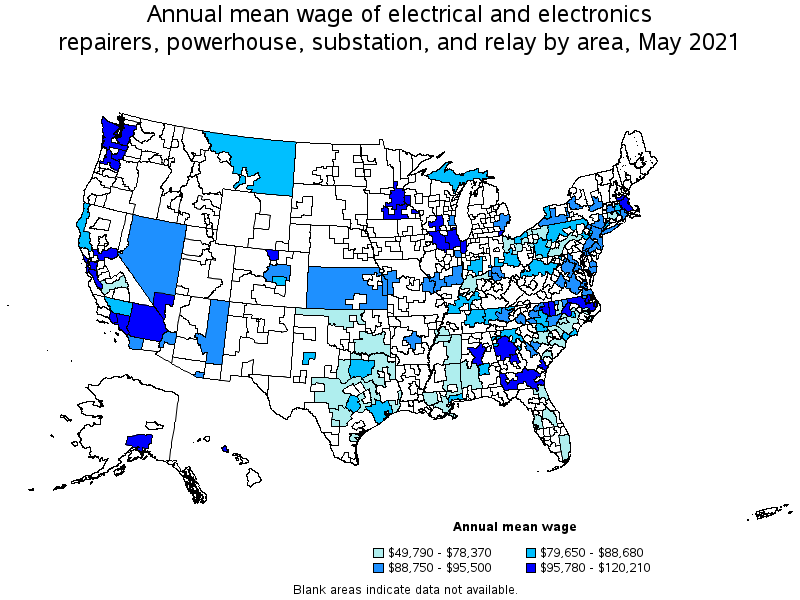
Top paying metropolitan areas for Electrical and Electronics Repairers, Powerhouse, Substation, and Relay:
| Metropolitan area | Employment (1) | Employment per thousand jobs | Location quotient (9) | Hourly mean wage | Annual mean wage (2) |
|---|---|---|---|---|---|
| Portland-Vancouver-Hillsboro, OR-WA | 110 | 0.10 | 0.60 | $ 57.79 | $ 120,210 |
| Sacramento--Roseville--Arden-Arcade, CA | 160 | 0.16 | 1.00 | $ 56.97 | $ 118,510 |
| Oxnard-Thousand Oaks-Ventura, CA | 60 | 0.20 | 1.28 | $ 54.94 | $ 114,280 |
| San Jose-Sunnyvale-Santa Clara, CA | 60 | 0.06 | 0.35 | $ 53.96 | $ 112,230 |
| San Francisco-Oakland-Hayward, CA | 120 | 0.05 | 0.32 | $ 53.32 | $ 110,910 |
| Minneapolis-St. Paul-Bloomington, MN-WI | 120 | 0.06 | 0.40 | $ 53.02 | $ 110,280 |
| Riverside-San Bernardino-Ontario, CA | 320 | 0.21 | 1.30 | $ 52.56 | $ 109,320 |
| Los Angeles-Long Beach-Anaheim, CA | 510 | 0.09 | 0.56 | $ 52.55 | $ 109,290 |
| Seattle-Tacoma-Bellevue, WA | 170 | 0.09 | 0.56 | $ 52.18 | $ 108,540 |
| Macon, GA | 30 | 0.32 | 2.02 | $ 51.53 | $ 107,180 |
Nonmetropolitan areas with the highest employment in Electrical and Electronics Repairers, Powerhouse, Substation, and Relay:
| Nonmetropolitan area | Employment (1) | Employment per thousand jobs | Location quotient (9) | Hourly mean wage | Annual mean wage (2) |
|---|---|---|---|---|---|
| Western Pennsylvania nonmetropolitan area | 170 | 1.22 | 7.61 | $ 33.44 | $ 69,550 |
| Northern West Virginia nonmetropolitan area | 120 | 0.96 | 6.01 | $ 42.59 | $ 88,590 |
| Southern Indiana nonmetropolitan area | 110 | 0.62 | 3.88 | $ 37.51 | $ 78,010 |
| Kansas nonmetropolitan area | 110 | 0.29 | 1.83 | $ 43.91 | $ 91,340 |
| Southeast Coastal North Carolina nonmetropolitan area | 110 | 0.45 | 2.84 | $ 26.45 | $ 55,020 |
Nonmetropolitan areas with the highest concentration of jobs and location quotients in Electrical and Electronics Repairers, Powerhouse, Substation, and Relay:
| Nonmetropolitan area | Employment (1) | Employment per thousand jobs | Location quotient (9) | Hourly mean wage | Annual mean wage (2) |
|---|---|---|---|---|---|
| Western Pennsylvania nonmetropolitan area | 170 | 1.22 | 7.61 | $ 33.44 | $ 69,550 |
| Northern West Virginia nonmetropolitan area | 120 | 0.96 | 6.01 | $ 42.59 | $ 88,590 |
| Northwest Oklahoma nonmetropolitan area | 60 | 0.66 | 4.10 | $ 37.49 | $ 77,980 |
| Southern Indiana nonmetropolitan area | 110 | 0.62 | 3.88 | $ 37.51 | $ 78,010 |
| Southwest Alabama nonmetropolitan area | 40 | 0.58 | 3.62 | $ 37.68 | $ 78,370 |
Top paying nonmetropolitan areas for Electrical and Electronics Repairers, Powerhouse, Substation, and Relay:
| Nonmetropolitan area | Employment (1) | Employment per thousand jobs | Location quotient (9) | Hourly mean wage | Annual mean wage (2) |
|---|---|---|---|---|---|
| Northwest Illinois nonmetropolitan area | 60 | 0.45 | 2.85 | $ 57.54 | $ 119,690 |
| Southeast Minnesota nonmetropolitan area | 50 | 0.31 | 1.94 | $ 53.22 | $ 110,690 |
| Western Washington nonmetropolitan area | 50 | 0.40 | 2.51 | $ 47.43 | $ 98,660 |
| South Georgia nonmetropolitan area | 90 | 0.48 | 3.01 | $ 46.22 | $ 96,130 |
| Northeast Coastal North Carolina nonmetropolitan area | 30 | 0.34 | 2.14 | $ 46.17 | $ 96,030 |
These estimates are calculated with data collected from employers in all industry sectors, all metropolitan and nonmetropolitan areas, and all states and the District of Columbia. The top employment and wage figures are provided above. The complete list is available in the downloadable XLS files.
The percentile wage estimate is the value of a wage below which a certain percent of workers fall. The median wage is the 50th percentile wage estimate—50 percent of workers earn less than the median and 50 percent of workers earn more than the median. More about percentile wages.
(1) Estimates for detailed occupations do not sum to the totals because the totals include occupations not shown separately. Estimates do not include self-employed workers.
(2) Annual wages have been calculated by multiplying the hourly mean wage by a "year-round, full-time" hours figure of 2,080 hours; for those occupations where there is not an hourly wage published, the annual wage has been directly calculated from the reported survey data.
(3) The relative standard error (RSE) is a measure of the reliability of a survey statistic. The smaller the relative standard error, the more precise the estimate.
(9) The location quotient is the ratio of the area concentration of occupational employment to the national average concentration. A location quotient greater than one indicates the occupation has a higher share of employment than average, and a location quotient less than one indicates the occupation is less prevalent in the area than average.
Other OEWS estimates and related information:
May 2021 National Occupational Employment and Wage Estimates
May 2021 State Occupational Employment and Wage Estimates
May 2021 Metropolitan and Nonmetropolitan Area Occupational Employment and Wage Estimates
May 2021 National Industry-Specific Occupational Employment and Wage Estimates
Last Modified Date: March 31, 2022