
An official website of the United States government
An official website of the United States government
The .gov means it's official.
Federal government websites often end in .gov or .mil. Before sharing sensitive information,
make sure you're on a federal government site.
The site is secure.
The
https:// ensures that you are connecting to the official website and that any
information you provide is encrypted and transmitted securely.
Repair, install, adjust, or maintain industrial production and processing machinery or refinery and pipeline distribution systems. May also install, dismantle, or move machinery and heavy equipment according to plans. Excludes �Mobile Heavy Equipment Mechanics, Except Engines� (49-3042), and �Maintenance Workers, Machinery� (49-9043).
Employment estimate and mean wage estimates for Industrial Machinery Mechanics:
| Employment (1) | Employment RSE (3) |
Mean hourly wage |
Mean annual wage (2) |
Wage RSE (3) |
|---|---|---|---|---|
| 373,090 | 0.7 % | $ 28.26 | $ 58,780 | 0.3 % |
Percentile wage estimates for Industrial Machinery Mechanics:
| Percentile | 10% | 25% | 50% (Median) |
75% | 90% |
|---|---|---|---|---|---|
| Hourly Wage | $ 17.97 | $ 22.72 | $ 28.77 | $ 32.43 | $ 38.11 |
| Annual Wage (2) | $ 37,370 | $ 47,260 | $ 59,840 | $ 67,460 | $ 79,270 |
Industries with the highest published employment and wages for Industrial Machinery Mechanics are provided. For a list of all industries with employment in Industrial Machinery Mechanics, see the Create Customized Tables function.
Industries with the highest levels of employment in Industrial Machinery Mechanics:
| Industry | Employment (1) | Percent of industry employment | Hourly mean wage | Annual mean wage (2) |
|---|---|---|---|---|
| Commercial and Industrial Machinery and Equipment (except Automotive and Electronic) Repair and Maintenance | 42,330 | 20.22 | $ 25.39 | $ 52,820 |
| Machinery, Equipment, and Supplies Merchant Wholesalers | 38,200 | 5.63 | $ 27.84 | $ 57,910 |
| Plastics Product Manufacturing | 14,470 | 2.48 | $ 26.10 | $ 54,290 |
| Chemical Manufacturing (3251, 3252, 3253, and 3259 only) | 14,090 | 4.01 | $ 32.61 | $ 67,820 |
| Machinery Manufacturing (3331, 3332, 3334, and 3339 only) | 12,410 | 1.77 | $ 27.21 | $ 56,600 |
Industries with the highest concentration of employment in Industrial Machinery Mechanics:
| Industry | Employment (1) | Percent of industry employment | Hourly mean wage | Annual mean wage (2) |
|---|---|---|---|---|
| Commercial and Industrial Machinery and Equipment (except Automotive and Electronic) Repair and Maintenance | 42,330 | 20.22 | $ 25.39 | $ 52,820 |
| Pipeline Transportation of Natural Gas | 3,250 | 10.77 | $ 37.67 | $ 78,360 |
| Pulp, Paper, and Paperboard Mills | 6,350 | 7.26 | $ 34.00 | $ 70,710 |
| Fiber, Yarn, and Thread Mills | 1,670 | 7.00 | $ 20.33 | $ 42,290 |
| Iron and Steel Mills and Ferroalloy Manufacturing | 4,940 | 6.32 | $ 27.36 | $ 56,910 |
Top paying industries for Industrial Machinery Mechanics:
| Industry | Employment (1) | Percent of industry employment | Hourly mean wage | Annual mean wage (2) |
|---|---|---|---|---|
| Electric Power Generation, Transmission and Distribution | 5,810 | 1.54 | $ 43.23 | $ 89,920 |
| Petroleum and Coal Products Manufacturing | 4,420 | 4.28 | $ 41.55 | $ 86,420 |
| Other Pipeline Transportation | 470 | 5.66 | $ 41.37 | $ 86,050 |
| State Government, excluding schools and hospitals (OEWS Designation) | 240 | 0.01 | $ 40.14 | $ 83,500 |
| Pipeline Transportation of Crude Oil | 350 | 3.02 | $ 38.29 | $ 79,640 |
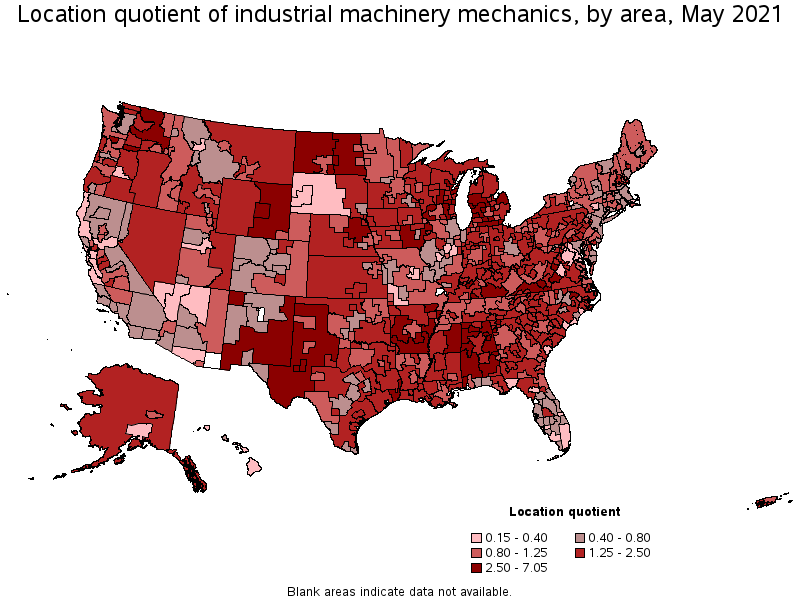
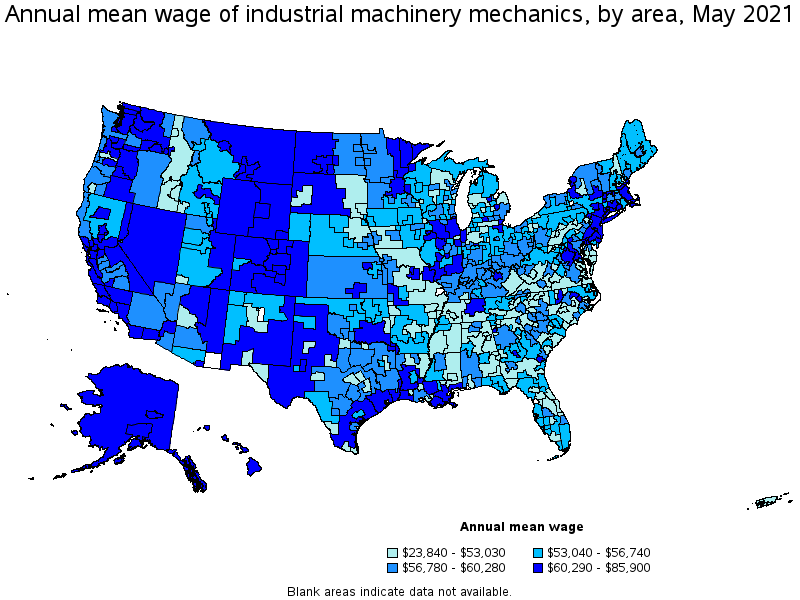
States and areas with the highest published employment, location quotients, and wages for Industrial Machinery Mechanics are provided. For a list of all areas with employment in Industrial Machinery Mechanics, see the Create Customized Tables function.
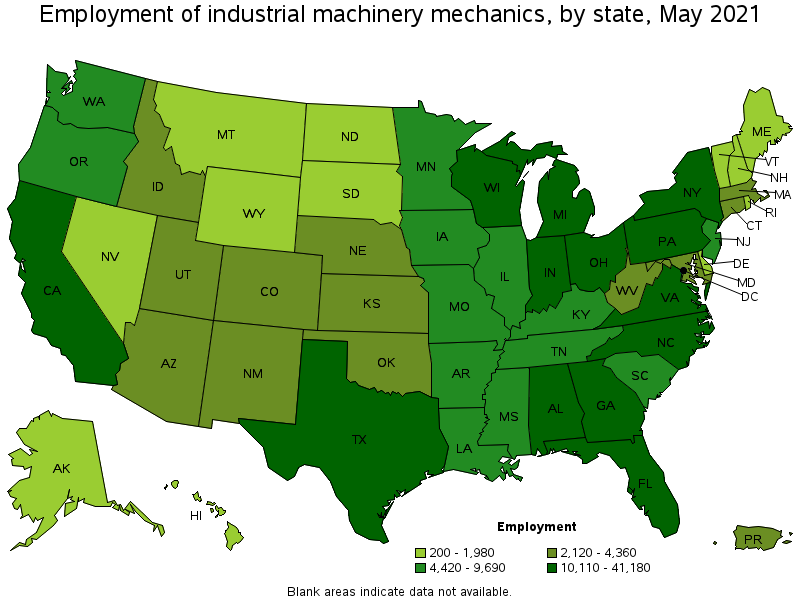
States with the highest employment level in Industrial Machinery Mechanics:
| State | Employment (1) | Employment per thousand jobs | Location quotient (9) | Hourly mean wage | Annual mean wage (2) |
|---|---|---|---|---|---|
| Texas | 41,180 | 3.37 | 1.27 | $ 28.74 | $ 59,780 |
| California | 23,200 | 1.40 | 0.53 | $ 31.59 | $ 65,700 |
| Michigan | 22,120 | 5.45 | 2.06 | $ 27.29 | $ 56,760 |
| Pennsylvania | 18,500 | 3.31 | 1.25 | $ 27.39 | $ 56,980 |
| Ohio | 17,690 | 3.40 | 1.28 | $ 27.74 | $ 57,690 |
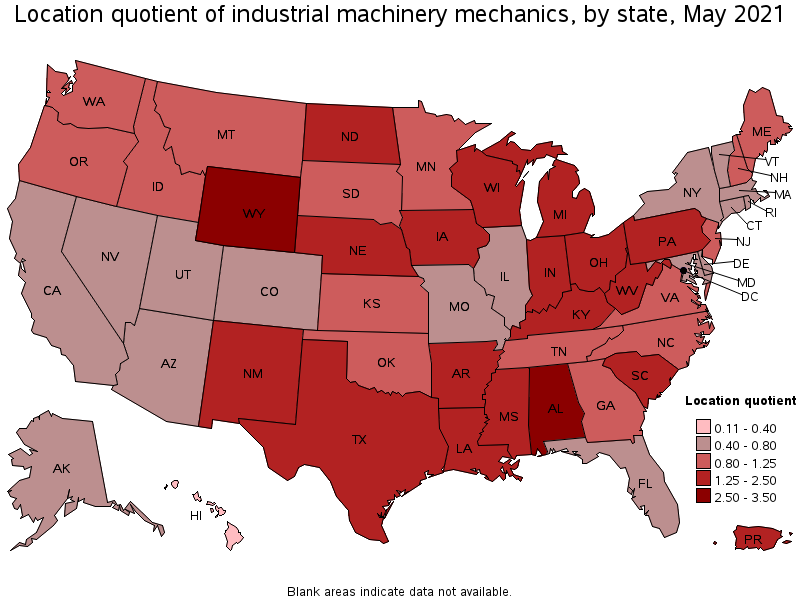
States with the highest concentration of jobs and location quotients in Industrial Machinery Mechanics:
| State | Employment (1) | Employment per thousand jobs | Location quotient (9) | Hourly mean wage | Annual mean wage (2) |
|---|---|---|---|---|---|
| Alabama | 14,400 | 7.47 | 2.82 | $ 25.48 | $ 53,000 |
| Wyoming | 1,840 | 7.07 | 2.67 | $ 35.71 | $ 74,270 |
| Arkansas | 6,800 | 5.71 | 2.16 | $ 25.32 | $ 52,670 |
| Michigan | 22,120 | 5.45 | 2.06 | $ 27.29 | $ 56,760 |
| North Dakota | 1,930 | 4.89 | 1.85 | $ 30.91 | $ 64,290 |
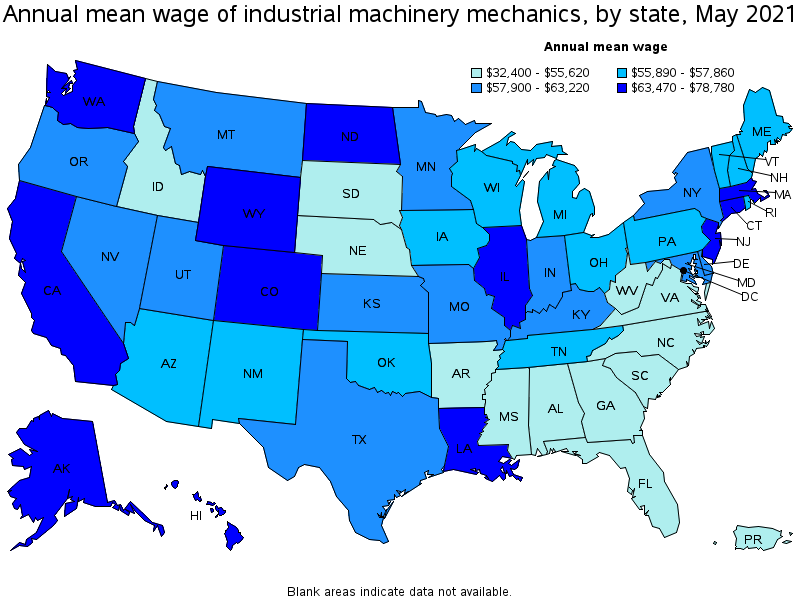
Top paying states for Industrial Machinery Mechanics:
| State | Employment (1) | Employment per thousand jobs | Location quotient (9) | Hourly mean wage | Annual mean wage (2) |
|---|---|---|---|---|---|
| Hawaii | 550 | 1.00 | 0.38 | $ 37.87 | $ 78,780 |
| Alaska | 600 | 2.03 | 0.77 | $ 36.90 | $ 76,740 |
| District of Columbia | 200 | 0.30 | 0.11 | $ 36.28 | $ 75,470 |
| Wyoming | 1,840 | 7.07 | 2.67 | $ 35.71 | $ 74,270 |
| Connecticut | 3,240 | 2.06 | 0.78 | $ 31.82 | $ 66,190 |
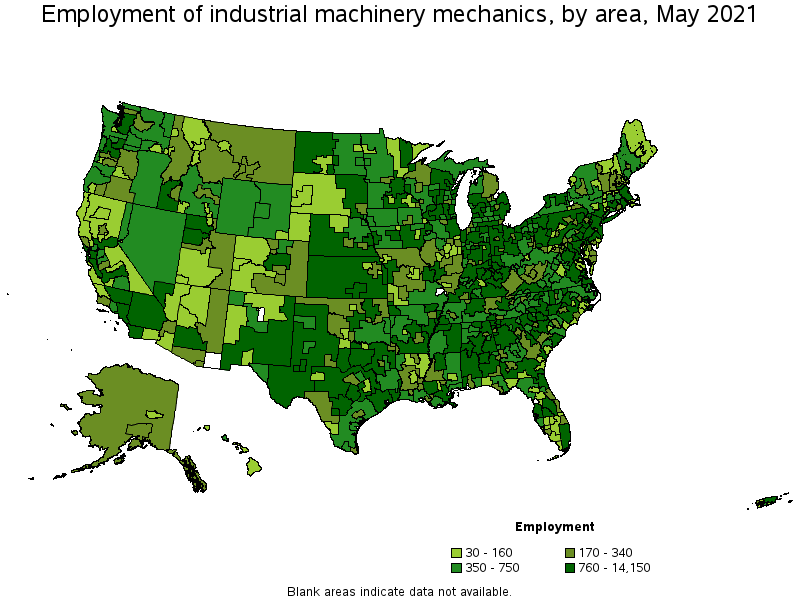
Metropolitan areas with the highest employment level in Industrial Machinery Mechanics:
| Metropolitan area | Employment (1) | Employment per thousand jobs | Location quotient (9) | Hourly mean wage | Annual mean wage (2) |
|---|---|---|---|---|---|
| Houston-The Woodlands-Sugar Land, TX | 14,150 | 4.89 | 1.85 | $ 31.17 | $ 64,840 |
| New York-Newark-Jersey City, NY-NJ-PA | 10,760 | 1.24 | 0.47 | $ 31.62 | $ 65,780 |
| Detroit-Warren-Dearborn, MI | 9,660 | 5.36 | 2.03 | $ 28.17 | $ 58,590 |
| Dallas-Fort Worth-Arlington, TX | 8,630 | 2.41 | 0.91 | $ 27.54 | $ 57,280 |
| Los Angeles-Long Beach-Anaheim, CA | 7,670 | 1.34 | 0.51 | $ 31.30 | $ 65,100 |
| Chicago-Naperville-Elgin, IL-IN-WI | 6,510 | 1.54 | 0.58 | $ 31.60 | $ 65,730 |
| Atlanta-Sandy Springs-Roswell, GA | 5,800 | 2.24 | 0.85 | $ 27.68 | $ 57,580 |
| Philadelphia-Camden-Wilmington, PA-NJ-DE-MD | 5,620 | 2.12 | 0.80 | $ 29.76 | $ 61,900 |
| Charlotte-Concord-Gastonia, NC-SC | 4,350 | 3.59 | 1.36 | $ 27.86 | $ 57,950 |
| Minneapolis-St. Paul-Bloomington, MN-WI | 4,230 | 2.32 | 0.88 | $ 31.74 | $ 66,010 |
Metropolitan areas with the highest concentration of jobs and location quotients in Industrial Machinery Mechanics:
| Metropolitan area | Employment (1) | Employment per thousand jobs | Location quotient (9) | Hourly mean wage | Annual mean wage (2) |
|---|---|---|---|---|---|
| Odessa, TX | 1,250 | 18.68 | 7.05 | $ 26.52 | $ 55,170 |
| Midland, TX | 1,420 | 14.91 | 5.63 | $ 30.72 | $ 63,900 |
| Farmington, NM | 590 | 14.42 | 5.45 | $ 27.14 | $ 56,460 |
| Longview, WA | 550 | 14.40 | 5.44 | $ 34.69 | $ 72,160 |
| Decatur, AL | 750 | 13.50 | 5.10 | $ 28.15 | $ 58,550 |
| Dalton, GA | 810 | 12.91 | 4.88 | $ 23.07 | $ 47,990 |
| Florence-Muscle Shoals, AL | 580 | 11.02 | 4.16 | $ 24.81 | $ 51,600 |
| Casper, WY | 380 | 10.59 | 4.00 | $ 31.61 | $ 65,750 |
| Tuscaloosa, AL | 1,020 | 10.52 | 3.97 | $ 26.66 | $ 55,440 |
| Owensboro, KY | 520 | 10.49 | 3.96 | $ 28.52 | $ 59,310 |
Top paying metropolitan areas for Industrial Machinery Mechanics:
| Metropolitan area | Employment (1) | Employment per thousand jobs | Location quotient (9) | Hourly mean wage | Annual mean wage (2) |
|---|---|---|---|---|---|
| Fairbanks, AK | 100 | 2.82 | 1.07 | $ 41.30 | $ 85,900 |
| Lake Charles, LA | 500 | 5.55 | 2.10 | $ 41.04 | $ 85,360 |
| Anchorage, AK | 170 | 1.04 | 0.39 | $ 39.85 | $ 82,890 |
| Urban Honolulu, HI | 440 | 1.12 | 0.42 | $ 38.37 | $ 79,800 |
| San Francisco-Oakland-Hayward, CA | 2,320 | 1.03 | 0.39 | $ 38.29 | $ 79,630 |
| Norwich-New London-Westerly, CT-RI | 270 | 2.38 | 0.90 | $ 38.29 | $ 79,630 |
| San Jose-Sunnyvale-Santa Clara, CA | 970 | 0.91 | 0.34 | $ 37.19 | $ 77,350 |
| Gulfport-Biloxi-Pascagoula, MS | 650 | 4.45 | 1.68 | $ 35.67 | $ 74,200 |
| San Luis Obispo-Paso Robles-Arroyo Grande, CA | 130 | 1.21 | 0.46 | $ 35.31 | $ 73,440 |
| Wenatchee, WA | 220 | 4.70 | 1.78 | $ 34.97 | $ 72,730 |
Nonmetropolitan areas with the highest employment in Industrial Machinery Mechanics:
| Nonmetropolitan area | Employment (1) | Employment per thousand jobs | Location quotient (9) | Hourly mean wage | Annual mean wage (2) |
|---|---|---|---|---|---|
| Balance of Lower Peninsula of Michigan nonmetropolitan area | 2,010 | 7.95 | 3.00 | $ 25.44 | $ 52,920 |
| North Northeastern Ohio nonmetropolitan area (noncontiguous) | 1,740 | 5.53 | 2.09 | $ 26.79 | $ 55,720 |
| Northeast Alabama nonmetropolitan area | 1,720 | 12.15 | 4.59 | $ 22.82 | $ 47,460 |
| Northeast Mississippi nonmetropolitan area | 1,680 | 7.59 | 2.87 | $ 22.74 | $ 47,300 |
| Kansas nonmetropolitan area | 1,580 | 4.22 | 1.59 | $ 28.22 | $ 58,710 |
Nonmetropolitan areas with the highest concentration of jobs and location quotients in Industrial Machinery Mechanics:
| Nonmetropolitan area | Employment (1) | Employment per thousand jobs | Location quotient (9) | Hourly mean wage | Annual mean wage (2) |
|---|---|---|---|---|---|
| Southwest Alabama nonmetropolitan area | 1,090 | 17.20 | 6.50 | $ 28.75 | $ 59,800 |
| East Arkansas nonmetropolitan area | 820 | 12.71 | 4.80 | $ 21.84 | $ 45,430 |
| Northeast Alabama nonmetropolitan area | 1,720 | 12.15 | 4.59 | $ 22.82 | $ 47,460 |
| South Arkansas nonmetropolitan area | 1,010 | 11.06 | 4.18 | $ 26.09 | $ 54,260 |
| Northwest Alabama nonmetropolitan area | 700 | 10.74 | 4.06 | $ 22.69 | $ 47,200 |
Top paying nonmetropolitan areas for Industrial Machinery Mechanics:
| Nonmetropolitan area | Employment (1) | Employment per thousand jobs | Location quotient (9) | Hourly mean wage | Annual mean wage (2) |
|---|---|---|---|---|---|
| Western Wyoming nonmetropolitan area | 620 | 6.55 | 2.47 | $ 38.29 | $ 79,640 |
| Hawaii / Kauai nonmetropolitan area | 60 | 0.68 | 0.26 | $ 37.61 | $ 78,220 |
| Eastern Wyoming nonmetropolitan area | 670 | 8.41 | 3.17 | $ 36.77 | $ 76,470 |
| Northwest Colorado nonmetropolitan area | 160 | 1.34 | 0.51 | $ 36.48 | $ 75,870 |
| Eastern Sierra-Mother Lode Region of California nonmetropolitan area | 60 | 1.07 | 0.40 | $ 36.19 | $ 75,280 |
These estimates are calculated with data collected from employers in all industry sectors, all metropolitan and nonmetropolitan areas, and all states and the District of Columbia. The top employment and wage figures are provided above. The complete list is available in the downloadable XLS files.
The percentile wage estimate is the value of a wage below which a certain percent of workers fall. The median wage is the 50th percentile wage estimate—50 percent of workers earn less than the median and 50 percent of workers earn more than the median. More about percentile wages.
(1) Estimates for detailed occupations do not sum to the totals because the totals include occupations not shown separately. Estimates do not include self-employed workers.
(2) Annual wages have been calculated by multiplying the hourly mean wage by a "year-round, full-time" hours figure of 2,080 hours; for those occupations where there is not an hourly wage published, the annual wage has been directly calculated from the reported survey data.
(3) The relative standard error (RSE) is a measure of the reliability of a survey statistic. The smaller the relative standard error, the more precise the estimate.
(9) The location quotient is the ratio of the area concentration of occupational employment to the national average concentration. A location quotient greater than one indicates the occupation has a higher share of employment than average, and a location quotient less than one indicates the occupation is less prevalent in the area than average.
Other OEWS estimates and related information:
May 2021 National Occupational Employment and Wage Estimates
May 2021 State Occupational Employment and Wage Estimates
May 2021 Metropolitan and Nonmetropolitan Area Occupational Employment and Wage Estimates
May 2021 National Industry-Specific Occupational Employment and Wage Estimates
Last Modified Date: March 31, 2022