
An official website of the United States government
An official website of the United States government
The .gov means it's official.
Federal government websites often end in .gov or .mil. Before sharing sensitive information,
make sure you're on a federal government site.
The site is secure.
The
https:// ensures that you are connecting to the official website and that any
information you provide is encrypted and transmitted securely.
Inspect, diagnose, adjust, or repair wind turbines. Perform maintenance on wind turbine equipment including resolving electrical, mechanical, and hydraulic malfunctions.
Employment estimate and mean wage estimates for Wind Turbine Service Technicians:
| Employment (1) | Employment RSE (3) |
Mean hourly wage |
Mean annual wage (2) |
Wage RSE (3) |
|---|---|---|---|---|
| 10,100 | 8.9 % | $ 28.16 | $ 58,580 | 1.4 % |
Percentile wage estimates for Wind Turbine Service Technicians:
| Percentile | 10% | 25% | 50% (Median) |
75% | 90% |
|---|---|---|---|---|---|
| Hourly Wage | $ 22.32 | $ 22.62 | $ 27.05 | $ 30.74 | $ 37.41 |
| Annual Wage (2) | $ 46,420 | $ 47,040 | $ 56,260 | $ 63,930 | $ 77,810 |
Industries with the highest published employment and wages for Wind Turbine Service Technicians are provided. For a list of all industries with employment in Wind Turbine Service Technicians, see the Create Customized Tables function.
Industries with the highest levels of employment in Wind Turbine Service Technicians:
| Industry | Employment (1) | Percent of industry employment | Hourly mean wage | Annual mean wage (2) |
|---|---|---|---|---|
| Electric Power Generation, Transmission and Distribution | 3,600 | 0.96 | $ 31.17 | $ 64,830 |
| Commercial and Industrial Machinery and Equipment (except Automotive and Electronic) Repair and Maintenance | 2,710 | 1.29 | $ 26.16 | $ 54,410 |
| Utility System Construction | 2,340 | 0.43 | $ 25.89 | $ 53,850 |
| Machinery, Equipment, and Supplies Merchant Wholesalers | 420 | 0.06 | $ 27.06 | $ 56,270 |
| Management of Companies and Enterprises | 90 | 0.00 | $ 29.41 | $ 61,170 |
Industries with the highest concentration of employment in Wind Turbine Service Technicians:
| Industry | Employment (1) | Percent of industry employment | Hourly mean wage | Annual mean wage (2) |
|---|---|---|---|---|
| Commercial and Industrial Machinery and Equipment (except Automotive and Electronic) Repair and Maintenance | 2,710 | 1.29 | $ 26.16 | $ 54,410 |
| Electric Power Generation, Transmission and Distribution | 3,600 | 0.96 | $ 31.17 | $ 64,830 |
| Utility System Construction | 2,340 | 0.43 | $ 25.89 | $ 53,850 |
| Machinery, Equipment, and Supplies Merchant Wholesalers | 420 | 0.06 | $ 27.06 | $ 56,270 |
| Management of Companies and Enterprises | 90 | 0.00 | $ 29.41 | $ 61,170 |
Top paying industries for Wind Turbine Service Technicians:
| Industry | Employment (1) | Percent of industry employment | Hourly mean wage | Annual mean wage (2) |
|---|---|---|---|---|
| Architectural, Engineering, and Related Services | (8) | (8) | $ 35.02 | $ 72,850 |
| Wholesale Electronic Markets and Agents and Brokers | (8) | (8) | $ 32.42 | $ 67,430 |
| Electric Power Generation, Transmission and Distribution | 3,600 | 0.96 | $ 31.17 | $ 64,830 |
| Management of Companies and Enterprises | 90 | (7) | $ 29.41 | $ 61,170 |
| Machinery, Equipment, and Supplies Merchant Wholesalers | 420 | 0.06 | $ 27.06 | $ 56,270 |
States and areas with the highest published employment, location quotients, and wages for Wind Turbine Service Technicians are provided. For a list of all areas with employment in Wind Turbine Service Technicians, see the Create Customized Tables function.
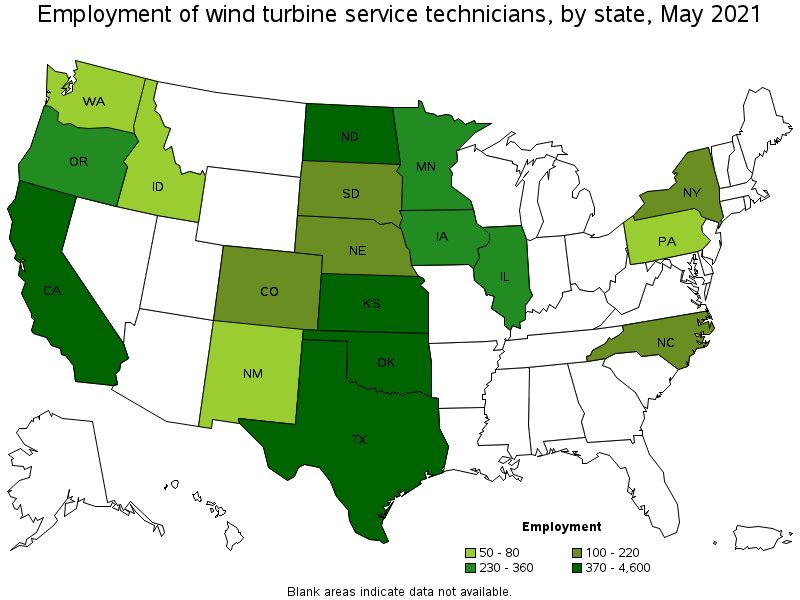
States with the highest employment level in Wind Turbine Service Technicians:
| State | Employment (1) | Employment per thousand jobs | Location quotient (9) | Hourly mean wage | Annual mean wage (2) |
|---|---|---|---|---|---|
| Texas | 4,600 | 0.38 | 5.25 | $ 26.54 | $ 55,190 |
| California | 820 | 0.05 | 0.69 | $ 31.57 | $ 65,670 |
| Oklahoma | 650 | 0.42 | 5.86 | $ 25.63 | $ 53,310 |
| Kansas | 620 | 0.46 | 6.41 | $ 26.43 | $ 54,980 |
| North Dakota | 370 | 0.93 | 12.90 | $ 25.97 | $ 54,020 |
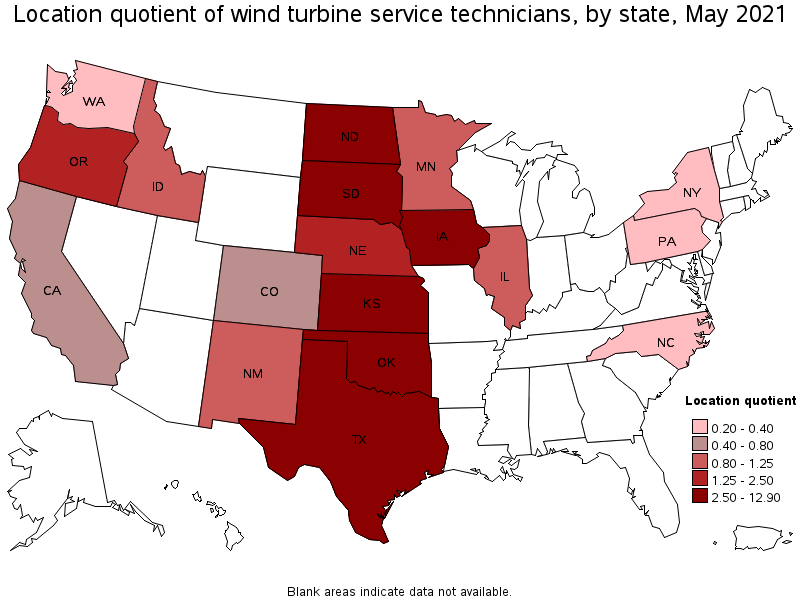
States with the highest concentration of jobs and location quotients in Wind Turbine Service Technicians:
| State | Employment (1) | Employment per thousand jobs | Location quotient (9) | Hourly mean wage | Annual mean wage (2) |
|---|---|---|---|---|---|
| North Dakota | 370 | 0.93 | 12.90 | $ 25.97 | $ 54,020 |
| South Dakota | 220 | 0.51 | 7.18 | $ 25.61 | $ 53,280 |
| Kansas | 620 | 0.46 | 6.41 | $ 26.43 | $ 54,980 |
| Oklahoma | 650 | 0.42 | 5.86 | $ 25.63 | $ 53,310 |
| Texas | 4,600 | 0.38 | 5.25 | $ 26.54 | $ 55,190 |
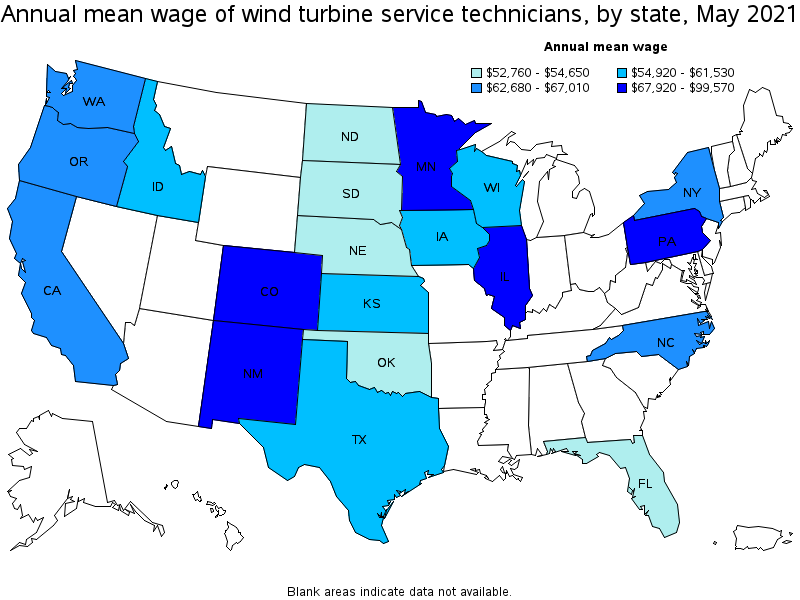
Top paying states for Wind Turbine Service Technicians:
| State | Employment (1) | Employment per thousand jobs | Location quotient (9) | Hourly mean wage | Annual mean wage (2) |
|---|---|---|---|---|---|
| Pennsylvania | 80 | 0.01 | 0.20 | $ 47.87 | $ 99,570 |
| Colorado | 150 | 0.06 | 0.77 | $ 33.36 | $ 69,380 |
| Illinois | 350 | 0.06 | 0.86 | $ 32.95 | $ 68,530 |
| New Mexico | 60 | 0.08 | 1.14 | $ 32.69 | $ 67,990 |
| Minnesota | 240 | 0.09 | 1.24 | $ 32.65 | $ 67,920 |
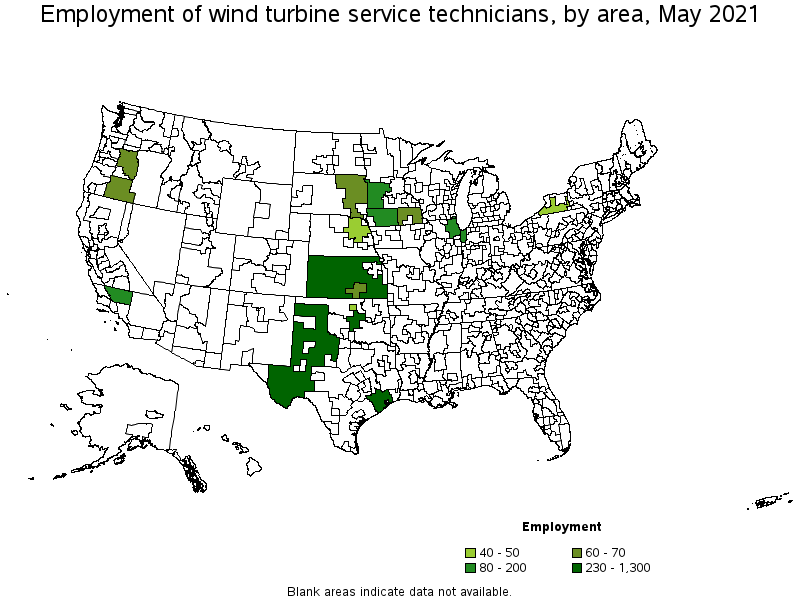
Metropolitan areas with the highest employment level in Wind Turbine Service Technicians:
| Metropolitan area | Employment (1) | Employment per thousand jobs | Location quotient (9) | Hourly mean wage | Annual mean wage (2) |
|---|---|---|---|---|---|
| Houston-The Woodlands-Sugar Land, TX | 1,300 | 0.45 | 6.27 | $ 27.52 | $ 57,240 |
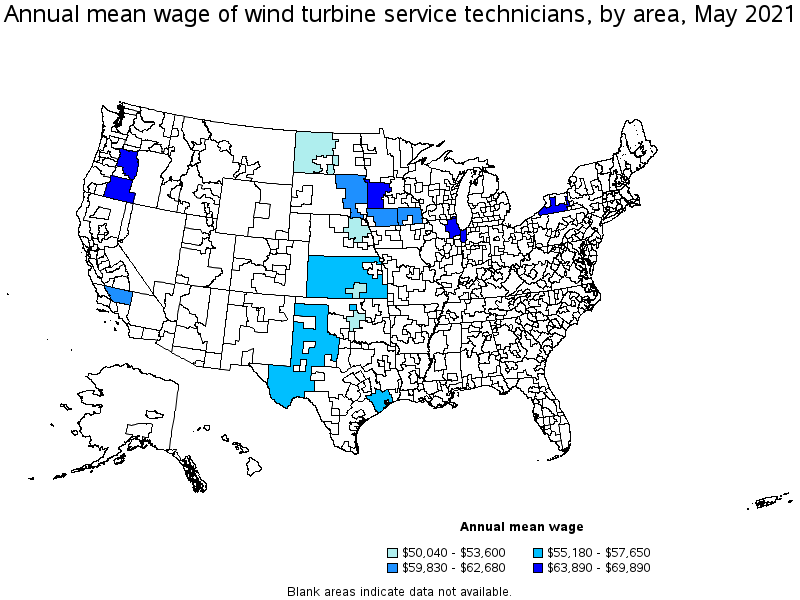
| Oklahoma City, OK | 230 | 0.37 | 5.22 | $ 24.06 | $ 50,040 |
| Chicago-Naperville-Elgin, IL-IN-WI | 200 | 0.05 | 0.67 | $ 33.37 | $ 69,410 |
| Bakersfield, CA | 170 | 0.54 | 7.52 | $ 30.14 | $ 62,680 |
| Wichita, KS | 70 | 0.26 | 3.59 | $ 25.77 | $ 53,600 |
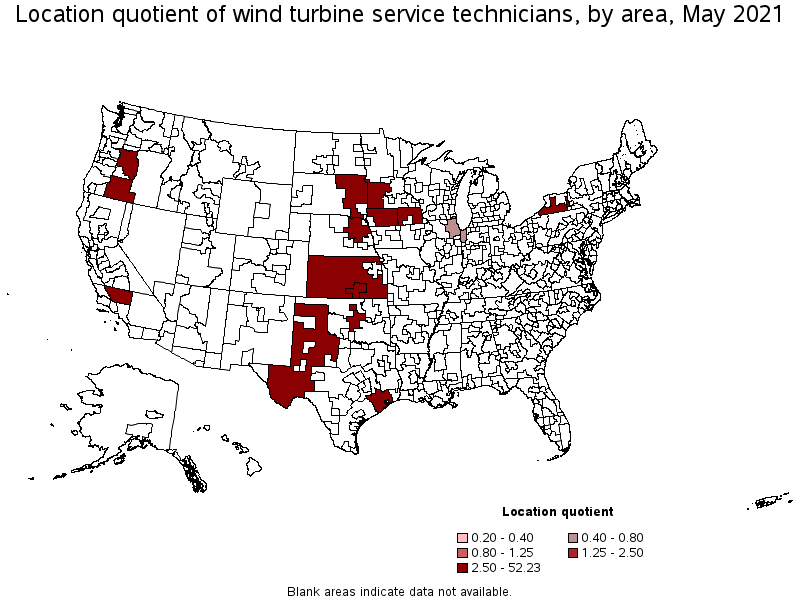
| Enid, OK | 50 | 2.19 | 30.55 | $ 27.18 | $ 56,530 |
Metropolitan areas with the highest concentration of jobs and location quotients in Wind Turbine Service Technicians:
| Metropolitan area | Employment (1) | Employment per thousand jobs | Location quotient (9) | Hourly mean wage | Annual mean wage (2) |
|---|---|---|---|---|---|
| Enid, OK | 50 | 2.19 | 30.55 | $ 27.18 | $ 56,530 |
| Bakersfield, CA | 170 | 0.54 | 7.52 | $ 30.14 | $ 62,680 |
| Houston-The Woodlands-Sugar Land, TX | 1,300 | 0.45 | 6.27 | $ 27.52 | $ 57,240 |
| Oklahoma City, OK | 230 | 0.37 | 5.22 | $ 24.06 | $ 50,040 |
| Wichita, KS | 70 | 0.26 | 3.59 | $ 25.77 | $ 53,600 |
| Chicago-Naperville-Elgin, IL-IN-WI | 200 | 0.05 | 0.67 | $ 33.37 | $ 69,410 |
Top paying metropolitan areas for Wind Turbine Service Technicians:
| Metropolitan area | Employment (1) | Employment per thousand jobs | Location quotient (9) | Hourly mean wage | Annual mean wage (2) |
|---|---|---|---|---|---|
| Chicago-Naperville-Elgin, IL-IN-WI | 200 | 0.05 | 0.67 | $ 33.37 | $ 69,410 |
| Bakersfield, CA | 170 | 0.54 | 7.52 | $ 30.14 | $ 62,680 |
| Houston-The Woodlands-Sugar Land, TX | 1,300 | 0.45 | 6.27 | $ 27.52 | $ 57,240 |
| Enid, OK | 50 | 2.19 | 30.55 | $ 27.18 | $ 56,530 |
| Wichita, KS | 70 | 0.26 | 3.59 | $ 25.77 | $ 53,600 |
| Oklahoma City, OK | 230 | 0.37 | 5.22 | $ 24.06 | $ 50,040 |
Nonmetropolitan areas with the highest employment in Wind Turbine Service Technicians:
| Nonmetropolitan area | Employment (1) | Employment per thousand jobs | Location quotient (9) | Hourly mean wage | Annual mean wage (2) |
|---|---|---|---|---|---|
| West Texas Region of Texas nonmetropolitan area | 690 | 3.75 | 52.23 | $ 26.53 | $ 55,180 |
| Kansas nonmetropolitan area | 330 | 0.87 | 12.17 | $ 27.72 | $ 57,650 |
| Northwest Iowa nonmetropolitan area | 160 | 1.25 | 17.38 | $ 29.91 | $ 62,220 |
| Southwest Minnesota nonmetropolitan area | 80 | 0.71 | 9.88 | $ 33.60 | $ 69,890 |
| Northeast Iowa nonmetropolitan area | 70 | 0.70 | 9.79 | $ 30.12 | $ 62,650 |
Nonmetropolitan areas with the highest concentration of jobs and location quotients in Wind Turbine Service Technicians:
| Nonmetropolitan area | Employment (1) | Employment per thousand jobs | Location quotient (9) | Hourly mean wage | Annual mean wage (2) |
|---|---|---|---|---|---|
| West Texas Region of Texas nonmetropolitan area | 690 | 3.75 | 52.23 | $ 26.53 | $ 55,180 |
| Northwest Iowa nonmetropolitan area | 160 | 1.25 | 17.38 | $ 29.91 | $ 62,220 |
| Central Oregon nonmetropolitan area | 60 | 1.02 | 14.28 | $ 31.51 | $ 65,540 |
| Kansas nonmetropolitan area | 330 | 0.87 | 12.17 | $ 27.72 | $ 57,650 |
| Southwest Minnesota nonmetropolitan area | 80 | 0.71 | 9.88 | $ 33.60 | $ 69,890 |
Top paying nonmetropolitan areas for Wind Turbine Service Technicians:
| Nonmetropolitan area | Employment (1) | Employment per thousand jobs | Location quotient (9) | Hourly mean wage | Annual mean wage (2) |
|---|---|---|---|---|---|
| Southwest Minnesota nonmetropolitan area | 80 | 0.71 | 9.88 | $ 33.60 | $ 69,890 |
| Central Oregon nonmetropolitan area | 60 | 1.02 | 14.28 | $ 31.51 | $ 65,540 |
| Southwest New York nonmetropolitan area | 40 | 0.21 | 2.93 | $ 30.72 | $ 63,890 |
| Northeast Iowa nonmetropolitan area | 70 | 0.70 | 9.79 | $ 30.12 | $ 62,650 |
| Northwest Iowa nonmetropolitan area | 160 | 1.25 | 17.38 | $ 29.91 | $ 62,220 |
These estimates are calculated with data collected from employers in all industry sectors, all metropolitan and nonmetropolitan areas, and all states and the District of Columbia. The top employment and wage figures are provided above. The complete list is available in the downloadable XLS files.
The percentile wage estimate is the value of a wage below which a certain percent of workers fall. The median wage is the 50th percentile wage estimate—50 percent of workers earn less than the median and 50 percent of workers earn more than the median. More about percentile wages.
(1) Estimates for detailed occupations do not sum to the totals because the totals include occupations not shown separately. Estimates do not include self-employed workers.
(2) Annual wages have been calculated by multiplying the hourly mean wage by a "year-round, full-time" hours figure of 2,080 hours; for those occupations where there is not an hourly wage published, the annual wage has been directly calculated from the reported survey data.
(3) The relative standard error (RSE) is a measure of the reliability of a survey statistic. The smaller the relative standard error, the more precise the estimate.
(7) The value is less than .005 percent of industry employment.
(8) Estimate not released.
(9) The location quotient is the ratio of the area concentration of occupational employment to the national average concentration. A location quotient greater than one indicates the occupation has a higher share of employment than average, and a location quotient less than one indicates the occupation is less prevalent in the area than average.
Other OEWS estimates and related information:
May 2021 National Occupational Employment and Wage Estimates
May 2021 State Occupational Employment and Wage Estimates
May 2021 Metropolitan and Nonmetropolitan Area Occupational Employment and Wage Estimates
May 2021 National Industry-Specific Occupational Employment and Wage Estimates
Last Modified Date: March 31, 2022