
An official website of the United States government
An official website of the United States government
The .gov means it's official.
Federal government websites often end in .gov or .mil. Before sharing sensitive information,
make sure you're on a federal government site.
The site is secure.
The
https:// ensures that you are connecting to the official website and that any
information you provide is encrypted and transmitted securely.
Install, service, adjust, or repair coin, vending, or amusement machines including video games, juke boxes, pinball machines, or slot machines.
Employment estimate and mean wage estimates for Coin, Vending, and Amusement Machine Servicers and Repairers:
| Employment (1) | Employment RSE (3) |
Mean hourly wage |
Mean annual wage (2) |
Wage RSE (3) |
|---|---|---|---|---|
| 27,540 | 3.2 % | $ 20.20 | $ 42,010 | 0.9 % |
Percentile wage estimates for Coin, Vending, and Amusement Machine Servicers and Repairers:
| Percentile | 10% | 25% | 50% (Median) |
75% | 90% |
|---|---|---|---|---|---|
| Hourly Wage | $ 13.20 | $ 14.57 | $ 18.77 | $ 23.09 | $ 28.73 |
| Annual Wage (2) | $ 27,460 | $ 30,300 | $ 39,040 | $ 48,040 | $ 59,770 |
Industries with the highest published employment and wages for Coin, Vending, and Amusement Machine Servicers and Repairers are provided. For a list of all industries with employment in Coin, Vending, and Amusement Machine Servicers and Repairers, see the Create Customized Tables function.
Industries with the highest levels of employment in Coin, Vending, and Amusement Machine Servicers and Repairers:
| Industry | Employment (1) | Percent of industry employment | Hourly mean wage | Annual mean wage (2) |
|---|---|---|---|---|
| Vending Machine Operators | 6,840 | 23.24 | $ 17.33 | $ 36,050 |
| Gambling Industries | 3,990 | 2.21 | $ 17.62 | $ 36,650 |
| Merchant Wholesalers, Nondurable Goods (4244 and 4248 only) | 2,950 | 0.32 | $ 21.95 | $ 45,660 |
| Traveler Accommodation | 2,820 | 0.20 | $ 19.31 | $ 40,160 |
| Beverage Manufacturing | 2,160 | 0.77 | $ 23.67 | $ 49,240 |
Industries with the highest concentration of employment in Coin, Vending, and Amusement Machine Servicers and Repairers:
| Industry | Employment (1) | Percent of industry employment | Hourly mean wage | Annual mean wage (2) |
|---|---|---|---|---|
| Vending Machine Operators | 6,840 | 23.24 | $ 17.33 | $ 36,050 |
| Gambling Industries | 3,990 | 2.21 | $ 17.62 | $ 36,650 |
| Amusement Parks and Arcades | 1,380 | 0.90 | $ 20.95 | $ 43,570 |
| Beverage Manufacturing | 2,160 | 0.77 | $ 23.67 | $ 49,240 |
| Commercial and Industrial Machinery and Equipment (except Automotive and Electronic) Repair and Maintenance | 820 | 0.39 | $ 25.59 | $ 53,230 |
Top paying industries for Coin, Vending, and Amusement Machine Servicers and Repairers:
| Industry | Employment (1) | Percent of industry employment | Hourly mean wage | Annual mean wage (2) |
|---|---|---|---|---|
| Local Government, excluding schools and hospitals (OEWS Designation) | 780 | 0.01 | $ 33.05 | $ 68,750 |
| Other Miscellaneous Manufacturing | 240 | 0.09 | $ 25.85 | $ 53,780 |
| Commercial and Industrial Machinery and Equipment (except Automotive and Electronic) Repair and Maintenance | 820 | 0.39 | $ 25.59 | $ 53,230 |
| Warehousing and Storage | 800 | 0.05 | $ 23.98 | $ 49,880 |
| Beverage Manufacturing | 2,160 | 0.77 | $ 23.67 | $ 49,240 |
States and areas with the highest published employment, location quotients, and wages for Coin, Vending, and Amusement Machine Servicers and Repairers are provided. For a list of all areas with employment in Coin, Vending, and Amusement Machine Servicers and Repairers, see the Create Customized Tables function.
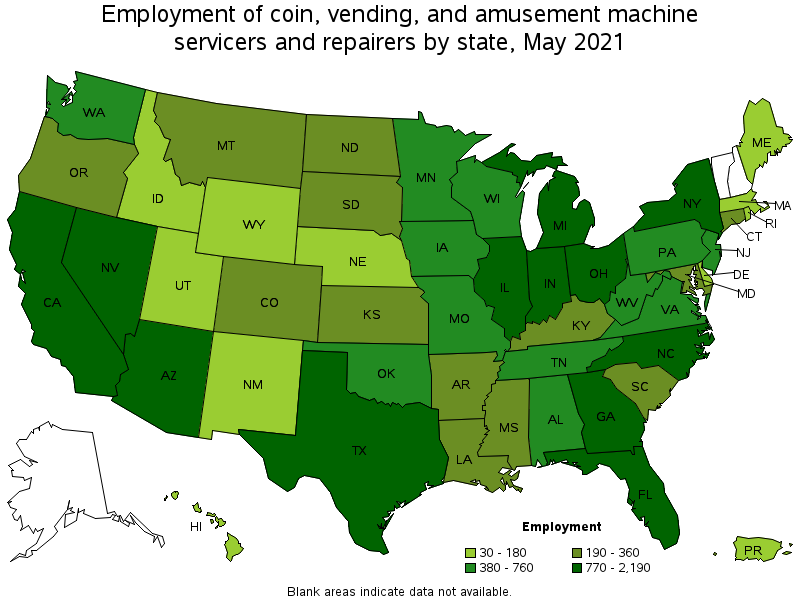
States with the highest employment level in Coin, Vending, and Amusement Machine Servicers and Repairers:
| State | Employment (1) | Employment per thousand jobs | Location quotient (9) | Hourly mean wage | Annual mean wage (2) |
|---|---|---|---|---|---|
| California | 2,190 | 0.13 | 0.68 | $ 20.72 | $ 43,100 |
| Florida | 1,960 | 0.23 | 1.17 | $ 20.79 | $ 43,240 |
| Indiana | 1,770 | 0.59 | 3.03 | $ 20.16 | $ 41,930 |
| Illinois | 1,640 | 0.29 | 1.50 | $ 19.58 | $ 40,730 |
| Nevada | 1,530 | 1.19 | 6.07 | $ 19.51 | $ 40,580 |
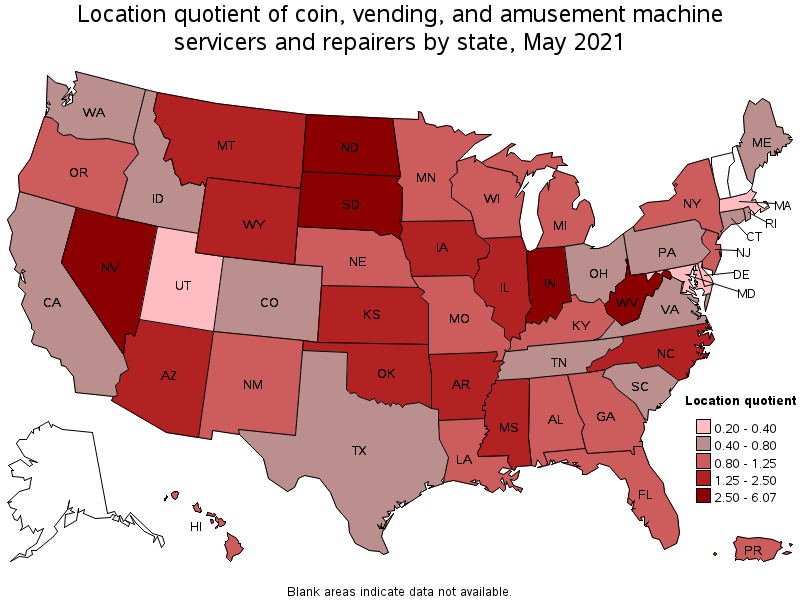
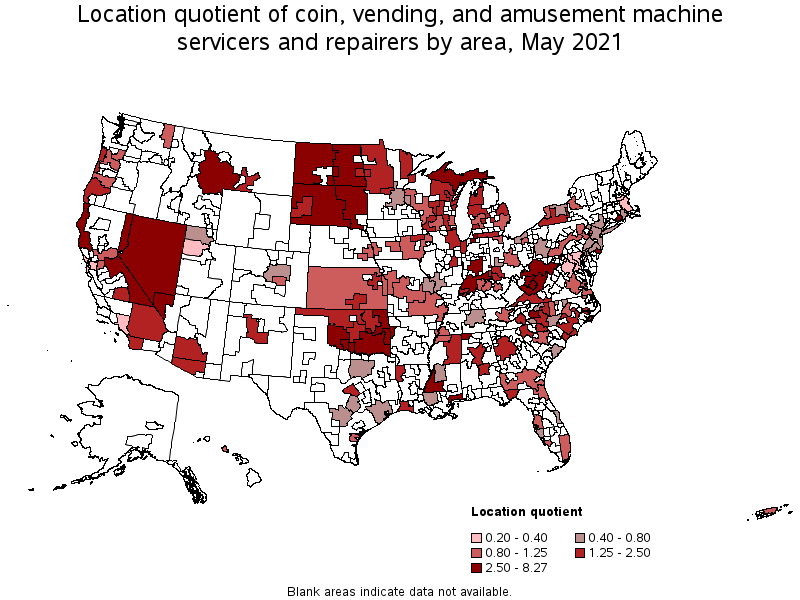
States with the highest concentration of jobs and location quotients in Coin, Vending, and Amusement Machine Servicers and Repairers:
| State | Employment (1) | Employment per thousand jobs | Location quotient (9) | Hourly mean wage | Annual mean wage (2) |
|---|---|---|---|---|---|
| Nevada | 1,530 | 1.19 | 6.07 | $ 19.51 | $ 40,580 |
| West Virginia | 510 | 0.78 | 3.98 | $ 18.36 | $ 38,190 |
| South Dakota | 280 | 0.66 | 3.37 | $ 17.55 | $ 36,500 |
| Indiana | 1,770 | 0.59 | 3.03 | $ 20.16 | $ 41,930 |
| North Dakota | 200 | 0.50 | 2.55 | $ 17.67 | $ 36,760 |
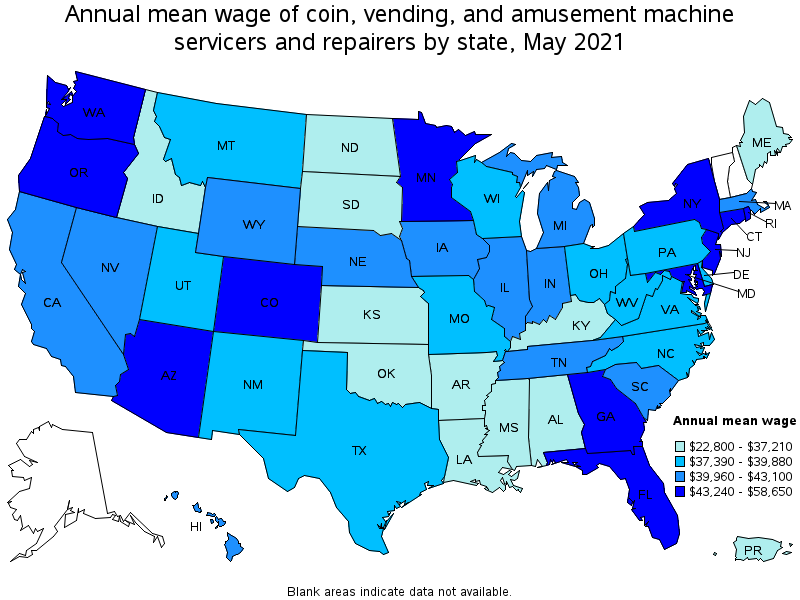
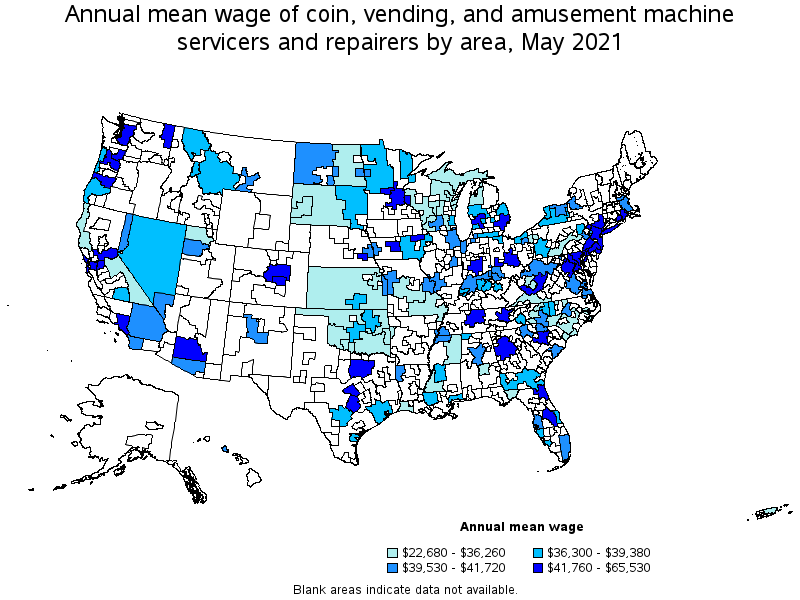
Top paying states for Coin, Vending, and Amusement Machine Servicers and Repairers:
| State | Employment (1) | Employment per thousand jobs | Location quotient (9) | Hourly mean wage | Annual mean wage (2) |
|---|---|---|---|---|---|
| New York | 1,410 | 0.16 | 0.83 | $ 28.20 | $ 58,650 |
| New Jersey | 640 | 0.17 | 0.84 | $ 27.74 | $ 57,700 |
| Rhode Island | 70 | 0.15 | 0.78 | $ 23.41 | $ 48,690 |
| Washington | 480 | 0.15 | 0.76 | $ 23.08 | $ 48,010 |
| Colorado | 340 | 0.13 | 0.67 | $ 22.77 | $ 47,370 |
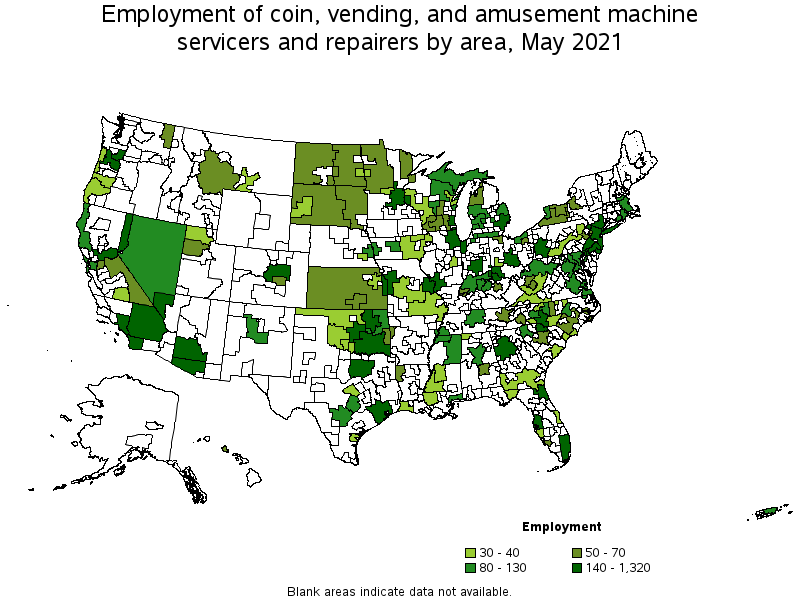
Metropolitan areas with the highest employment level in Coin, Vending, and Amusement Machine Servicers and Repairers:
| Metropolitan area | Employment (1) | Employment per thousand jobs | Location quotient (9) | Hourly mean wage | Annual mean wage (2) |
|---|---|---|---|---|---|
| Chicago-Naperville-Elgin, IL-IN-WI | 1,320 | 0.31 | 1.60 | $ 20.06 | $ 41,720 |
| New York-Newark-Jersey City, NY-NJ-PA | 1,230 | 0.14 | 0.73 | $ 31.50 | $ 65,530 |
| Las Vegas-Henderson-Paradise, NV | 1,190 | 1.30 | 6.63 | $ 19.72 | $ 41,010 |
| Phoenix-Mesa-Scottsdale, AZ | 750 | 0.35 | 1.81 | $ 22.06 | $ 45,890 |
| Atlanta-Sandy Springs-Roswell, GA | 660 | 0.25 | 1.30 | $ 22.22 | $ 46,210 |
| Indianapolis-Carmel-Anderson, IN | 620 | 0.61 | 3.13 | $ 20.74 | $ 43,140 |
| Miami-Fort Lauderdale-West Palm Beach, FL | 520 | 0.21 | 1.09 | $ 19.60 | $ 40,760 |
| Riverside-San Bernardino-Ontario, CA | 470 | 0.31 | 1.57 | $ 19.38 | $ 40,310 |
| Detroit-Warren-Dearborn, MI | 400 | 0.22 | 1.13 | $ 21.61 | $ 44,950 |
| San Diego-Carlsbad, CA | 370 | 0.26 | 1.35 | $ 19.19 | $ 39,920 |
Metropolitan areas with the highest concentration of jobs and location quotients in Coin, Vending, and Amusement Machine Servicers and Repairers:
| Metropolitan area | Employment (1) | Employment per thousand jobs | Location quotient (9) | Hourly mean wage | Annual mean wage (2) |
|---|---|---|---|---|---|
| Atlantic City-Hammonton, NJ | 190 | 1.62 | 8.27 | $ 28.44 | $ 59,150 |
| Beckley, WV | 50 | 1.31 | 6.70 | $ 15.32 | $ 31,870 |
| Las Vegas-Henderson-Paradise, NV | 1,190 | 1.30 | 6.63 | $ 19.72 | $ 41,010 |
| Reno, NV | 230 | 0.99 | 5.08 | $ 19.37 | $ 40,290 |
| Norwich-New London-Westerly, CT-RI | 110 | 0.92 | 4.72 | $ 21.59 | $ 44,900 |
| Lawton, OK | 40 | 0.85 | 4.37 | $ 16.05 | $ 33,380 |
| Gulfport-Biloxi-Pascagoula, MS | 110 | 0.77 | 3.95 | $ 18.19 | $ 37,830 |
| Charleston, WV | 70 | 0.71 | 3.62 | $ 16.68 | $ 34,690 |
| Florence-Muscle Shoals, AL | 40 | 0.68 | 3.50 | $ 17.60 | $ 36,610 |
| Fort Smith, AR-OK | 70 | 0.67 | 3.42 | $ 13.15 | $ 27,360 |
Top paying metropolitan areas for Coin, Vending, and Amusement Machine Servicers and Repairers:
| Metropolitan area | Employment (1) | Employment per thousand jobs | Location quotient (9) | Hourly mean wage | Annual mean wage (2) |
|---|---|---|---|---|---|
| New York-Newark-Jersey City, NY-NJ-PA | 1,230 | 0.14 | 0.73 | $ 31.50 | $ 65,530 |
| Atlantic City-Hammonton, NJ | 190 | 1.62 | 8.27 | $ 28.44 | $ 59,150 |
| San Francisco-Oakland-Hayward, CA | 130 | 0.06 | 0.30 | $ 25.78 | $ 53,620 |
| Los Angeles-Long Beach-Anaheim, CA | 290 | 0.05 | 0.26 | $ 25.52 | $ 53,080 |
| Orlando-Kissimmee-Sanford, FL | (8) | (8) | (8) | $ 25.39 | $ 52,810 |
| Stockton-Lodi, CA | 50 | 0.18 | 0.90 | $ 24.82 | $ 51,630 |
| Seattle-Tacoma-Bellevue, WA | (8) | (8) | (8) | $ 24.35 | $ 50,650 |
| Providence-Warwick, RI-MA | 80 | 0.15 | 0.76 | $ 23.18 | $ 48,210 |
| Denver-Aurora-Lakewood, CO | 220 | 0.15 | 0.76 | $ 23.18 | $ 48,200 |
| Washington-Arlington-Alexandria, DC-VA-MD-WV | 130 | 0.05 | 0.24 | $ 23.00 | $ 47,840 |
Nonmetropolitan areas with the highest employment in Coin, Vending, and Amusement Machine Servicers and Repairers:
| Nonmetropolitan area | Employment (1) | Employment per thousand jobs | Location quotient (9) | Hourly mean wage | Annual mean wage (2) |
|---|---|---|---|---|---|
| Southeast Oklahoma nonmetropolitan area | 210 | 1.26 | 6.45 | $ 13.95 | $ 29,020 |
| Balance of Lower Peninsula of Michigan nonmetropolitan area | 120 | 0.48 | 2.46 | $ 18.34 | $ 38,140 |
| Northeast Oklahoma nonmetropolitan area | 120 | 1.04 | 5.33 | $ 14.41 | $ 29,980 |
| Southern Indiana nonmetropolitan area | 100 | 0.55 | 2.79 | $ 19.68 | $ 40,930 |
| Nevada nonmetropolitan area | 90 | 0.95 | 4.86 | $ 17.55 | $ 36,500 |
Nonmetropolitan areas with the highest concentration of jobs and location quotients in Coin, Vending, and Amusement Machine Servicers and Repairers:
| Nonmetropolitan area | Employment (1) | Employment per thousand jobs | Location quotient (9) | Hourly mean wage | Annual mean wage (2) |
|---|---|---|---|---|---|
| Southeast Oklahoma nonmetropolitan area | 210 | 1.26 | 6.45 | $ 13.95 | $ 29,020 |
| East North Dakota nonmetropolitan area | 70 | 1.22 | 6.25 | $ 16.12 | $ 33,530 |
| West South Dakota nonmetropolitan area | 70 | 1.09 | 5.57 | $ 15.42 | $ 32,080 |
| Northeast Oklahoma nonmetropolitan area | 120 | 1.04 | 5.33 | $ 14.41 | $ 29,980 |
| Eastern Sierra-Mother Lode Region of California nonmetropolitan area | 60 | 1.02 | 5.21 | $ 17.29 | $ 35,950 |
Top paying nonmetropolitan areas for Coin, Vending, and Amusement Machine Servicers and Repairers:
| Nonmetropolitan area | Employment (1) | Employment per thousand jobs | Location quotient (9) | Hourly mean wage | Annual mean wage (2) |
|---|---|---|---|---|---|
| Southern West Virginia nonmetropolitan area | 40 | 0.63 | 3.21 | $ 20.08 | $ 41,760 |
| Southern Indiana nonmetropolitan area | 100 | 0.55 | 2.79 | $ 19.68 | $ 40,930 |
| Northern West Virginia nonmetropolitan area | 80 | 0.65 | 3.32 | $ 19.58 | $ 40,730 |
| West North Dakota nonmetropolitan area | 60 | 0.56 | 2.87 | $ 19.01 | $ 39,540 |
| West Montana nonmetropolitan area | (8) | (8) | (8) | $ 18.93 | $ 39,380 |
These estimates are calculated with data collected from employers in all industry sectors, all metropolitan and nonmetropolitan areas, and all states and the District of Columbia. The top employment and wage figures are provided above. The complete list is available in the downloadable XLS files.
The percentile wage estimate is the value of a wage below which a certain percent of workers fall. The median wage is the 50th percentile wage estimate—50 percent of workers earn less than the median and 50 percent of workers earn more than the median. More about percentile wages.
(1) Estimates for detailed occupations do not sum to the totals because the totals include occupations not shown separately. Estimates do not include self-employed workers.
(2) Annual wages have been calculated by multiplying the hourly mean wage by a "year-round, full-time" hours figure of 2,080 hours; for those occupations where there is not an hourly wage published, the annual wage has been directly calculated from the reported survey data.
(3) The relative standard error (RSE) is a measure of the reliability of a survey statistic. The smaller the relative standard error, the more precise the estimate.
(8) Estimate not released.
(9) The location quotient is the ratio of the area concentration of occupational employment to the national average concentration. A location quotient greater than one indicates the occupation has a higher share of employment than average, and a location quotient less than one indicates the occupation is less prevalent in the area than average.
Other OEWS estimates and related information:
May 2021 National Occupational Employment and Wage Estimates
May 2021 State Occupational Employment and Wage Estimates
May 2021 Metropolitan and Nonmetropolitan Area Occupational Employment and Wage Estimates
May 2021 National Industry-Specific Occupational Employment and Wage Estimates
Last Modified Date: March 31, 2022