
An official website of the United States government
An official website of the United States government
The .gov means it's official.
Federal government websites often end in .gov or .mil. Before sharing sensitive information,
make sure you're on a federal government site.
The site is secure.
The
https:// ensures that you are connecting to the official website and that any
information you provide is encrypted and transmitted securely.
Work below surface of water, using surface-supplied air or scuba equipment to inspect, repair, remove, or install equipment and structures. May use a variety of power and hand tools, such as drills, sledgehammers, torches, and welding equipment. May conduct tests or experiments, rig explosives, or photograph structures or marine life. Excludes �Athletes and Sports Competitors� (27-2021), �Police and Sheriff�s Patrol Officers� (33-3051), and �Fishing and Hunting Workers� (45-3031).
Employment estimate and mean wage estimates for Commercial Divers:
| Employment (1) | Employment RSE (3) |
Mean hourly wage |
Mean annual wage (2) |
Wage RSE (3) |
|---|---|---|---|---|
| 2,670 | 13.7 % | $ 39.43 | $ 82,010 | 10.4 % |
Percentile wage estimates for Commercial Divers:
| Percentile | 10% | 25% | 50% (Median) |
75% | 90% |
|---|---|---|---|---|---|
| Hourly Wage | $ 17.85 | $ 22.66 | $ 29.02 | $ 55.45 | $ 76.98 |
| Annual Wage (2) | $ 37,130 | $ 47,120 | $ 60,360 | $ 115,330 | $ 160,110 |
Industries with the highest published employment and wages for Commercial Divers are provided. For a list of all industries with employment in Commercial Divers, see the Create Customized Tables function.
Industries with the highest levels of employment in Commercial Divers:
| Industry | Employment (1) | Percent of industry employment | Hourly mean wage | Annual mean wage (2) |
|---|---|---|---|---|
| Other Support Services | 1,350 | 0.48 | $ 40.18 | $ 83,580 |
| Other Heavy and Civil Engineering Construction | 800 | 0.66 | $ 44.37 | $ 92,290 |
| Architectural, Engineering, and Related Services | 140 | 0.01 | $ 35.49 | $ 73,820 |
| Museums, Historical Sites, and Similar Institutions | 80 | 0.06 | $ 16.42 | $ 34,160 |
| Support Activities for Water Transportation | 30 | 0.04 | $ 25.92 | $ 53,920 |
Industries with the highest concentration of employment in Commercial Divers:
| Industry | Employment (1) | Percent of industry employment | Hourly mean wage | Annual mean wage (2) |
|---|---|---|---|---|
| Other Heavy and Civil Engineering Construction | 800 | 0.66 | $ 44.37 | $ 92,290 |
| Other Support Services | 1,350 | 0.48 | $ 40.18 | $ 83,580 |
| Museums, Historical Sites, and Similar Institutions | 80 | 0.06 | $ 16.42 | $ 34,160 |
| Support Activities for Water Transportation | 30 | 0.04 | $ 25.92 | $ 53,920 |
| Architectural, Engineering, and Related Services | 140 | 0.01 | $ 35.49 | $ 73,820 |
Top paying industries for Commercial Divers:
| Industry | Employment (1) | Percent of industry employment | Hourly mean wage | Annual mean wage (2) |
|---|---|---|---|---|
| Other Heavy and Civil Engineering Construction | 800 | 0.66 | $ 44.37 | $ 92,290 |
| Other Support Services | 1,350 | 0.48 | $ 40.18 | $ 83,580 |
| Architectural, Engineering, and Related Services | 140 | 0.01 | $ 35.49 | $ 73,820 |
| Building Equipment Contractors | (8) | (8) | $ 33.59 | $ 69,870 |
| Support Activities for Water Transportation | 30 | 0.04 | $ 25.92 | $ 53,920 |
States and areas with the highest published employment, location quotients, and wages for Commercial Divers are provided. For a list of all areas with employment in Commercial Divers, see the Create Customized Tables function.
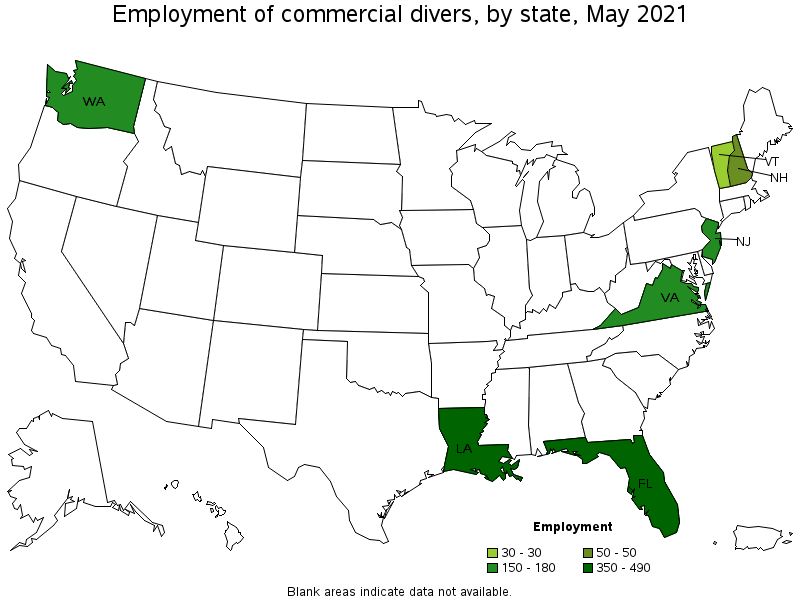
States with the highest employment level in Commercial Divers:
| State | Employment (1) | Employment per thousand jobs | Location quotient (9) | Hourly mean wage | Annual mean wage (2) |
|---|---|---|---|---|---|
| Florida | 490 | 0.06 | 3.01 | $ 23.05 | $ 47,940 |
| Louisiana | 350 | 0.19 | 10.28 | $ 30.16 | $ 62,730 |
| Washington | 180 | 0.06 | 2.97 | $ 58.68 | $ 122,050 |
| New Jersey | 150 | 0.04 | 2.12 | $ 43.10 | $ 89,660 |
| Virginia | 150 | 0.04 | 2.11 | $ 28.78 | $ 59,870 |
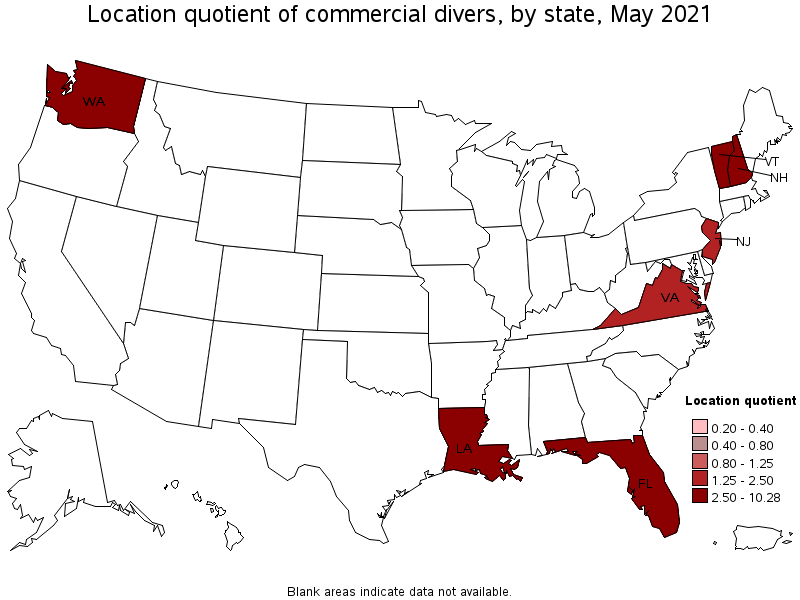
States with the highest concentration of jobs and location quotients in Commercial Divers:
| State | Employment (1) | Employment per thousand jobs | Location quotient (9) | Hourly mean wage | Annual mean wage (2) |
|---|---|---|---|---|---|
| Louisiana | 350 | 0.19 | 10.28 | $ 30.16 | $ 62,730 |
| Vermont | 30 | 0.12 | 6.48 | $ 22.47 | $ 46,730 |
| New Hampshire | 50 | 0.09 | 4.52 | $ 32.47 | $ 67,540 |
| Florida | 490 | 0.06 | 3.01 | $ 23.05 | $ 47,940 |
| Washington | 180 | 0.06 | 2.97 | $ 58.68 | $ 122,050 |
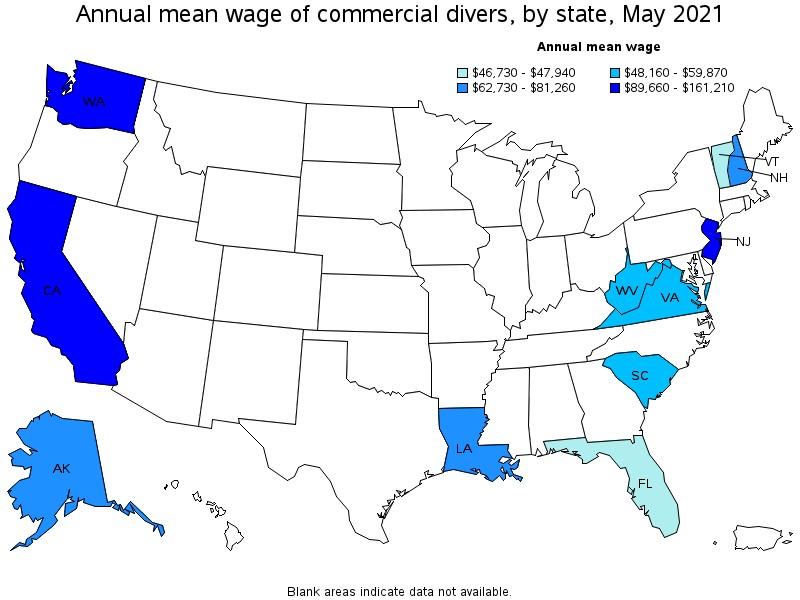
Top paying states for Commercial Divers:
| State | Employment (1) | Employment per thousand jobs | Location quotient (9) | Hourly mean wage | Annual mean wage (2) |
|---|---|---|---|---|---|
| California | (8) | (8) | (8) | $ 77.50 | $ 161,210 |
| Washington | 180 | 0.06 | 2.97 | $ 58.68 | $ 122,050 |
| New Jersey | 150 | 0.04 | 2.12 | $ 43.10 | $ 89,660 |
| Alaska | (8) | (8) | (8) | $ 39.07 | $ 81,260 |
| New Hampshire | 50 | 0.09 | 4.52 | $ 32.47 | $ 67,540 |
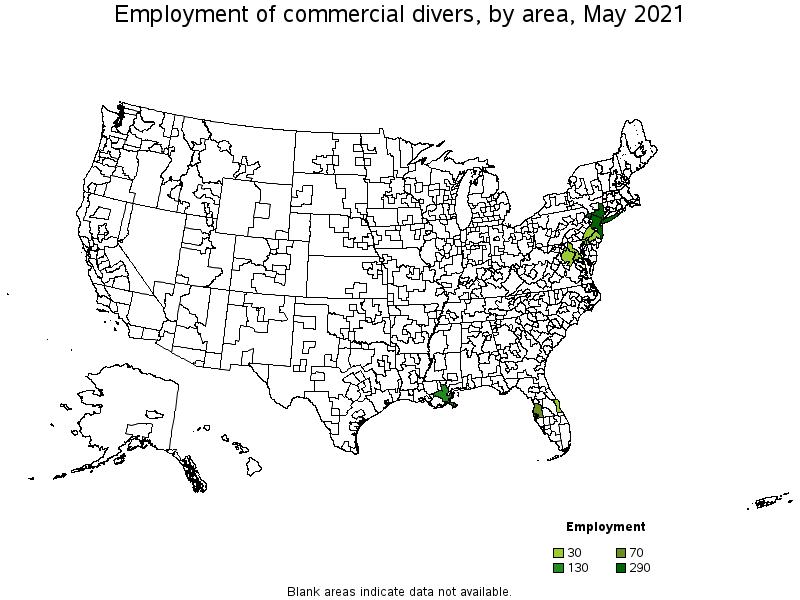
Metropolitan areas with the highest employment level in Commercial Divers:
| Metropolitan area | Employment (1) | Employment per thousand jobs | Location quotient (9) | Hourly mean wage | Annual mean wage (2) |
|---|---|---|---|---|---|
| New York-Newark-Jersey City, NY-NJ-PA | 290 | 0.03 | 1.75 | $ 52.95 | $ 110,130 |
| New Orleans-Metairie, LA | 130 | 0.26 | 13.59 | $ 31.66 | $ 65,850 |
| Tampa-St. Petersburg-Clearwater, FL | 70 | 0.06 | 2.94 | $ 22.91 | $ 47,660 |
| Philadelphia-Camden-Wilmington, PA-NJ-DE-MD | 30 | 0.01 | 0.69 | $ 42.10 | $ 87,570 |
| Palm Bay-Melbourne-Titusville, FL | 30 | 0.14 | 7.47 | $ 25.47 | $ 52,970 |
| Washington-Arlington-Alexandria, DC-VA-MD-WV | 30 | 0.01 | 0.54 | $ 44.28 | $ 92,100 |
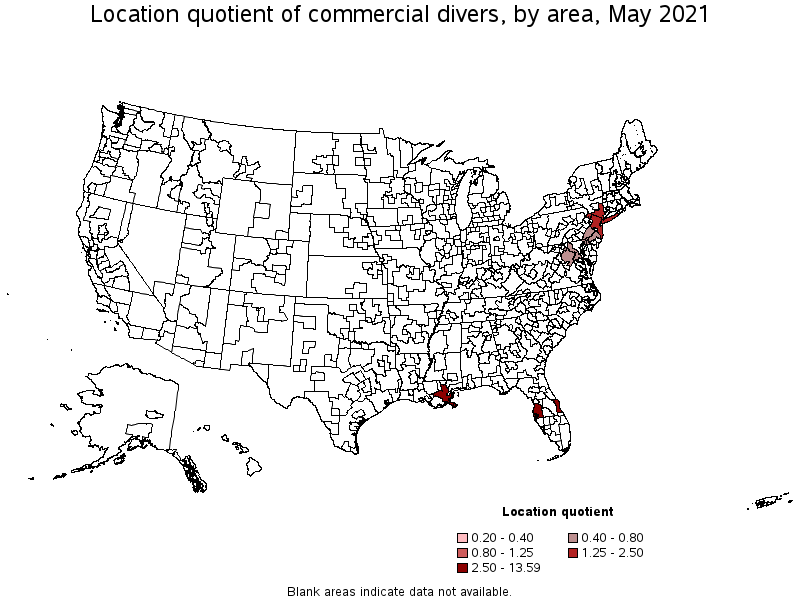
Metropolitan areas with the highest concentration of jobs and location quotients in Commercial Divers:
| Metropolitan area | Employment (1) | Employment per thousand jobs | Location quotient (9) | Hourly mean wage | Annual mean wage (2) |
|---|---|---|---|---|---|
| New Orleans-Metairie, LA | 130 | 0.26 | 13.59 | $ 31.66 | $ 65,850 |
| Palm Bay-Melbourne-Titusville, FL | 30 | 0.14 | 7.47 | $ 25.47 | $ 52,970 |
| Tampa-St. Petersburg-Clearwater, FL | 70 | 0.06 | 2.94 | $ 22.91 | $ 47,660 |
| New York-Newark-Jersey City, NY-NJ-PA | 290 | 0.03 | 1.75 | $ 52.95 | $ 110,130 |
| Philadelphia-Camden-Wilmington, PA-NJ-DE-MD | 30 | 0.01 | 0.69 | $ 42.10 | $ 87,570 |
| Washington-Arlington-Alexandria, DC-VA-MD-WV | 30 | 0.01 | 0.54 | $ 44.28 | $ 92,100 |
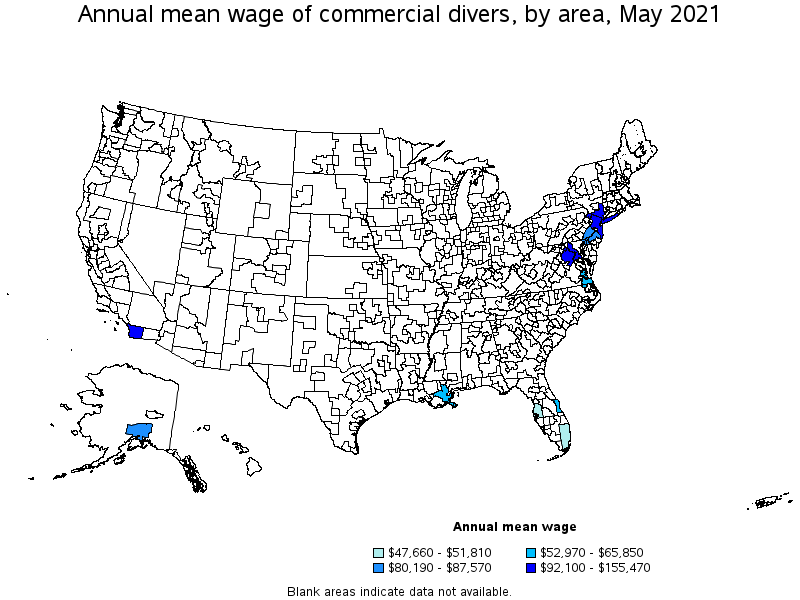
Top paying metropolitan areas for Commercial Divers:
| Metropolitan area | Employment (1) | Employment per thousand jobs | Location quotient (9) | Hourly mean wage | Annual mean wage (2) |
|---|---|---|---|---|---|
| San Diego-Carlsbad, CA | (8) | (8) | (8) | $ 74.74 | $ 155,470 |
| New York-Newark-Jersey City, NY-NJ-PA | 290 | 0.03 | 1.75 | $ 52.95 | $ 110,130 |
| Washington-Arlington-Alexandria, DC-VA-MD-WV | 30 | 0.01 | 0.54 | $ 44.28 | $ 92,100 |
| Philadelphia-Camden-Wilmington, PA-NJ-DE-MD | 30 | 0.01 | 0.69 | $ 42.10 | $ 87,570 |
| Anchorage, AK | (8) | (8) | (8) | $ 38.55 | $ 80,190 |
| New Orleans-Metairie, LA | 130 | 0.26 | 13.59 | $ 31.66 | $ 65,850 |
| Virginia Beach-Norfolk-Newport News, VA-NC | (8) | (8) | (8) | $ 26.28 | $ 54,660 |
| Palm Bay-Melbourne-Titusville, FL | 30 | 0.14 | 7.47 | $ 25.47 | $ 52,970 |
| Miami-Fort Lauderdale-West Palm Beach, FL | (8) | (8) | (8) | $ 24.91 | $ 51,810 |
| Tampa-St. Petersburg-Clearwater, FL | 70 | 0.06 | 2.94 | $ 22.91 | $ 47,660 |
These estimates are calculated with data collected from employers in all industry sectors, all metropolitan and nonmetropolitan areas, and all states and the District of Columbia. The top employment and wage figures are provided above. The complete list is available in the downloadable XLS files.
The percentile wage estimate is the value of a wage below which a certain percent of workers fall. The median wage is the 50th percentile wage estimate—50 percent of workers earn less than the median and 50 percent of workers earn more than the median. More about percentile wages.
(1) Estimates for detailed occupations do not sum to the totals because the totals include occupations not shown separately. Estimates do not include self-employed workers.
(2) Annual wages have been calculated by multiplying the hourly mean wage by a "year-round, full-time" hours figure of 2,080 hours; for those occupations where there is not an hourly wage published, the annual wage has been directly calculated from the reported survey data.
(3) The relative standard error (RSE) is a measure of the reliability of a survey statistic. The smaller the relative standard error, the more precise the estimate.
(8) Estimate not released.
(9) The location quotient is the ratio of the area concentration of occupational employment to the national average concentration. A location quotient greater than one indicates the occupation has a higher share of employment than average, and a location quotient less than one indicates the occupation is less prevalent in the area than average.
Other OEWS estimates and related information:
May 2021 National Occupational Employment and Wage Estimates
May 2021 State Occupational Employment and Wage Estimates
May 2021 Metropolitan and Nonmetropolitan Area Occupational Employment and Wage Estimates
May 2021 National Industry-Specific Occupational Employment and Wage Estimates
Last Modified Date: March 31, 2022