
An official website of the United States government
An official website of the United States government
The .gov means it's official.
Federal government websites often end in .gov or .mil. Before sharing sensitive information,
make sure you're on a federal government site.
The site is secure.
The
https:// ensures that you are connecting to the official website and that any
information you provide is encrypted and transmitted securely.
This occupation includes the 2018 SOC occupations 51-2092 Team Assemblers and 51-2099 Assemblers and Fabricators, All Other.
Employment estimate and mean wage estimates for Miscellaneous Assemblers and Fabricators:
| Employment (1) | Employment RSE (3) |
Mean hourly wage |
Mean annual wage (2) |
Wage RSE (3) |
|---|---|---|---|---|
| 1,328,550 | 0.6 % | $ 18.17 | $ 37,780 | 0.2 % |
Percentile wage estimates for Miscellaneous Assemblers and Fabricators:
| Percentile | 10% | 25% | 50% (Median) |
75% | 90% |
|---|---|---|---|---|---|
| Hourly Wage | $ 12.58 | $ 14.29 | $ 17.59 | $ 21.70 | $ 26.21 |
| Annual Wage (2) | $ 26,160 | $ 29,710 | $ 36,590 | $ 45,130 | $ 54,510 |
Industries with the highest published employment and wages for Miscellaneous Assemblers and Fabricators are provided. For a list of all industries with employment in Miscellaneous Assemblers and Fabricators, see the Create Customized Tables function.
Industries with the highest levels of employment in Miscellaneous Assemblers and Fabricators:
| Industry | Employment (1) | Percent of industry employment | Hourly mean wage | Annual mean wage (2) |
|---|---|---|---|---|
| Employment Services | 210,450 | 6.03 | $ 14.65 | $ 30,480 |
| Motor Vehicle Manufacturing | 141,230 | 57.80 | $ 24.76 | $ 51,490 |
| Motor Vehicle Parts Manufacturing | 119,880 | 22.28 | $ 17.87 | $ 37,160 |
| Machinery Manufacturing (3331, 3332, 3334, and 3339 only) | 105,360 | 15.04 | $ 19.43 | $ 40,420 |
| Plastics Product Manufacturing | 56,170 | 9.61 | $ 16.13 | $ 33,550 |
Industries with the highest concentration of employment in Miscellaneous Assemblers and Fabricators:
| Industry | Employment (1) | Percent of industry employment | Hourly mean wage | Annual mean wage (2) |
|---|---|---|---|---|
| Motor Vehicle Manufacturing | 141,230 | 57.80 | $ 24.76 | $ 51,490 |
| Other Furniture Related Product Manufacturing | 11,980 | 33.74 | $ 15.59 | $ 32,440 |
| Motor Vehicle Body and Trailer Manufacturing | 45,430 | 29.09 | $ 20.87 | $ 43,400 |
| Household Appliance Manufacturing | 15,290 | 23.53 | $ 18.20 | $ 37,860 |
| Motor Vehicle Parts Manufacturing | 119,880 | 22.28 | $ 17.87 | $ 37,160 |
Top paying industries for Miscellaneous Assemblers and Fabricators:
| Industry | Employment (1) | Percent of industry employment | Hourly mean wage | Annual mean wage (2) |
|---|---|---|---|---|
| Local Government, excluding schools and hospitals (OEWS Designation) | 280 | 0.01 | $ 28.02 | $ 58,270 |
| Grain and Oilseed Milling | 90 | 0.14 | $ 26.97 | $ 56,100 |
| Electric Power Generation, Transmission and Distribution | 130 | 0.03 | $ 25.82 | $ 53,710 |
| Colleges, Universities, and Professional Schools | 70 | (7) | $ 25.32 | $ 52,670 |
| Motor Vehicle Manufacturing | 141,230 | 57.80 | $ 24.76 | $ 51,490 |
States and areas with the highest published employment, location quotients, and wages for Miscellaneous Assemblers and Fabricators are provided. For a list of all areas with employment in Miscellaneous Assemblers and Fabricators, see the Create Customized Tables function.
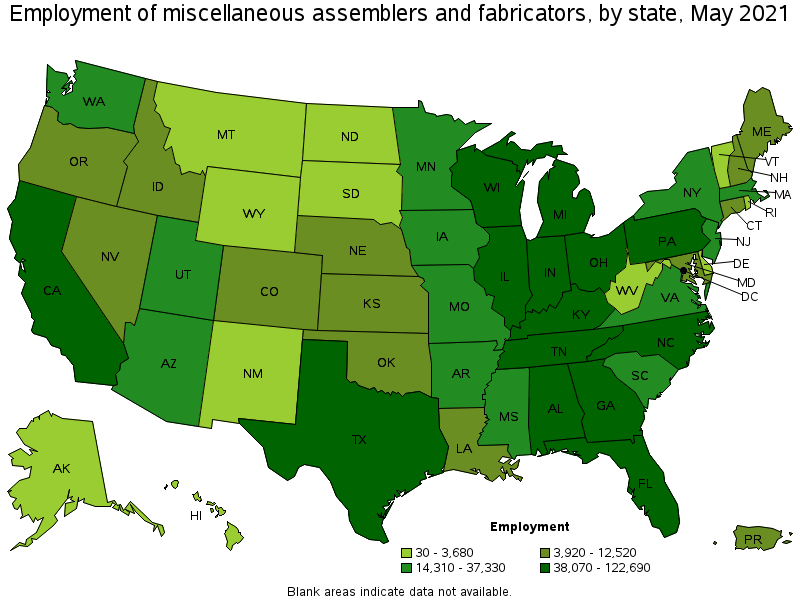
States with the highest employment level in Miscellaneous Assemblers and Fabricators:
| State | Employment (1) | Employment per thousand jobs | Location quotient (9) | Hourly mean wage | Annual mean wage (2) |
|---|---|---|---|---|---|
| California | 122,690 | 7.42 | 0.79 | $ 18.73 | $ 38,950 |
| Michigan | 105,940 | 26.10 | 2.77 | $ 19.69 | $ 40,950 |
| Ohio | 84,300 | 16.21 | 1.72 | $ 17.87 | $ 37,170 |
| Texas | 82,980 | 6.79 | 0.72 | $ 17.29 | $ 35,950 |
| Indiana | 80,340 | 26.93 | 2.86 | $ 20.20 | $ 42,020 |
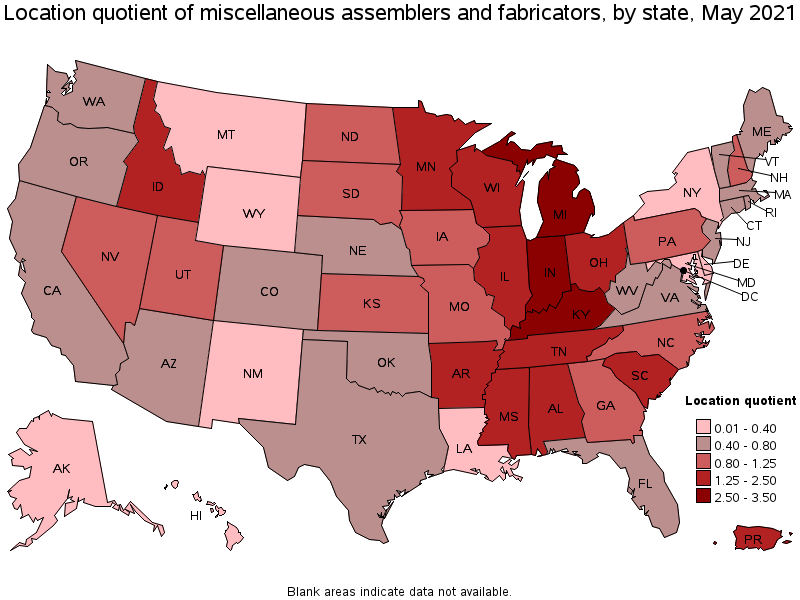
States with the highest concentration of jobs and location quotients in Miscellaneous Assemblers and Fabricators:
| State | Employment (1) | Employment per thousand jobs | Location quotient (9) | Hourly mean wage | Annual mean wage (2) |
|---|---|---|---|---|---|
| Kentucky | 50,070 | 27.23 | 2.89 | $ 19.29 | $ 40,130 |
| Indiana | 80,340 | 26.93 | 2.86 | $ 20.20 | $ 42,020 |
| Michigan | 105,940 | 26.10 | 2.77 | $ 19.69 | $ 40,950 |
| Alabama | 38,070 | 19.74 | 2.09 | $ 17.66 | $ 36,730 |
| South Carolina | 37,330 | 18.06 | 1.91 | $ 17.12 | $ 35,620 |
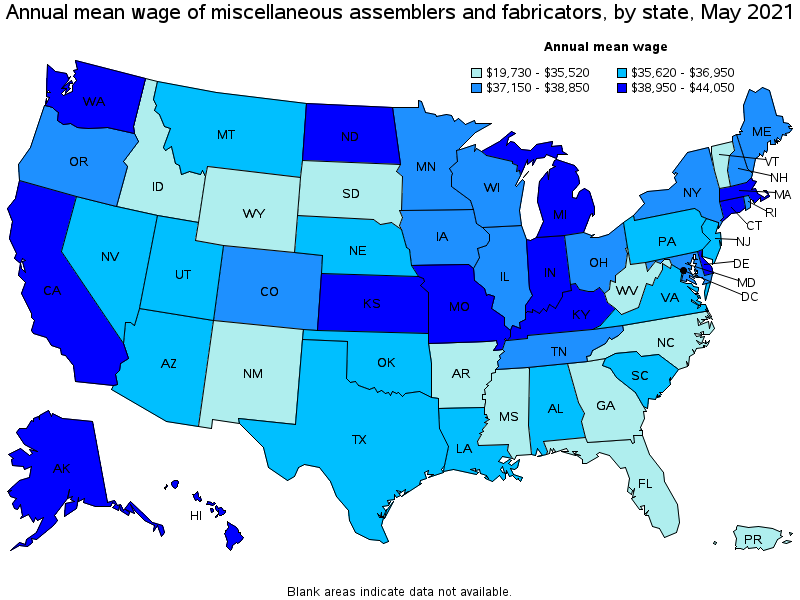
Top paying states for Miscellaneous Assemblers and Fabricators:
| State | Employment (1) | Employment per thousand jobs | Location quotient (9) | Hourly mean wage | Annual mean wage (2) |
|---|---|---|---|---|---|
| Connecticut | 11,300 | 7.18 | 0.76 | $ 21.18 | $ 44,050 |
| Alaska | 170 | 0.56 | 0.06 | $ 21.02 | $ 43,710 |
| District of Columbia | 70 | 0.10 | 0.01 | $ 20.56 | $ 42,760 |
| North Dakota | 3,680 | 9.32 | 0.99 | $ 20.25 | $ 42,130 |
| Indiana | 80,340 | 26.93 | 2.86 | $ 20.20 | $ 42,020 |
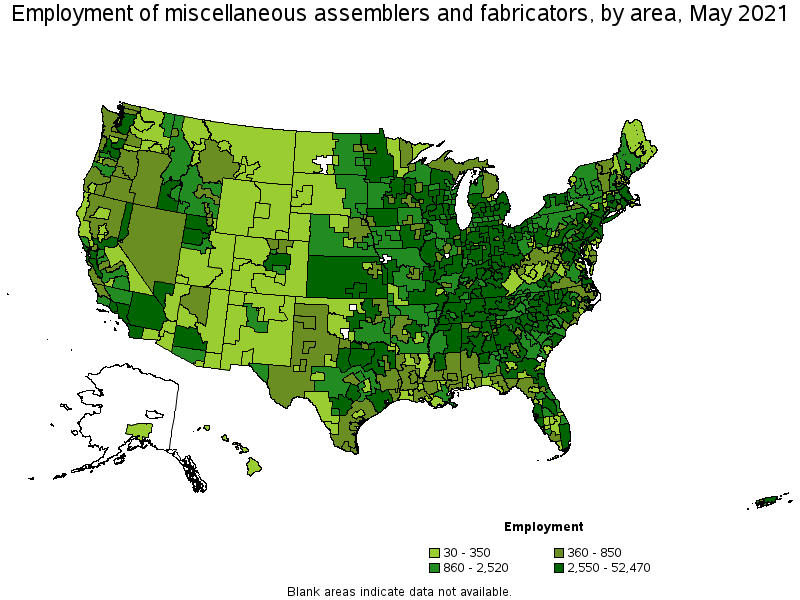
Metropolitan areas with the highest employment level in Miscellaneous Assemblers and Fabricators:
| Metropolitan area | Employment (1) | Employment per thousand jobs | Location quotient (9) | Hourly mean wage | Annual mean wage (2) |
|---|---|---|---|---|---|
| Detroit-Warren-Dearborn, MI | 52,470 | 29.12 | 3.09 | $ 21.00 | $ 43,670 |
| Los Angeles-Long Beach-Anaheim, CA | 43,740 | 7.65 | 0.81 | $ 17.82 | $ 37,060 |
| Chicago-Naperville-Elgin, IL-IN-WI | 41,760 | 9.87 | 1.05 | $ 18.53 | $ 38,540 |
| Dallas-Fort Worth-Arlington, TX | 31,810 | 8.86 | 0.94 | $ 18.02 | $ 37,480 |
| Minneapolis-St. Paul-Bloomington, MN-WI | 23,940 | 13.13 | 1.39 | $ 18.92 | $ 39,350 |
| New York-Newark-Jersey City, NY-NJ-PA | 23,500 | 2.71 | 0.29 | $ 18.50 | $ 38,480 |
| Atlanta-Sandy Springs-Roswell, GA | 21,190 | 8.19 | 0.87 | $ 16.08 | $ 33,440 |
| Louisville/Jefferson County, KY-IN | 20,500 | 32.79 | 3.48 | $ 20.70 | $ 43,050 |
| Houston-The Woodlands-Sugar Land, TX | 19,630 | 6.78 | 0.72 | $ 17.91 | $ 37,250 |
| San Francisco-Oakland-Hayward, CA | 19,550 | 8.72 | 0.92 | $ 22.87 | $ 47,580 |
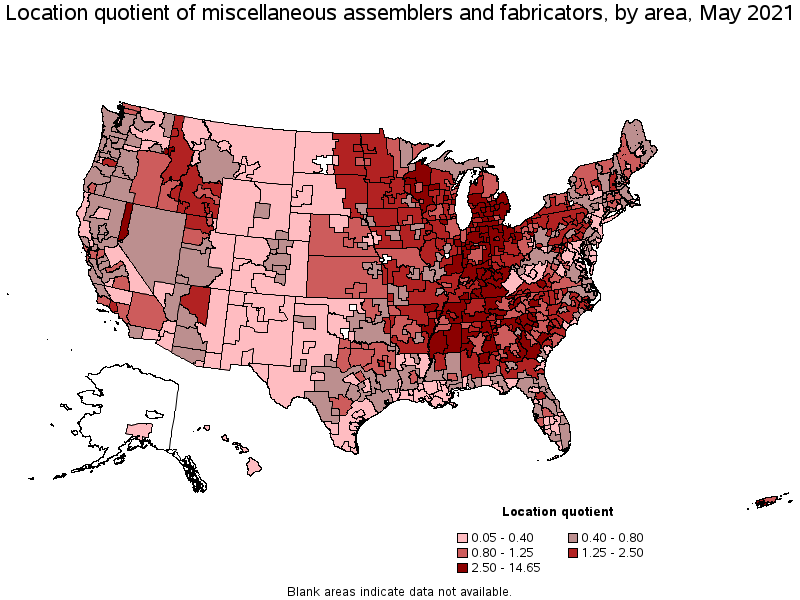
Metropolitan areas with the highest concentration of jobs and location quotients in Miscellaneous Assemblers and Fabricators:
| Metropolitan area | Employment (1) | Employment per thousand jobs | Location quotient (9) | Hourly mean wage | Annual mean wage (2) |
|---|---|---|---|---|---|
| Elkhart-Goshen, IN | 18,480 | 138.18 | 14.65 | $ 22.87 | $ 47,570 |
| Lafayette-West Lafayette, IN | 4,910 | 53.86 | 5.71 | $ 21.54 | $ 44,790 |
| Rockford, IL | 6,300 | 47.72 | 5.06 | $ 23.23 | $ 48,310 |
| Tuscaloosa, AL | 4,600 | 47.61 | 5.05 | $ 22.14 | $ 46,050 |
| Battle Creek, MI | 2,370 | 46.92 | 4.98 | $ 19.35 | $ 40,250 |
| Toledo, OH | 11,400 | 40.94 | 4.34 | $ 20.17 | $ 41,950 |
| Flint, MI | 5,050 | 40.55 | 4.30 | (8) | (8) |
| Blacksburg-Christiansburg-Radford, VA | 2,720 | 39.82 | 4.22 | $ 20.18 | $ 41,980 |
| Elizabethtown-Fort Knox, KY | 2,050 | 39.76 | 4.22 | $ 19.35 | $ 40,240 |
| Columbus, IN | 1,850 | 38.47 | 4.08 | $ 18.27 | $ 38,010 |
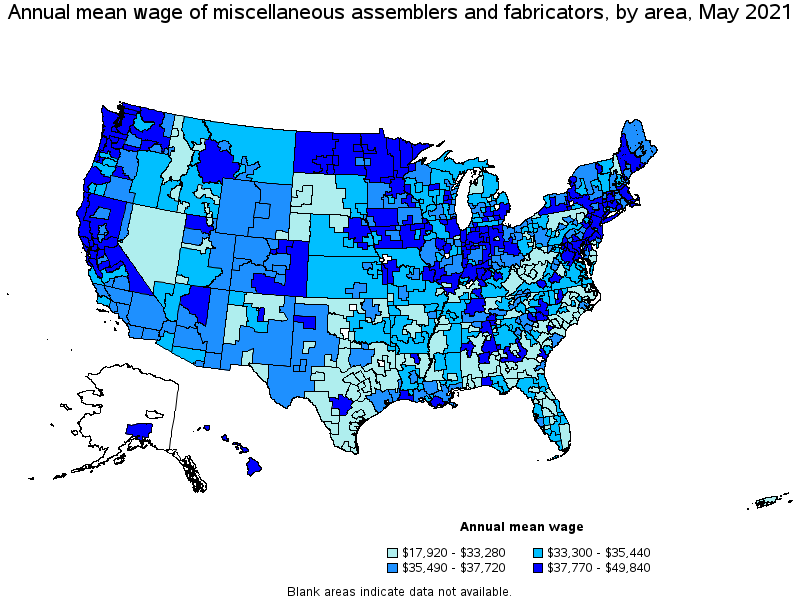
Top paying metropolitan areas for Miscellaneous Assemblers and Fabricators:
| Metropolitan area | Employment (1) | Employment per thousand jobs | Location quotient (9) | Hourly mean wage | Annual mean wage (2) |
|---|---|---|---|---|---|
| Hartford-West Hartford-East Hartford, CT | 4,430 | 8.14 | 0.86 | $ 23.96 | $ 49,840 |
| Lansing-East Lansing, MI | 5,280 | 26.78 | 2.84 | $ 23.30 | $ 48,450 |
| Rockford, IL | 6,300 | 47.72 | 5.06 | $ 23.23 | $ 48,310 |
| Fort Wayne, IN | 7,290 | 34.91 | 3.70 | $ 22.91 | $ 47,650 |
| San Francisco-Oakland-Hayward, CA | 19,550 | 8.72 | 0.92 | $ 22.87 | $ 47,580 |
| Elkhart-Goshen, IN | 18,480 | 138.18 | 14.65 | $ 22.87 | $ 47,570 |
| Oshkosh-Neenah, WI | 3,000 | 33.30 | 3.53 | $ 22.55 | $ 46,910 |
| Bridgeport-Stamford-Norwalk, CT | 1,970 | 5.26 | 0.56 | $ 22.56 | $ 46,910 |
| Kansas City, MO-KS | 12,890 | 12.69 | 1.35 | $ 22.26 | $ 46,290 |
| Tuscaloosa, AL | 4,600 | 47.61 | 5.05 | $ 22.14 | $ 46,050 |
Nonmetropolitan areas with the highest employment in Miscellaneous Assemblers and Fabricators:
| Nonmetropolitan area | Employment (1) | Employment per thousand jobs | Location quotient (9) | Hourly mean wage | Annual mean wage (2) |
|---|---|---|---|---|---|
| West Northwestern Ohio nonmetropolitan area | 10,700 | 44.65 | 4.73 | $ 18.67 | $ 38,830 |
| Northern Indiana nonmetropolitan area | 9,810 | 48.00 | 5.09 | $ 20.21 | $ 42,050 |
| Southern Indiana nonmetropolitan area | 9,190 | 50.15 | 5.32 | $ 20.73 | $ 43,120 |
| North Northeastern Ohio nonmetropolitan area (noncontiguous) | 8,800 | 28.01 | 2.97 | $ 17.53 | $ 36,460 |
| Balance of Lower Peninsula of Michigan nonmetropolitan area | 7,670 | 30.34 | 3.22 | $ 16.45 | $ 34,210 |
Nonmetropolitan areas with the highest concentration of jobs and location quotients in Miscellaneous Assemblers and Fabricators:
| Nonmetropolitan area | Employment (1) | Employment per thousand jobs | Location quotient (9) | Hourly mean wage | Annual mean wage (2) |
|---|---|---|---|---|---|
| Northwest Alabama nonmetropolitan area | 5,020 | 77.27 | 8.19 | $ 16.83 | $ 35,000 |
| Southern Indiana nonmetropolitan area | 9,190 | 50.15 | 5.32 | $ 20.73 | $ 43,120 |
| Northern Indiana nonmetropolitan area | 9,810 | 48.00 | 5.09 | $ 20.21 | $ 42,050 |
| Northeast Alabama nonmetropolitan area | 6,550 | 46.16 | 4.89 | $ 19.38 | $ 40,300 |
| West Northwestern Ohio nonmetropolitan area | 10,700 | 44.65 | 4.73 | $ 18.67 | $ 38,830 |
Top paying nonmetropolitan areas for Miscellaneous Assemblers and Fabricators:
| Nonmetropolitan area | Employment (1) | Employment per thousand jobs | Location quotient (9) | Hourly mean wage | Annual mean wage (2) |
|---|---|---|---|---|---|
| East North Dakota nonmetropolitan area | 1,430 | 23.44 | 2.49 | $ 23.67 | $ 49,230 |
| South Illinois nonmetropolitan area | 1,900 | 22.49 | 2.39 | $ 20.96 | $ 43,610 |
| Southern Indiana nonmetropolitan area | 9,190 | 50.15 | 5.32 | $ 20.73 | $ 43,120 |
| Northern Indiana nonmetropolitan area | 9,810 | 48.00 | 5.09 | $ 20.21 | $ 42,050 |
| West North Dakota nonmetropolitan area | 150 | 1.39 | 0.15 | $ 19.97 | $ 41,540 |
These estimates are calculated with data collected from employers in all industry sectors, all metropolitan and nonmetropolitan areas, and all states and the District of Columbia. The top employment and wage figures are provided above. The complete list is available in the downloadable XLS files.
The percentile wage estimate is the value of a wage below which a certain percent of workers fall. The median wage is the 50th percentile wage estimate—50 percent of workers earn less than the median and 50 percent of workers earn more than the median. More about percentile wages.
(1) Estimates for detailed occupations do not sum to the totals because the totals include occupations not shown separately. Estimates do not include self-employed workers.
(2) Annual wages have been calculated by multiplying the hourly mean wage by a "year-round, full-time" hours figure of 2,080 hours; for those occupations where there is not an hourly wage published, the annual wage has been directly calculated from the reported survey data.
(3) The relative standard error (RSE) is a measure of the reliability of a survey statistic. The smaller the relative standard error, the more precise the estimate.
(7) The value is less than .005 percent of industry employment.
(8) Estimate not released.
(9) The location quotient is the ratio of the area concentration of occupational employment to the national average concentration. A location quotient greater than one indicates the occupation has a higher share of employment than average, and a location quotient less than one indicates the occupation is less prevalent in the area than average.
Other OEWS estimates and related information:
May 2021 National Occupational Employment and Wage Estimates
May 2021 State Occupational Employment and Wage Estimates
May 2021 Metropolitan and Nonmetropolitan Area Occupational Employment and Wage Estimates
May 2021 National Industry-Specific Occupational Employment and Wage Estimates
Last Modified Date: March 31, 2022