
An official website of the United States government
An official website of the United States government
The .gov means it's official.
Federal government websites often end in .gov or .mil. Before sharing sensitive information,
make sure you're on a federal government site.
The site is secure.
The
https:// ensures that you are connecting to the official website and that any
information you provide is encrypted and transmitted securely.
Mix and bake ingredients to produce breads, rolls, cookies, cakes, pies, pastries, or other baked goods. Pastry chefs in restaurants and hotels are included with �Chefs and Head Cooks� (35-1011).
Employment estimate and mean wage estimates for Bakers:
| Employment (1) | Employment RSE (3) |
Mean hourly wage |
Mean annual wage (2) |
Wage RSE (3) |
|---|---|---|---|---|
| 181,800 | 3.0 % | $ 15.53 | $ 32,300 | 0.6 % |
Percentile wage estimates for Bakers:
| Percentile | 10% | 25% | 50% (Median) |
75% | 90% |
|---|---|---|---|---|---|
| Hourly Wage | $ 10.97 | $ 13.30 | $ 14.31 | $ 17.75 | $ 21.85 |
| Annual Wage (2) | $ 22,820 | $ 27,660 | $ 29,750 | $ 36,930 | $ 45,450 |
Industries with the highest published employment and wages for Bakers are provided. For a list of all industries with employment in Bakers, see the Create Customized Tables function.
Industries with the highest levels of employment in Bakers:
| Industry | Employment (1) | Percent of industry employment | Hourly mean wage | Annual mean wage (2) |
|---|---|---|---|---|
| Bakeries and Tortilla Manufacturing | 63,050 | 21.36 | $ 15.74 | $ 32,750 |
| Food and Beverage Stores (4451 and 4452 only) | 52,090 | 1.76 | $ 15.63 | $ 32,510 |
| Restaurants and Other Eating Places | 42,210 | 0.45 | $ 14.16 | $ 29,450 |
| Special Food Services | 2,910 | 0.61 | $ 16.05 | $ 33,390 |
| Merchant Wholesalers, Nondurable Goods (4244 and 4248 only) | 2,870 | 0.31 | $ 15.50 | $ 32,230 |
Industries with the highest concentration of employment in Bakers:
| Industry | Employment (1) | Percent of industry employment | Hourly mean wage | Annual mean wage (2) |
|---|---|---|---|---|
| Bakeries and Tortilla Manufacturing | 63,050 | 21.36 | $ 15.74 | $ 32,750 |
| Food and Beverage Stores (4451 and 4452 only) | 52,090 | 1.76 | $ 15.63 | $ 32,510 |
| Sugar and Confectionery Product Manufacturing | 460 | 0.62 | $ 14.42 | $ 29,980 |
| Special Food Services | 2,910 | 0.61 | $ 16.05 | $ 33,390 |
| Restaurants and Other Eating Places | 42,210 | 0.45 | $ 14.16 | $ 29,450 |
Top paying industries for Bakers:
| Industry | Employment (1) | Percent of industry employment | Hourly mean wage | Annual mean wage (2) |
|---|---|---|---|---|
| Civic and Social Organizations | 80 | 0.03 | $ 20.82 | $ 43,300 |
| General Merchandise Stores | (8) | (8) | $ 19.83 | $ 41,240 |
| Beverage Manufacturing | 40 | 0.02 | $ 19.12 | $ 39,780 |
| Colleges, Universities, and Professional Schools | 420 | 0.01 | $ 18.36 | $ 38,200 |
| Other Amusement and Recreation Industries | 320 | 0.03 | $ 18.30 | $ 38,060 |
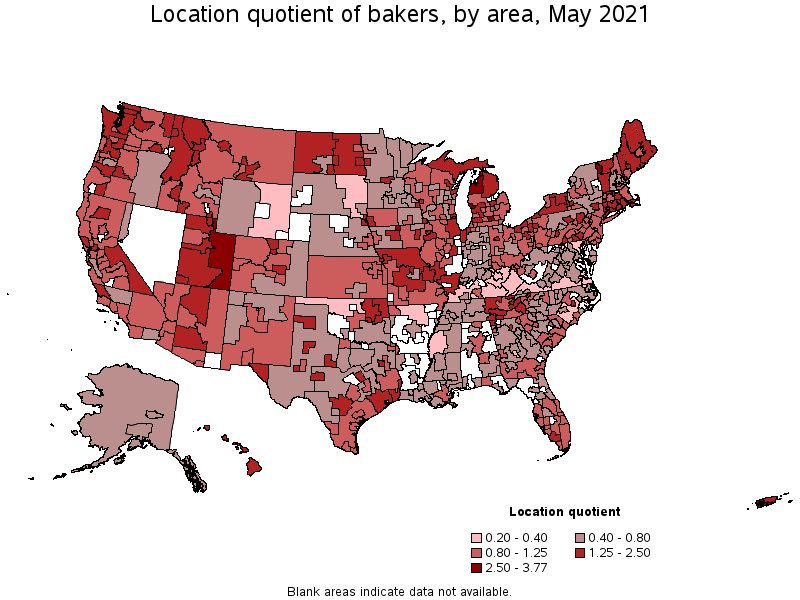
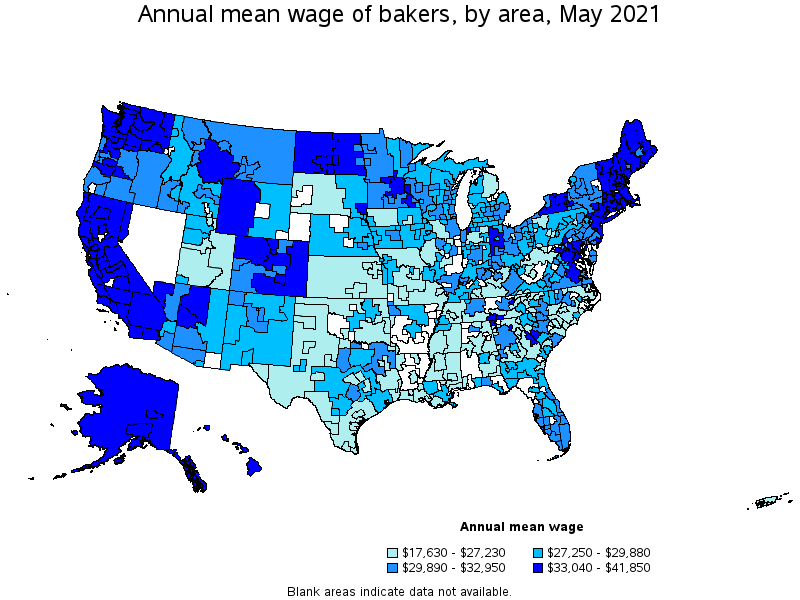
States and areas with the highest published employment, location quotients, and wages for Bakers are provided. For a list of all areas with employment in Bakers, see the Create Customized Tables function.
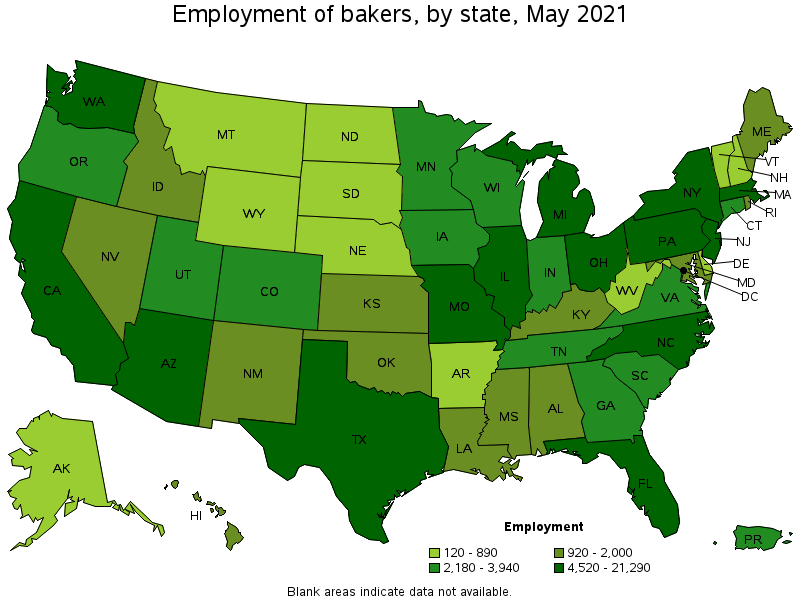
States with the highest employment level in Bakers:
| State | Employment (1) | Employment per thousand jobs | Location quotient (9) | Hourly mean wage | Annual mean wage (2) |
|---|---|---|---|---|---|
| California | 21,290 | 1.29 | 1.00 | $ 17.75 | $ 36,910 |
| Texas | 17,600 | 1.44 | 1.12 | $ 13.43 | $ 27,930 |
| New York | 11,610 | 1.34 | 1.04 | $ 17.29 | $ 35,960 |
| Illinois | 11,500 | 2.05 | 1.59 | $ 15.51 | $ 32,260 |
| Florida | 10,230 | 1.19 | 0.92 | $ 14.56 | $ 30,280 |
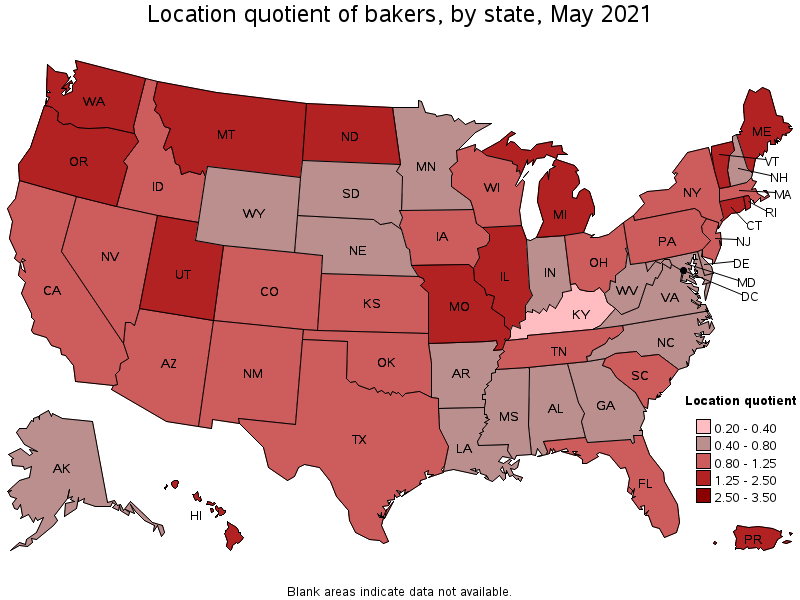
States with the highest concentration of jobs and location quotients in Bakers:
| State | Employment (1) | Employment per thousand jobs | Location quotient (9) | Hourly mean wage | Annual mean wage (2) |
|---|---|---|---|---|---|
| Vermont | 740 | 2.62 | 2.03 | $ 16.94 | $ 35,240 |
| Rhode Island | 1,140 | 2.49 | 1.93 | $ 16.54 | $ 34,400 |
| Hawaii | 1,300 | 2.36 | 1.83 | $ 17.36 | $ 36,100 |
| Illinois | 11,500 | 2.05 | 1.59 | $ 15.51 | $ 32,260 |
| Connecticut | 3,030 | 1.93 | 1.49 | $ 16.52 | $ 34,350 |
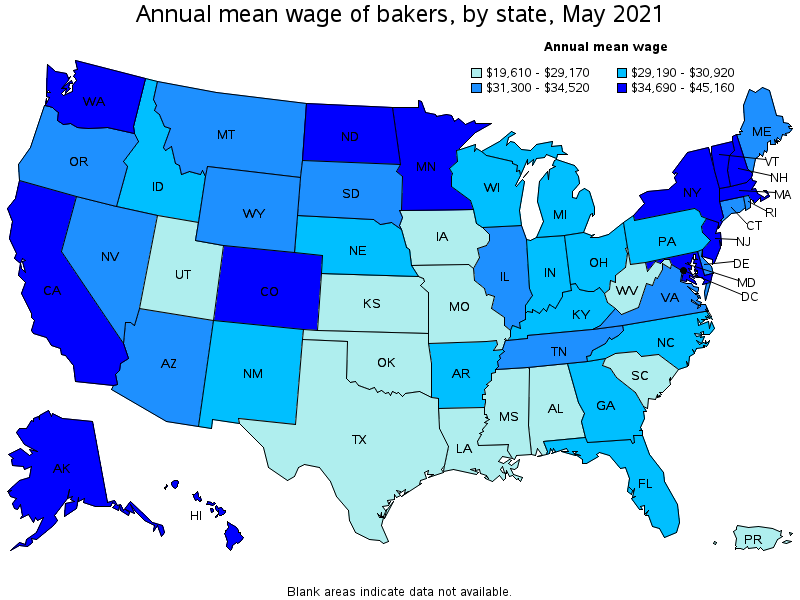
Top paying states for Bakers:
| State | Employment (1) | Employment per thousand jobs | Location quotient (9) | Hourly mean wage | Annual mean wage (2) |
|---|---|---|---|---|---|
| District of Columbia | 680 | 1.02 | 0.79 | $ 21.71 | $ 45,160 |
| New Jersey | 4,920 | 1.28 | 0.99 | $ 18.25 | $ 37,950 |
| Washington | 5,620 | 1.75 | 1.36 | $ 17.75 | $ 36,930 |
| California | 21,290 | 1.29 | 1.00 | $ 17.75 | $ 36,910 |
| Massachusetts | 5,070 | 1.50 | 1.16 | $ 17.60 | $ 36,600 |
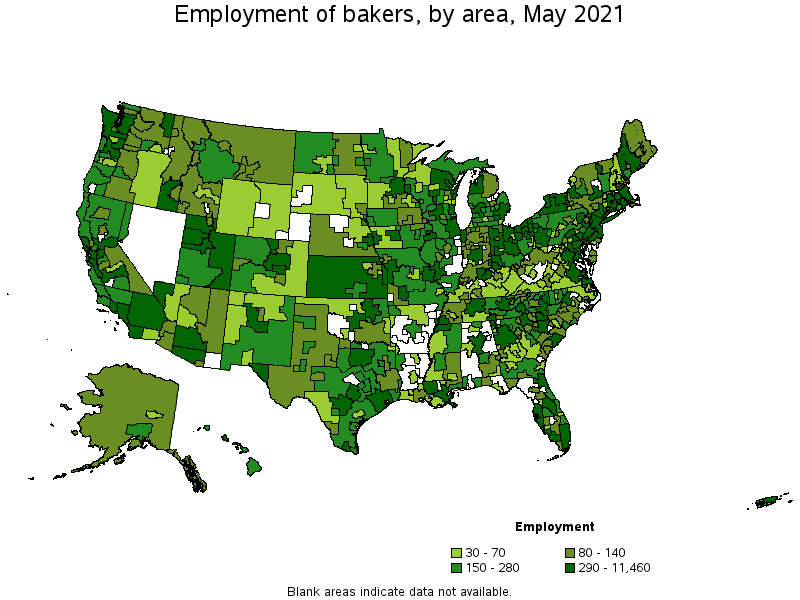
Metropolitan areas with the highest employment level in Bakers:
| Metropolitan area | Employment (1) | Employment per thousand jobs | Location quotient (9) | Hourly mean wage | Annual mean wage (2) |
|---|---|---|---|---|---|
| New York-Newark-Jersey City, NY-NJ-PA | 11,460 | 1.32 | 1.02 | $ 18.20 | $ 37,850 |
| Chicago-Naperville-Elgin, IL-IN-WI | 9,770 | 2.31 | 1.79 | $ 15.84 | $ 32,950 |
| Los Angeles-Long Beach-Anaheim, CA | 7,770 | 1.36 | 1.05 | $ 17.26 | $ 35,890 |
| Houston-The Woodlands-Sugar Land, TX | 4,880 | 1.68 | 1.31 | $ 13.40 | $ 27,870 |
| Boston-Cambridge-Nashua, MA-NH | 3,660 | 1.42 | 1.10 | $ 17.88 | $ 37,190 |
| Philadelphia-Camden-Wilmington, PA-NJ-DE-MD | 3,640 | 1.37 | 1.06 | $ 15.77 | $ 32,790 |
| Phoenix-Mesa-Scottsdale, AZ | 3,610 | 1.70 | 1.32 | $ 15.71 | $ 32,680 |
| Dallas-Fort Worth-Arlington, TX | 3,600 | 1.00 | 0.78 | $ 14.03 | $ 29,190 |
| San Francisco-Oakland-Hayward, CA | 3,490 | 1.56 | 1.21 | $ 19.79 | $ 41,160 |
| Seattle-Tacoma-Bellevue, WA | 3,340 | 1.74 | 1.35 | $ 18.38 | $ 38,240 |
Metropolitan areas with the highest concentration of jobs and location quotients in Bakers:
| Metropolitan area | Employment (1) | Employment per thousand jobs | Location quotient (9) | Hourly mean wage | Annual mean wage (2) |
|---|---|---|---|---|---|
| Muskegon, MI | 210 | 3.77 | 2.93 | $ 12.62 | $ 26,250 |
| Jackson, MI | 200 | 3.76 | 2.92 | $ 13.43 | $ 27,940 |
| Ames, IA | 160 | 3.64 | 2.82 | $ 14.28 | $ 29,700 |
| Burlington-South Burlington, VT | 410 | 3.60 | 2.79 | $ 17.72 | $ 36,850 |
| Bend-Redmond, OR | 250 | 2.98 | 2.31 | $ 16.04 | $ 33,360 |
| San Antonio-New Braunfels, TX | 2,960 | 2.97 | 2.30 | $ 13.75 | $ 28,600 |
| Morristown, TN | 130 | 2.94 | 2.28 | $ 18.14 | $ 37,730 |
| Michigan City-La Porte, IN | 110 | 2.79 | 2.17 | $ 16.61 | $ 34,550 |
| La Crosse-Onalaska, WI-MN | 200 | 2.79 | 2.16 | $ 13.73 | $ 28,550 |
| Twin Falls, ID | 130 | 2.78 | 2.16 | $ 15.82 | $ 32,910 |
Top paying metropolitan areas for Bakers:
| Metropolitan area | Employment (1) | Employment per thousand jobs | Location quotient (9) | Hourly mean wage | Annual mean wage (2) |
|---|---|---|---|---|---|
| San Jose-Sunnyvale-Santa Clara, CA | 980 | 0.92 | 0.71 | $ 20.12 | $ 41,850 |
| Chattanooga, TN-GA | 560 | 2.28 | 1.77 | $ 20.03 | $ 41,660 |
| San Francisco-Oakland-Hayward, CA | 3,490 | 1.56 | 1.21 | $ 19.79 | $ 41,160 |
| Kahului-Wailuku-Lahaina, HI | 180 | 2.74 | 2.12 | $ 19.70 | $ 40,970 |
| Washington-Arlington-Alexandria, DC-VA-MD-WV | 2,460 | 0.84 | 0.65 | $ 18.75 | $ 39,010 |
| Santa Rosa, CA | 420 | 2.21 | 1.72 | $ 18.40 | $ 38,280 |
| Seattle-Tacoma-Bellevue, WA | 3,340 | 1.74 | 1.35 | $ 18.38 | $ 38,240 |
| Napa, CA | 100 | 1.42 | 1.10 | $ 18.32 | $ 38,100 |
| New York-Newark-Jersey City, NY-NJ-PA | 11,460 | 1.32 | 1.02 | $ 18.20 | $ 37,850 |
| Morristown, TN | 130 | 2.94 | 2.28 | $ 18.14 | $ 37,730 |
Nonmetropolitan areas with the highest employment in Bakers:
| Nonmetropolitan area | Employment (1) | Employment per thousand jobs | Location quotient (9) | Hourly mean wage | Annual mean wage (2) |
|---|---|---|---|---|---|
| North Northeastern Ohio nonmetropolitan area (noncontiguous) | 480 | 1.52 | 1.18 | $ 15.45 | $ 32,140 |
| Southwest Maine nonmetropolitan area | 430 | 2.35 | 1.82 | $ 17.08 | $ 35,520 |
| Northwest Lower Peninsula of Michigan nonmetropolitan area | 410 | 3.56 | 2.76 | $ 13.33 | $ 27,720 |
| Kansas nonmetropolitan area | 390 | 1.04 | 0.81 | $ 11.05 | $ 22,990 |
| Southwest New York nonmetropolitan area | 320 | 1.92 | 1.49 | $ 17.50 | $ 36,400 |
Nonmetropolitan areas with the highest concentration of jobs and location quotients in Bakers:
| Nonmetropolitan area | Employment (1) | Employment per thousand jobs | Location quotient (9) | Hourly mean wage | Annual mean wage (2) |
|---|---|---|---|---|---|
| Eastern Utah nonmetropolitan area | 290 | 3.63 | 2.82 | $ 12.88 | $ 26,790 |
| Northwest Lower Peninsula of Michigan nonmetropolitan area | 410 | 3.56 | 2.76 | $ 13.33 | $ 27,720 |
| Central Utah nonmetropolitan area | 170 | 3.14 | 2.43 | $ 10.78 | $ 22,430 |
| Hawaii / Kauai nonmetropolitan area | 280 | 3.11 | 2.41 | $ 17.24 | $ 35,860 |
| Western Washington nonmetropolitan area | 300 | 2.55 | 1.97 | $ 16.60 | $ 34,530 |
Top paying nonmetropolitan areas for Bakers:
| Nonmetropolitan area | Employment (1) | Employment per thousand jobs | Location quotient (9) | Hourly mean wage | Annual mean wage (2) |
|---|---|---|---|---|---|
| West North Dakota nonmetropolitan area | 240 | 2.24 | 1.73 | $ 18.68 | $ 38,850 |
| Southwest New York nonmetropolitan area | 320 | 1.92 | 1.49 | $ 17.50 | $ 36,400 |
| Hawaii / Kauai nonmetropolitan area | 280 | 3.11 | 2.41 | $ 17.24 | $ 35,860 |
| Western Wyoming nonmetropolitan area | 70 | 0.79 | 0.62 | $ 17.23 | $ 35,840 |
| Massachusetts nonmetropolitan area | 100 | 1.76 | 1.37 | $ 17.20 | $ 35,770 |
These estimates are calculated with data collected from employers in all industry sectors, all metropolitan and nonmetropolitan areas, and all states and the District of Columbia. The top employment and wage figures are provided above. The complete list is available in the downloadable XLS files.
The percentile wage estimate is the value of a wage below which a certain percent of workers fall. The median wage is the 50th percentile wage estimate—50 percent of workers earn less than the median and 50 percent of workers earn more than the median. More about percentile wages.
(1) Estimates for detailed occupations do not sum to the totals because the totals include occupations not shown separately. Estimates do not include self-employed workers.
(2) Annual wages have been calculated by multiplying the hourly mean wage by a "year-round, full-time" hours figure of 2,080 hours; for those occupations where there is not an hourly wage published, the annual wage has been directly calculated from the reported survey data.
(3) The relative standard error (RSE) is a measure of the reliability of a survey statistic. The smaller the relative standard error, the more precise the estimate.
(8) Estimate not released.
(9) The location quotient is the ratio of the area concentration of occupational employment to the national average concentration. A location quotient greater than one indicates the occupation has a higher share of employment than average, and a location quotient less than one indicates the occupation is less prevalent in the area than average.
Other OEWS estimates and related information:
May 2021 National Occupational Employment and Wage Estimates
May 2021 State Occupational Employment and Wage Estimates
May 2021 Metropolitan and Nonmetropolitan Area Occupational Employment and Wage Estimates
May 2021 National Industry-Specific Occupational Employment and Wage Estimates
Last Modified Date: March 31, 2022