
An official website of the United States government
An official website of the United States government
The .gov means it's official.
Federal government websites often end in .gov or .mil. Before sharing sensitive information,
make sure you're on a federal government site.
The site is secure.
The
https:// ensures that you are connecting to the official website and that any
information you provide is encrypted and transmitted securely.
Operate or tend food or tobacco roasting, baking, or drying equipment, including hearth ovens, kiln driers, roasters, char kilns, and vacuum drying equipment.
Employment estimate and mean wage estimates for Food and Tobacco Roasting, Baking, and Drying Machine Operators and Tenders:
| Employment (1) | Employment RSE (3) |
Mean hourly wage |
Mean annual wage (2) |
Wage RSE (3) |
|---|---|---|---|---|
| 21,050 | 3.3 % | $ 17.44 | $ 36,280 | 1.1 % |
Percentile wage estimates for Food and Tobacco Roasting, Baking, and Drying Machine Operators and Tenders:
| Percentile | 10% | 25% | 50% (Median) |
75% | 90% |
|---|---|---|---|---|---|
| Hourly Wage | $ 11.29 | $ 13.97 | $ 17.06 | $ 20.85 | $ 23.48 |
| Annual Wage (2) | $ 23,480 | $ 29,060 | $ 35,480 | $ 43,380 | $ 48,840 |
Industries with the highest published employment and wages for Food and Tobacco Roasting, Baking, and Drying Machine Operators and Tenders are provided. For a list of all industries with employment in Food and Tobacco Roasting, Baking, and Drying Machine Operators and Tenders, see the Create Customized Tables function.
Industries with the highest levels of employment in Food and Tobacco Roasting, Baking, and Drying Machine Operators and Tenders:
| Industry | Employment (1) | Percent of industry employment | Hourly mean wage | Annual mean wage (2) |
|---|---|---|---|---|
| Other Food Manufacturing | 4,050 | 1.73 | $ 18.34 | $ 38,140 |
| Animal Slaughtering and Processing | 2,780 | 0.53 | $ 16.48 | $ 34,280 |
| Fruit and Vegetable Preserving and Specialty Food Manufacturing | 2,480 | 1.45 | $ 15.68 | $ 32,620 |
| Bakeries and Tortilla Manufacturing | 2,230 | 0.76 | $ 16.97 | $ 35,300 |
| Restaurants and Other Eating Places | 1,350 | 0.01 | $ 16.78 | $ 34,910 |
Industries with the highest concentration of employment in Food and Tobacco Roasting, Baking, and Drying Machine Operators and Tenders:
| Industry | Employment (1) | Percent of industry employment | Hourly mean wage | Annual mean wage (2) |
|---|---|---|---|---|
| Tobacco Manufacturing | 890 | 8.30 | $ 23.36 | $ 48,600 |
| Other Food Manufacturing | 4,050 | 1.73 | $ 18.34 | $ 38,140 |
| Grain and Oilseed Milling | 990 | 1.57 | $ 24.29 | $ 50,530 |
| Fruit and Vegetable Preserving and Specialty Food Manufacturing | 2,480 | 1.45 | $ 15.68 | $ 32,620 |
| Animal Food Manufacturing | 870 | 1.30 | $ 16.94 | $ 35,230 |
Top paying industries for Food and Tobacco Roasting, Baking, and Drying Machine Operators and Tenders:
| Industry | Employment (1) | Percent of industry employment | Hourly mean wage | Annual mean wage (2) |
|---|---|---|---|---|
| Grain and Oilseed Milling | 990 | 1.57 | $ 24.29 | $ 50,530 |
| Tobacco Manufacturing | 890 | 8.30 | $ 23.36 | $ 48,600 |
| Dairy Product Manufacturing | 720 | 0.47 | $ 20.36 | $ 42,340 |
| Other Food Manufacturing | 4,050 | 1.73 | $ 18.34 | $ 38,140 |
| Seafood Product Preparation and Packaging | 240 | 0.82 | $ 17.65 | $ 36,720 |
States and areas with the highest published employment, location quotients, and wages for Food and Tobacco Roasting, Baking, and Drying Machine Operators and Tenders are provided. For a list of all areas with employment in Food and Tobacco Roasting, Baking, and Drying Machine Operators and Tenders, see the Create Customized Tables function.
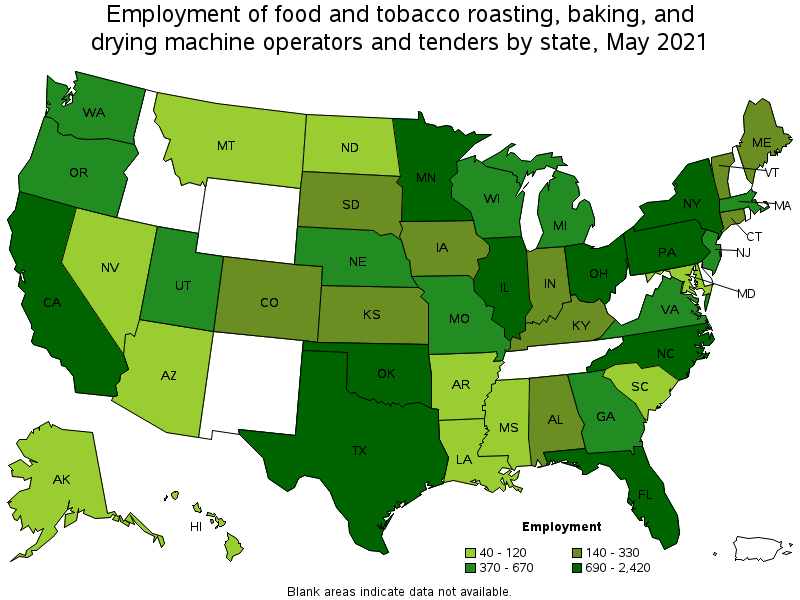
States with the highest employment level in Food and Tobacco Roasting, Baking, and Drying Machine Operators and Tenders:
| State | Employment (1) | Employment per thousand jobs | Location quotient (9) | Hourly mean wage | Annual mean wage (2) |
|---|---|---|---|---|---|
| Texas | 2,420 | 0.20 | 1.33 | $ 13.81 | $ 28,720 |
| California | 1,180 | 0.07 | 0.48 | $ 19.48 | $ 40,520 |
| Minnesota | 1,160 | 0.42 | 2.83 | $ 20.51 | $ 42,650 |
| North Carolina | 940 | 0.21 | 1.42 | $ 21.85 | $ 45,450 |
| New York | 890 | 0.10 | 0.69 | $ 15.96 | $ 33,190 |
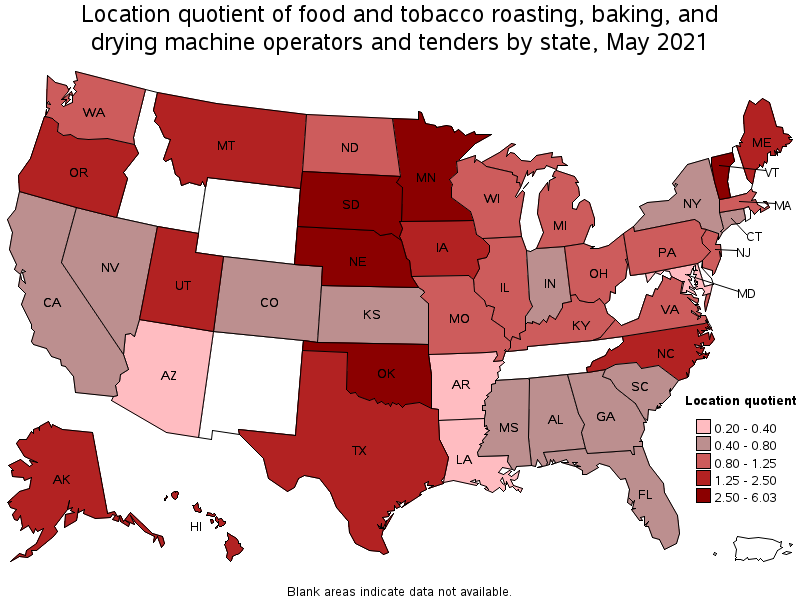
States with the highest concentration of jobs and location quotients in Food and Tobacco Roasting, Baking, and Drying Machine Operators and Tenders:
| State | Employment (1) | Employment per thousand jobs | Location quotient (9) | Hourly mean wage | Annual mean wage (2) |
|---|---|---|---|---|---|
| Vermont | 260 | 0.90 | 6.03 | $ 16.91 | $ 35,180 |
| Nebraska | 600 | 0.62 | 4.17 | $ 17.79 | $ 36,990 |
| Oklahoma | 760 | 0.49 | 3.28 | $ 18.84 | $ 39,190 |
| South Dakota | 180 | 0.43 | 2.90 | $ 18.26 | $ 37,970 |
| Minnesota | 1,160 | 0.42 | 2.83 | $ 20.51 | $ 42,650 |
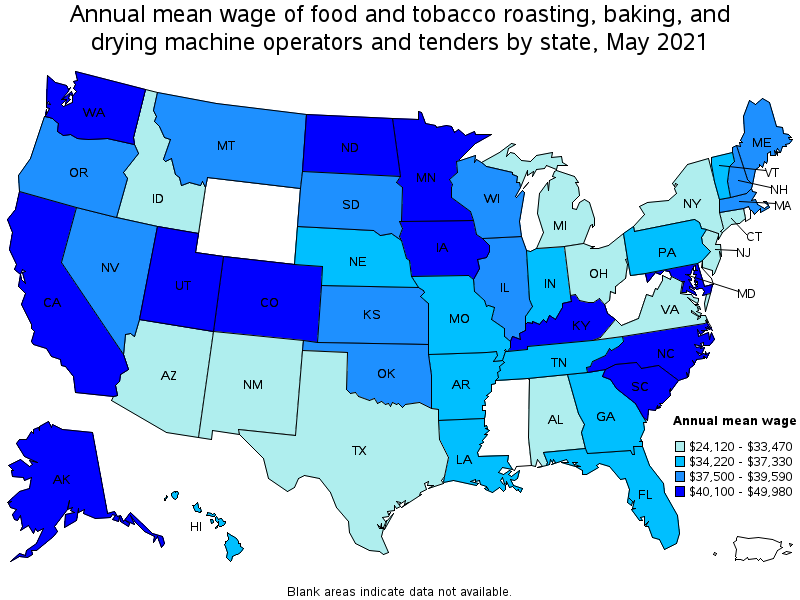
Top paying states for Food and Tobacco Roasting, Baking, and Drying Machine Operators and Tenders:
| State | Employment (1) | Employment per thousand jobs | Location quotient (9) | Hourly mean wage | Annual mean wage (2) |
|---|---|---|---|---|---|
| North Dakota | 50 | 0.13 | 0.85 | $ 24.03 | $ 49,980 |
| Iowa | 300 | 0.20 | 1.34 | $ 22.03 | $ 45,830 |
| North Carolina | 940 | 0.21 | 1.42 | $ 21.85 | $ 45,450 |
| Minnesota | 1,160 | 0.42 | 2.83 | $ 20.51 | $ 42,650 |
| South Carolina | 120 | 0.06 | 0.40 | $ 20.21 | $ 42,030 |
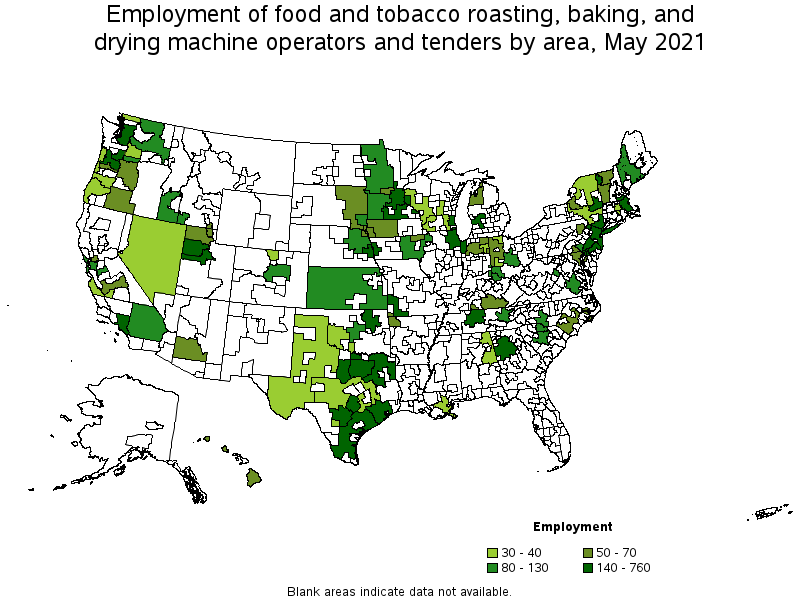
Metropolitan areas with the highest employment level in Food and Tobacco Roasting, Baking, and Drying Machine Operators and Tenders:
| Metropolitan area | Employment (1) | Employment per thousand jobs | Location quotient (9) | Hourly mean wage | Annual mean wage (2) |
|---|---|---|---|---|---|
| New York-Newark-Jersey City, NY-NJ-PA | 760 | 0.09 | 0.58 | $ 15.78 | $ 32,820 |
| Dallas-Fort Worth-Arlington, TX | 750 | 0.21 | 1.40 | $ 14.25 | $ 29,640 |
| Minneapolis-St. Paul-Bloomington, MN-WI | 400 | 0.22 | 1.48 | $ 19.76 | $ 41,100 |
| Portland-Vancouver-Hillsboro, OR-WA | 340 | 0.30 | 2.03 | $ 20.20 | $ 42,010 |
| Philadelphia-Camden-Wilmington, PA-NJ-DE-MD | 340 | 0.13 | 0.86 | $ 15.16 | $ 31,520 |
| Los Angeles-Long Beach-Anaheim, CA | 300 | 0.05 | 0.35 | $ 19.15 | $ 39,830 |
| Chicago-Naperville-Elgin, IL-IN-WI | 250 | 0.06 | 0.39 | $ 18.55 | $ 38,580 |
| Grand Rapids-Wyoming, MI | 240 | 0.47 | 3.13 | $ 14.25 | $ 29,630 |
| Seattle-Tacoma-Bellevue, WA | 240 | 0.12 | 0.82 | $ 21.68 | $ 45,090 |
| Albany-Schenectady-Troy, NY | 230 | 0.56 | 3.74 | $ 16.59 | $ 34,500 |
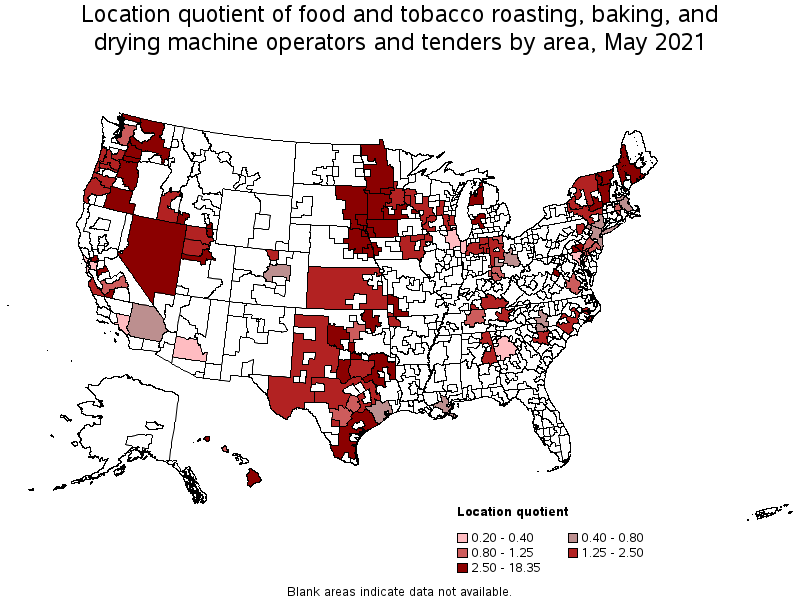
Metropolitan areas with the highest concentration of jobs and location quotients in Food and Tobacco Roasting, Baking, and Drying Machine Operators and Tenders:
| Metropolitan area | Employment (1) | Employment per thousand jobs | Location quotient (9) | Hourly mean wage | Annual mean wage (2) |
|---|---|---|---|---|---|
| Twin Falls, ID | 130 | 2.74 | 18.35 | $ 14.85 | $ 30,880 |
| Harrisonburg, VA | 90 | 1.40 | 9.37 | $ 14.73 | $ 30,630 |
| Burlington-South Burlington, VT | 140 | 1.22 | 8.20 | $ 18.22 | $ 37,900 |
| Logan, UT-ID | 60 | 0.93 | 6.25 | $ 21.36 | $ 44,420 |
| Sioux Falls, SD | 110 | 0.74 | 4.93 | $ 16.79 | $ 34,920 |
| Hanford-Corcoran, CA | 30 | 0.73 | 4.89 | $ 17.59 | $ 36,580 |
| Sioux City, IA-NE-SD | 60 | 0.68 | 4.53 | $ 20.83 | $ 43,320 |
| St. Cloud, MN | 60 | 0.65 | 4.35 | $ 19.87 | $ 41,330 |
| Albany-Schenectady-Troy, NY | 230 | 0.56 | 3.74 | $ 16.59 | $ 34,500 |
| Provo-Orem, UT | 150 | 0.55 | 3.67 | $ 20.64 | $ 42,920 |
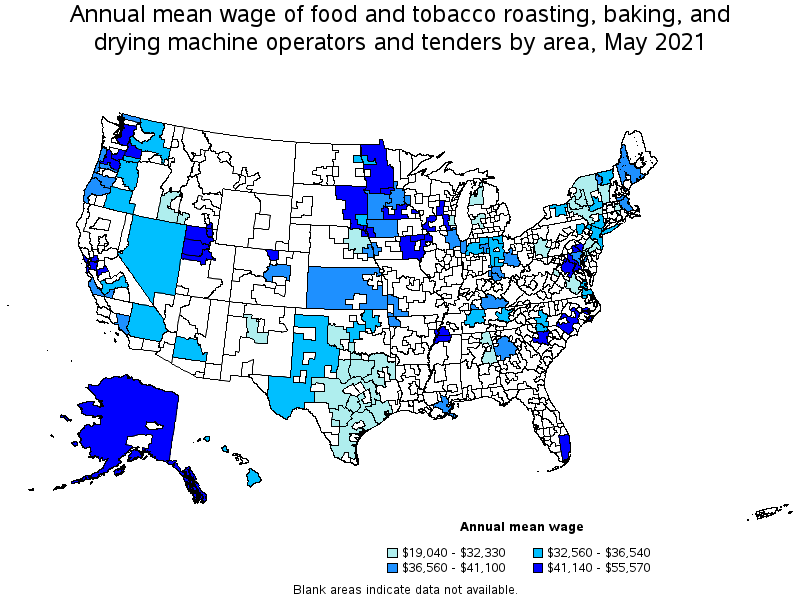
Top paying metropolitan areas for Food and Tobacco Roasting, Baking, and Drying Machine Operators and Tenders:
| Metropolitan area | Employment (1) | Employment per thousand jobs | Location quotient (9) | Hourly mean wage | Annual mean wage (2) |
|---|---|---|---|---|---|
| Miami-Fort Lauderdale-West Palm Beach, FL | (8) | (8) | (8) | $ 26.72 | $ 55,570 |
| Cedar Rapids, IA | 50 | 0.33 | 2.24 | $ 26.62 | $ 55,380 |
| San Francisco-Oakland-Hayward, CA | 110 | 0.05 | 0.33 | $ 23.03 | $ 47,900 |
| Lancaster, PA | 100 | 0.43 | 2.90 | $ 22.46 | $ 46,720 |
| Modesto, CA | 80 | 0.46 | 3.09 | $ 21.82 | $ 45,390 |
| Seattle-Tacoma-Bellevue, WA | 240 | 0.12 | 0.82 | $ 21.68 | $ 45,090 |
| York-Hanover, PA | 70 | 0.42 | 2.78 | $ 21.57 | $ 44,870 |
| Washington-Arlington-Alexandria, DC-VA-MD-WV | (8) | (8) | (8) | $ 21.54 | $ 44,810 |
| Logan, UT-ID | 60 | 0.93 | 6.25 | $ 21.36 | $ 44,420 |
| Fort Collins, CO | 30 | 0.19 | 1.27 | $ 21.10 | $ 43,890 |
Nonmetropolitan areas with the highest employment in Food and Tobacco Roasting, Baking, and Drying Machine Operators and Tenders:
| Nonmetropolitan area | Employment (1) | Employment per thousand jobs | Location quotient (9) | Hourly mean wage | Annual mean wage (2) |
|---|---|---|---|---|---|
| Southeast Minnesota nonmetropolitan area | 350 | 2.39 | 16.02 | $ 22.30 | $ 46,390 |
| North Texas Region of Texas nonmetropolitan area | 170 | 0.63 | 4.21 | $ 12.75 | $ 26,520 |
| Coastal Plains Region of Texas nonmetropolitan area | 160 | 1.10 | 7.37 | $ 11.16 | $ 23,220 |
| Southwest Missouri nonmetropolitan area | 150 | 2.08 | 13.92 | $ 17.58 | $ 36,560 |
| Northeast Nebraska nonmetropolitan area | 120 | 1.32 | 8.85 | $ 15.54 | $ 32,330 |
Nonmetropolitan areas with the highest concentration of jobs and location quotients in Food and Tobacco Roasting, Baking, and Drying Machine Operators and Tenders:
| Nonmetropolitan area | Employment (1) | Employment per thousand jobs | Location quotient (9) | Hourly mean wage | Annual mean wage (2) |
|---|---|---|---|---|---|
| Southeast Minnesota nonmetropolitan area | 350 | 2.39 | 16.02 | $ 22.30 | $ 46,390 |
| Southwest Missouri nonmetropolitan area | 150 | 2.08 | 13.92 | $ 17.58 | $ 36,560 |
| Northeast Nebraska nonmetropolitan area | 120 | 1.32 | 8.85 | $ 15.54 | $ 32,330 |
| Eastern Washington nonmetropolitan area | 120 | 1.23 | 8.21 | $ 16.01 | $ 33,310 |
| Coastal Plains Region of Texas nonmetropolitan area | 160 | 1.10 | 7.37 | $ 11.16 | $ 23,220 |
Top paying nonmetropolitan areas for Food and Tobacco Roasting, Baking, and Drying Machine Operators and Tenders:
| Nonmetropolitan area | Employment (1) | Employment per thousand jobs | Location quotient (9) | Hourly mean wage | Annual mean wage (2) |
|---|---|---|---|---|---|
| Southeast Iowa nonmetropolitan area | 80 | 0.36 | 2.42 | $ 22.99 | $ 47,810 |
| Southeast Minnesota nonmetropolitan area | 350 | 2.39 | 16.02 | $ 22.30 | $ 46,390 |
| East South Dakota nonmetropolitan area | 50 | 0.42 | 2.78 | $ 21.87 | $ 45,480 |
| Southeast Coastal North Carolina nonmetropolitan area | 70 | 0.28 | 1.90 | $ 20.89 | $ 43,440 |
| South Central Wisconsin nonmetropolitan area | 40 | 0.22 | 1.48 | $ 20.48 | $ 42,600 |
These estimates are calculated with data collected from employers in all industry sectors, all metropolitan and nonmetropolitan areas, and all states and the District of Columbia. The top employment and wage figures are provided above. The complete list is available in the downloadable XLS files.
The percentile wage estimate is the value of a wage below which a certain percent of workers fall. The median wage is the 50th percentile wage estimate—50 percent of workers earn less than the median and 50 percent of workers earn more than the median. More about percentile wages.
(1) Estimates for detailed occupations do not sum to the totals because the totals include occupations not shown separately. Estimates do not include self-employed workers.
(2) Annual wages have been calculated by multiplying the hourly mean wage by a "year-round, full-time" hours figure of 2,080 hours; for those occupations where there is not an hourly wage published, the annual wage has been directly calculated from the reported survey data.
(3) The relative standard error (RSE) is a measure of the reliability of a survey statistic. The smaller the relative standard error, the more precise the estimate.
(8) Estimate not released.
(9) The location quotient is the ratio of the area concentration of occupational employment to the national average concentration. A location quotient greater than one indicates the occupation has a higher share of employment than average, and a location quotient less than one indicates the occupation is less prevalent in the area than average.
Other OEWS estimates and related information:
May 2021 National Occupational Employment and Wage Estimates
May 2021 State Occupational Employment and Wage Estimates
May 2021 Metropolitan and Nonmetropolitan Area Occupational Employment and Wage Estimates
May 2021 National Industry-Specific Occupational Employment and Wage Estimates
Last Modified Date: March 31, 2022