
An official website of the United States government
An official website of the United States government
The .gov means it's official.
Federal government websites often end in .gov or .mil. Before sharing sensitive information,
make sure you're on a federal government site.
The site is secure.
The
https:// ensures that you are connecting to the official website and that any
information you provide is encrypted and transmitted securely.
Set up and operate equipment that mixes or blends ingredients used in the manufacturing of food products. Includes candy makers and cheese makers.
Employment estimate and mean wage estimates for Food Batchmakers:
| Employment (1) | Employment RSE (3) |
Mean hourly wage |
Mean annual wage (2) |
Wage RSE (3) |
|---|---|---|---|---|
| 155,240 | 1.7 % | $ 17.40 | $ 36,190 | 0.5 % |
Percentile wage estimates for Food Batchmakers:
| Percentile | 10% | 25% | 50% (Median) |
75% | 90% |
|---|---|---|---|---|---|
| Hourly Wage | $ 11.34 | $ 14.02 | $ 17.20 | $ 21.23 | $ 22.96 |
| Annual Wage (2) | $ 23,590 | $ 29,160 | $ 35,780 | $ 44,170 | $ 47,760 |
Industries with the highest published employment and wages for Food Batchmakers are provided. For a list of all industries with employment in Food Batchmakers, see the Create Customized Tables function.
Industries with the highest levels of employment in Food Batchmakers:
| Industry | Employment (1) | Percent of industry employment | Hourly mean wage | Annual mean wage (2) |
|---|---|---|---|---|
| Bakeries and Tortilla Manufacturing | 26,020 | 8.82 | $ 16.85 | $ 35,050 |
| Other Food Manufacturing | 22,860 | 9.75 | $ 17.32 | $ 36,030 |
| Fruit and Vegetable Preserving and Specialty Food Manufacturing | 21,950 | 12.84 | $ 17.72 | $ 36,850 |
| Dairy Product Manufacturing | 21,570 | 14.08 | $ 19.17 | $ 39,870 |
| Sugar and Confectionery Product Manufacturing | 14,040 | 18.73 | $ 16.29 | $ 33,890 |
Industries with the highest concentration of employment in Food Batchmakers:
| Industry | Employment (1) | Percent of industry employment | Hourly mean wage | Annual mean wage (2) |
|---|---|---|---|---|
| Sugar and Confectionery Product Manufacturing | 14,040 | 18.73 | $ 16.29 | $ 33,890 |
| Dairy Product Manufacturing | 21,570 | 14.08 | $ 19.17 | $ 39,870 |
| Fruit and Vegetable Preserving and Specialty Food Manufacturing | 21,950 | 12.84 | $ 17.72 | $ 36,850 |
| Other Food Manufacturing | 22,860 | 9.75 | $ 17.32 | $ 36,030 |
| Bakeries and Tortilla Manufacturing | 26,020 | 8.82 | $ 16.85 | $ 35,050 |
Top paying industries for Food Batchmakers:
| Industry | Employment (1) | Percent of industry employment | Hourly mean wage | Annual mean wage (2) |
|---|---|---|---|---|
| Grain and Oilseed Milling | 4,430 | 7.04 | $ 24.14 | $ 50,220 |
| Beverage Manufacturing | 5,010 | 1.79 | $ 22.62 | $ 47,040 |
| Pharmaceutical and Medicine Manufacturing | 60 | 0.02 | $ 20.51 | $ 42,650 |
| Dairy Product Manufacturing | 21,570 | 14.08 | $ 19.17 | $ 39,870 |
| Drinking Places (Alcoholic Beverages) | 60 | 0.02 | $ 19.12 | $ 39,760 |
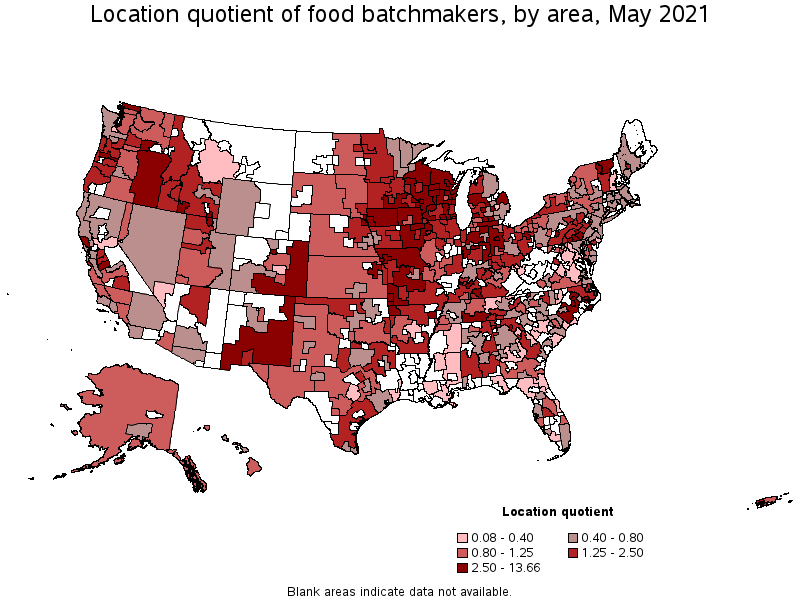
States and areas with the highest published employment, location quotients, and wages for Food Batchmakers are provided. For a list of all areas with employment in Food Batchmakers, see the Create Customized Tables function.
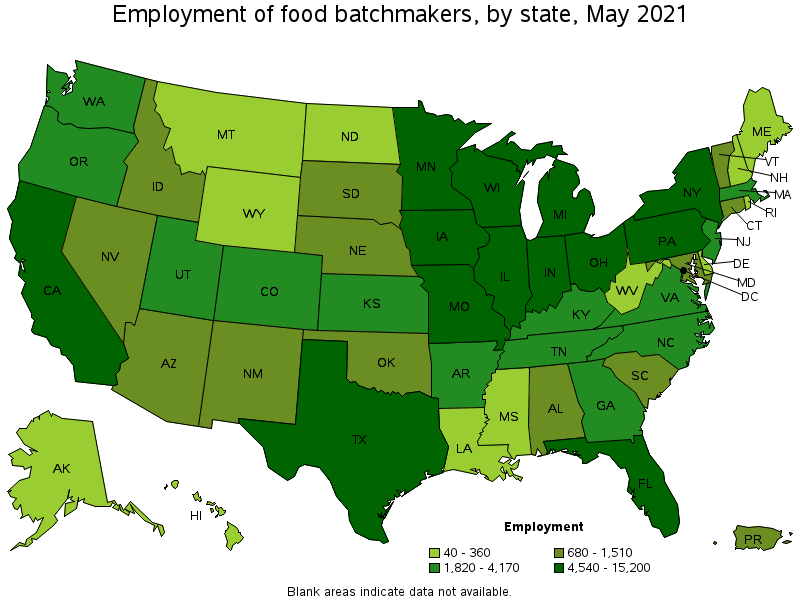
States with the highest employment level in Food Batchmakers:
| State | Employment (1) | Employment per thousand jobs | Location quotient (9) | Hourly mean wage | Annual mean wage (2) |
|---|---|---|---|---|---|
| California | 15,200 | 0.92 | 0.83 | $ 17.56 | $ 36,530 |
| Wisconsin | 13,410 | 4.87 | 4.42 | $ 18.45 | $ 38,380 |
| Illinois | 10,730 | 1.91 | 1.73 | $ 17.89 | $ 37,210 |
| Texas | 8,820 | 0.72 | 0.65 | $ 15.60 | $ 32,450 |
| Ohio | 7,740 | 1.49 | 1.35 | $ 16.98 | $ 35,310 |
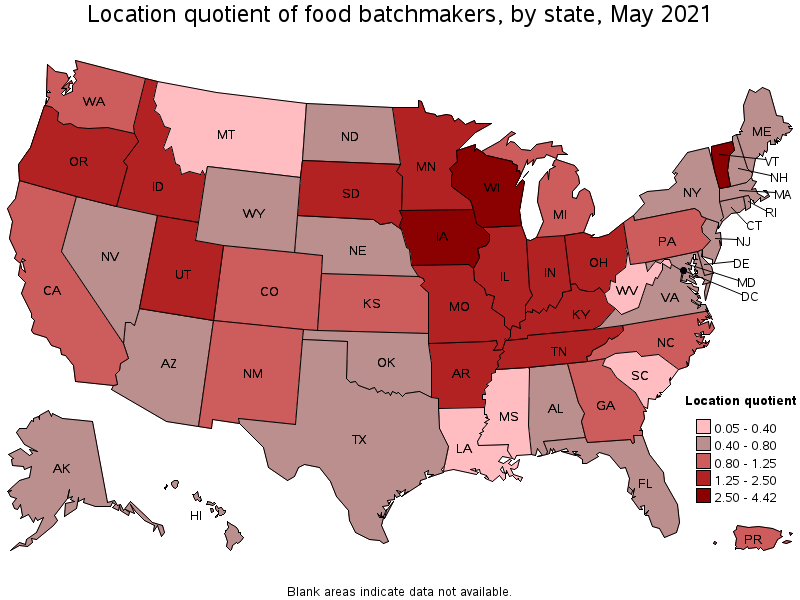
States with the highest concentration of jobs and location quotients in Food Batchmakers:
| State | Employment (1) | Employment per thousand jobs | Location quotient (9) | Hourly mean wage | Annual mean wage (2) |
|---|---|---|---|---|---|
| Wisconsin | 13,410 | 4.87 | 4.42 | $ 18.45 | $ 38,380 |
| Vermont | 1,150 | 4.05 | 3.68 | $ 20.08 | $ 41,760 |
| Iowa | 5,260 | 3.54 | 3.22 | $ 18.44 | $ 38,360 |
| Missouri | 6,140 | 2.25 | 2.04 | $ 19.05 | $ 39,620 |
| Oregon | 3,810 | 2.08 | 1.89 | $ 17.18 | $ 35,740 |
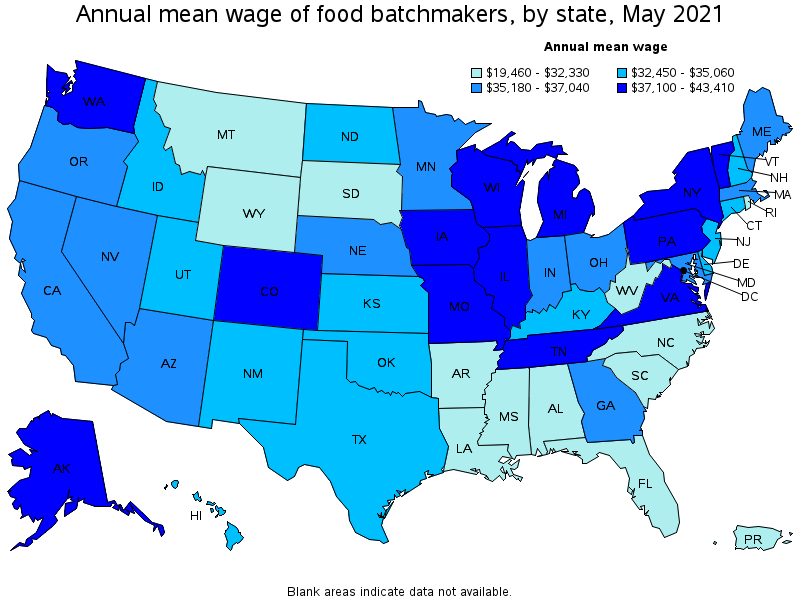
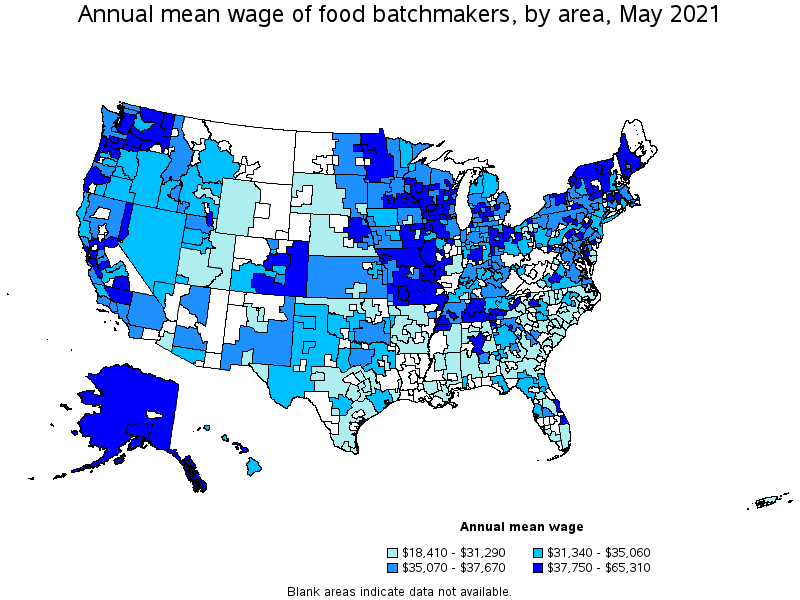
Top paying states for Food Batchmakers:
| State | Employment (1) | Employment per thousand jobs | Location quotient (9) | Hourly mean wage | Annual mean wage (2) |
|---|---|---|---|---|---|
| Alaska | 220 | 0.74 | 0.67 | $ 20.87 | $ 43,410 |
| Vermont | 1,150 | 4.05 | 3.68 | $ 20.08 | $ 41,760 |
| Tennessee | 4,110 | 1.37 | 1.25 | $ 19.38 | $ 40,320 |
| Washington | 4,010 | 1.25 | 1.14 | $ 19.19 | $ 39,920 |
| Missouri | 6,140 | 2.25 | 2.04 | $ 19.05 | $ 39,620 |
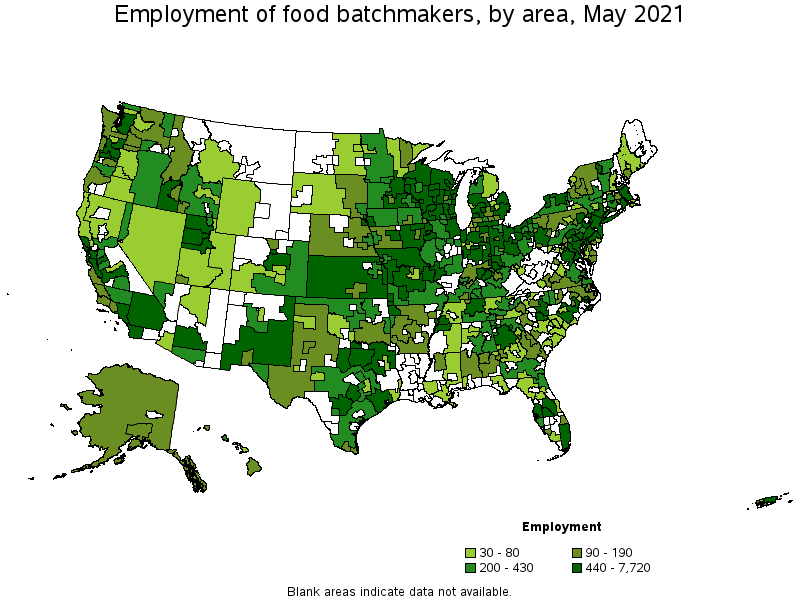
Metropolitan areas with the highest employment level in Food Batchmakers:
| Metropolitan area | Employment (1) | Employment per thousand jobs | Location quotient (9) | Hourly mean wage | Annual mean wage (2) |
|---|---|---|---|---|---|
| Chicago-Naperville-Elgin, IL-IN-WI | 7,720 | 1.82 | 1.66 | $ 17.81 | $ 37,040 |
| Los Angeles-Long Beach-Anaheim, CA | 6,310 | 1.10 | 1.00 | $ 16.96 | $ 35,270 |
| New York-Newark-Jersey City, NY-NJ-PA | 5,020 | 0.58 | 0.52 | $ 16.86 | $ 35,060 |
| Dallas-Fort Worth-Arlington, TX | 2,740 | 0.76 | 0.69 | $ 17.10 | $ 35,580 |
| Minneapolis-St. Paul-Bloomington, MN-WI | 2,730 | 1.50 | 1.36 | $ 17.02 | $ 35,400 |
| Seattle-Tacoma-Bellevue, WA | 2,290 | 1.19 | 1.08 | $ 19.66 | $ 40,880 |
| Milwaukee-Waukesha-West Allis, WI | 2,110 | 2.69 | 2.44 | $ 16.99 | $ 35,330 |
| Portland-Vancouver-Hillsboro, OR-WA | 2,000 | 1.78 | 1.62 | $ 18.23 | $ 37,910 |
| Philadelphia-Camden-Wilmington, PA-NJ-DE-MD | 1,970 | 0.74 | 0.67 | $ 17.78 | $ 36,980 |
| Atlanta-Sandy Springs-Roswell, GA | 1,940 | 0.75 | 0.68 | $ 16.71 | $ 34,750 |
Metropolitan areas with the highest concentration of jobs and location quotients in Food Batchmakers:
| Metropolitan area | Employment (1) | Employment per thousand jobs | Location quotient (9) | Hourly mean wage | Annual mean wage (2) |
|---|---|---|---|---|---|
| Joplin, MO | 1,160 | 15.05 | 13.66 | $ 17.89 | $ 37,210 |
| Sioux City, IA-NE-SD | 1,200 | 14.35 | 13.02 | $ 17.49 | $ 36,380 |
| Sheboygan, WI | 720 | 12.39 | 11.24 | $ 19.45 | $ 40,450 |
| Wausau, WI | 700 | 10.27 | 9.32 | $ 20.13 | $ 41,870 |
| Appleton, WI | 1,080 | 9.18 | 8.33 | $ 19.14 | $ 39,810 |
| La Crosse-Onalaska, WI-MN | 640 | 8.82 | 8.01 | $ 18.63 | $ 38,750 |
| Gainesville, GA | 660 | 7.35 | 6.67 | $ 20.90 | $ 43,470 |
| Gettysburg, PA | 220 | 6.81 | 6.18 | $ 18.05 | $ 37,550 |
| Fond du Lac, WI | 290 | 6.66 | 6.04 | $ 19.29 | $ 40,130 |
| Green Bay, WI | 950 | 5.77 | 5.23 | $ 18.93 | $ 39,380 |
Top paying metropolitan areas for Food Batchmakers:
| Metropolitan area | Employment (1) | Employment per thousand jobs | Location quotient (9) | Hourly mean wage | Annual mean wage (2) |
|---|---|---|---|---|---|
| Battle Creek, MI | 260 | 5.20 | 4.72 | $ 31.40 | $ 65,310 |
| Cedar Rapids, IA | 720 | 5.26 | 4.77 | $ 27.36 | $ 56,900 |
| Binghamton, NY | 80 | 0.85 | 0.77 | $ 24.48 | $ 50,910 |
| Bloomsburg-Berwick, PA | 100 | 2.55 | 2.32 | $ 23.93 | $ 49,780 |
| Port St. Lucie, FL | 140 | 0.92 | 0.84 | $ 22.94 | $ 47,700 |
| Albany-Schenectady-Troy, NY | 270 | 0.65 | 0.59 | $ 22.41 | $ 46,610 |
| Allentown-Bethlehem-Easton, PA-NJ | 480 | 1.38 | 1.25 | $ 21.94 | $ 45,630 |
| Gainesville, GA | 660 | 7.35 | 6.67 | $ 20.90 | $ 43,470 |
| Rochester, MN | 220 | 1.90 | 1.73 | $ 20.86 | $ 43,380 |
| Lancaster, PA | 820 | 3.48 | 3.15 | $ 20.76 | $ 43,180 |
Nonmetropolitan areas with the highest employment in Food Batchmakers:
| Nonmetropolitan area | Employment (1) | Employment per thousand jobs | Location quotient (9) | Hourly mean wage | Annual mean wage (2) |
|---|---|---|---|---|---|
| South Central Wisconsin nonmetropolitan area | 1,930 | 9.66 | 8.77 | $ 18.86 | $ 39,230 |
| West Northwestern Ohio nonmetropolitan area | 1,150 | 4.81 | 4.36 | $ 20.70 | $ 43,060 |
| Western Wisconsin nonmetropolitan area | 1,140 | 8.52 | 7.73 | $ 18.64 | $ 38,760 |
| Southeast Iowa nonmetropolitan area | 990 | 4.73 | 4.29 | $ 18.40 | $ 38,280 |
| Northeastern Wisconsin nonmetropolitan area | 960 | 5.03 | 4.56 | $ 17.36 | $ 36,120 |
Nonmetropolitan areas with the highest concentration of jobs and location quotients in Food Batchmakers:
| Nonmetropolitan area | Employment (1) | Employment per thousand jobs | Location quotient (9) | Hourly mean wage | Annual mean wage (2) |
|---|---|---|---|---|---|
| Northwestern Wisconsin nonmetropolitan area | 520 | 10.97 | 9.95 | $ 18.07 | $ 37,590 |
| South Central Wisconsin nonmetropolitan area | 1,930 | 9.66 | 8.77 | $ 18.86 | $ 39,230 |
| Western Wisconsin nonmetropolitan area | 1,140 | 8.52 | 7.73 | $ 18.64 | $ 38,760 |
| North Missouri nonmetropolitan area | 760 | 7.36 | 6.68 | $ 18.47 | $ 38,410 |
| Northern Vermont nonmetropolitan area | 400 | 6.07 | 5.51 | $ 21.62 | $ 44,970 |
Top paying nonmetropolitan areas for Food Batchmakers:
| Nonmetropolitan area | Employment (1) | Employment per thousand jobs | Location quotient (9) | Hourly mean wage | Annual mean wage (2) |
|---|---|---|---|---|---|
| Alaska nonmetropolitan area | 100 | 1.04 | 0.95 | $ 23.99 | $ 49,910 |
| Northern Vermont nonmetropolitan area | 400 | 6.07 | 5.51 | $ 21.62 | $ 44,970 |
| West Northwestern Ohio nonmetropolitan area | 1,150 | 4.81 | 4.36 | $ 20.70 | $ 43,060 |
| Northwest Illinois nonmetropolitan area | 290 | 2.30 | 2.09 | $ 20.69 | $ 43,030 |
| Eastern and Southern Colorado nonmetropolitan area | 260 | 3.90 | 3.54 | $ 20.30 | $ 42,220 |
These estimates are calculated with data collected from employers in all industry sectors, all metropolitan and nonmetropolitan areas, and all states and the District of Columbia. The top employment and wage figures are provided above. The complete list is available in the downloadable XLS files.
The percentile wage estimate is the value of a wage below which a certain percent of workers fall. The median wage is the 50th percentile wage estimate—50 percent of workers earn less than the median and 50 percent of workers earn more than the median. More about percentile wages.
(1) Estimates for detailed occupations do not sum to the totals because the totals include occupations not shown separately. Estimates do not include self-employed workers.
(2) Annual wages have been calculated by multiplying the hourly mean wage by a "year-round, full-time" hours figure of 2,080 hours; for those occupations where there is not an hourly wage published, the annual wage has been directly calculated from the reported survey data.
(3) The relative standard error (RSE) is a measure of the reliability of a survey statistic. The smaller the relative standard error, the more precise the estimate.
(9) The location quotient is the ratio of the area concentration of occupational employment to the national average concentration. A location quotient greater than one indicates the occupation has a higher share of employment than average, and a location quotient less than one indicates the occupation is less prevalent in the area than average.
Other OEWS estimates and related information:
May 2021 National Occupational Employment and Wage Estimates
May 2021 State Occupational Employment and Wage Estimates
May 2021 Metropolitan and Nonmetropolitan Area Occupational Employment and Wage Estimates
May 2021 National Industry-Specific Occupational Employment and Wage Estimates
Last Modified Date: March 31, 2022