
An official website of the United States government
An official website of the United States government
The .gov means it's official.
Federal government websites often end in .gov or .mil. Before sharing sensitive information,
make sure you're on a federal government site.
The site is secure.
The
https:// ensures that you are connecting to the official website and that any
information you provide is encrypted and transmitted securely.
Use hand-welding, flame-cutting, hand-soldering, or brazing equipment to weld or join metal components or to fill holes, indentations, or seams of fabricated metal products.
Employment estimate and mean wage estimates for Welders, Cutters, Solderers, and Brazers:
| Employment (1) | Employment RSE (3) |
Mean hourly wage |
Mean annual wage (2) |
Wage RSE (3) |
|---|---|---|---|---|
| 397,600 | 0.8 % | $ 23.21 | $ 48,290 | 0.2 % |
Percentile wage estimates for Welders, Cutters, Solderers, and Brazers:
| Percentile | 10% | 25% | 50% (Median) |
75% | 90% |
|---|---|---|---|---|---|
| Hourly Wage | $ 15.07 | $ 18.20 | $ 22.60 | $ 27.33 | $ 30.61 |
| Annual Wage (2) | $ 31,350 | $ 37,860 | $ 47,010 | $ 56,850 | $ 63,660 |
Industries with the highest published employment and wages for Welders, Cutters, Solderers, and Brazers are provided. For a list of all industries with employment in Welders, Cutters, Solderers, and Brazers, see the Create Customized Tables function.
Industries with the highest levels of employment in Welders, Cutters, Solderers, and Brazers:
| Industry | Employment (1) | Percent of industry employment | Hourly mean wage | Annual mean wage (2) |
|---|---|---|---|---|
| Fabricated Metal Product Manufacturing (3323 and 3324 only) | 67,700 | 14.59 | $ 22.02 | $ 45,800 |
| Machinery Manufacturing (3331, 3332, 3334, and 3339 only) | 58,150 | 8.30 | $ 22.21 | $ 46,200 |
| Motor Vehicle Body and Trailer Manufacturing | 24,110 | 15.44 | $ 20.30 | $ 42,220 |
| Fabricated Metal Product Manufacturing (3321, 3322, 3325, 3326, and 3329 only) | 23,590 | 5.28 | $ 21.54 | $ 44,800 |
| Ship and Boat Building | 14,980 | 10.37 | $ 25.83 | $ 53,720 |
Industries with the highest concentration of employment in Welders, Cutters, Solderers, and Brazers:
| Industry | Employment (1) | Percent of industry employment | Hourly mean wage | Annual mean wage (2) |
|---|---|---|---|---|
| Motor Vehicle Body and Trailer Manufacturing | 24,110 | 15.44 | $ 20.30 | $ 42,220 |
| Fabricated Metal Product Manufacturing (3323 and 3324 only) | 67,700 | 14.59 | $ 22.02 | $ 45,800 |
| Railroad Rolling Stock Manufacturing | 2,380 | 12.05 | $ 23.03 | $ 47,900 |
| Ship and Boat Building | 14,980 | 10.37 | $ 25.83 | $ 53,720 |
| Other Transportation Equipment Manufacturing | 3,030 | 8.33 | $ 25.60 | $ 53,250 |
Top paying industries for Welders, Cutters, Solderers, and Brazers:
| Industry | Employment (1) | Percent of industry employment | Hourly mean wage | Annual mean wage (2) |
|---|---|---|---|---|
| Electric Power Generation, Transmission and Distribution | 1,040 | 0.28 | $ 44.29 | $ 92,130 |
| Natural Gas Distribution | 720 | 0.65 | $ 42.76 | $ 88,940 |
| Pipeline Transportation of Crude Oil | 70 | 0.63 | $ 42.26 | $ 87,900 |
| Pipeline Transportation of Natural Gas | 240 | 0.79 | $ 38.73 | $ 80,560 |
| Petroleum and Coal Products Manufacturing | 550 | 0.53 | $ 37.08 | $ 77,130 |
States and areas with the highest published employment, location quotients, and wages for Welders, Cutters, Solderers, and Brazers are provided. For a list of all areas with employment in Welders, Cutters, Solderers, and Brazers, see the Create Customized Tables function.
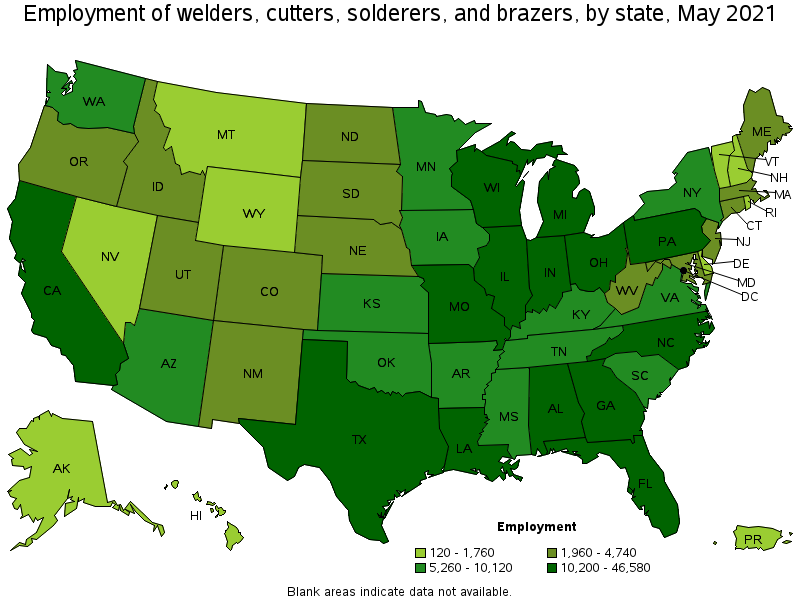
States with the highest employment level in Welders, Cutters, Solderers, and Brazers:
| State | Employment (1) | Employment per thousand jobs | Location quotient (9) | Hourly mean wage | Annual mean wage (2) |
|---|---|---|---|---|---|
| Texas | 46,580 | 3.81 | 1.35 | $ 24.31 | $ 50,560 |
| California | 30,080 | 1.82 | 0.64 | $ 25.22 | $ 52,460 |
| Ohio | 17,710 | 3.40 | 1.21 | $ 21.48 | $ 44,670 |
| Pennsylvania | 17,320 | 3.10 | 1.10 | $ 23.20 | $ 48,250 |
| Wisconsin | 16,570 | 6.02 | 2.13 | $ 23.97 | $ 49,850 |
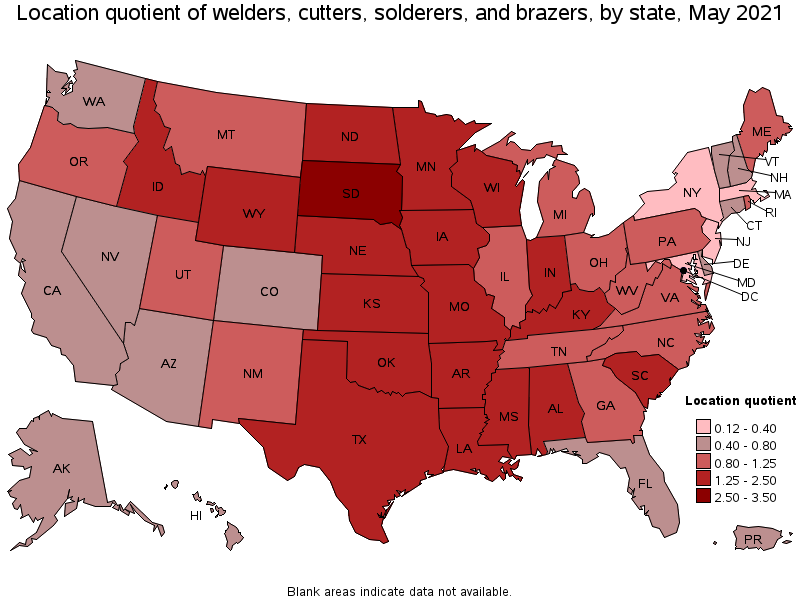
States with the highest concentration of jobs and location quotients in Welders, Cutters, Solderers, and Brazers:
| State | Employment (1) | Employment per thousand jobs | Location quotient (9) | Hourly mean wage | Annual mean wage (2) |
|---|---|---|---|---|---|
| South Dakota | 3,150 | 7.48 | 2.65 | $ 20.46 | $ 42,560 |
| North Dakota | 2,680 | 6.79 | 2.41 | $ 27.67 | $ 57,550 |
| Wyoming | 1,760 | 6.74 | 2.39 | $ 30.42 | $ 63,280 |
| Louisiana | 11,360 | 6.33 | 2.24 | $ 25.37 | $ 52,780 |
| Oklahoma | 9,440 | 6.06 | 2.15 | $ 22.05 | $ 45,860 |
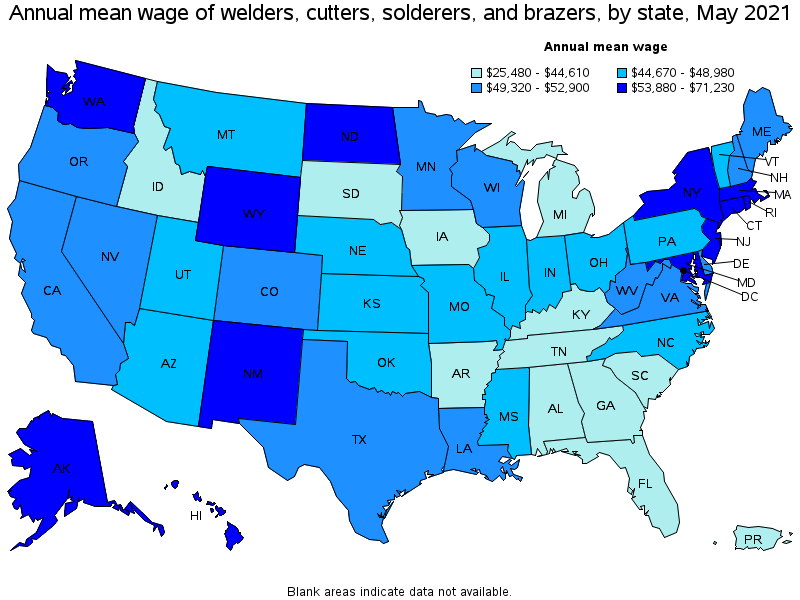
Top paying states for Welders, Cutters, Solderers, and Brazers:
| State | Employment (1) | Employment per thousand jobs | Location quotient (9) | Hourly mean wage | Annual mean wage (2) |
|---|---|---|---|---|---|
| District of Columbia | 230 | 0.35 | 0.12 | $ 34.25 | $ 71,230 |
| Alaska | 560 | 1.89 | 0.67 | $ 33.89 | $ 70,490 |
| Hawaii | 700 | 1.28 | 0.45 | $ 31.74 | $ 66,020 |
| Wyoming | 1,760 | 6.74 | 2.39 | $ 30.42 | $ 63,280 |
| North Dakota | 2,680 | 6.79 | 2.41 | $ 27.67 | $ 57,550 |
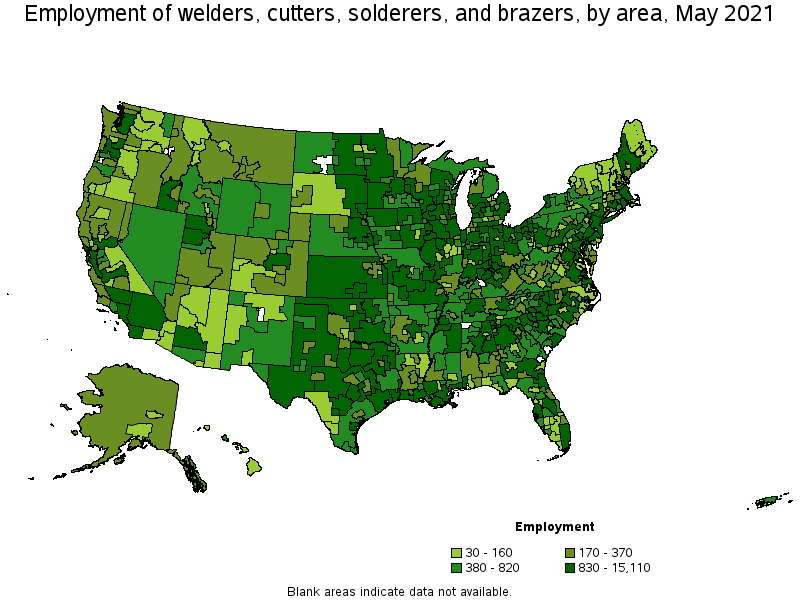
Metropolitan areas with the highest employment level in Welders, Cutters, Solderers, and Brazers:
| Metropolitan area | Employment (1) | Employment per thousand jobs | Location quotient (9) | Hourly mean wage | Annual mean wage (2) |
|---|---|---|---|---|---|
| Houston-The Woodlands-Sugar Land, TX | 15,110 | 5.22 | 1.85 | $ 25.64 | $ 53,320 |
| Dallas-Fort Worth-Arlington, TX | 10,220 | 2.85 | 1.01 | $ 23.49 | $ 48,850 |
| Chicago-Naperville-Elgin, IL-IN-WI | 9,160 | 2.16 | 0.77 | $ 22.86 | $ 47,550 |
| Los Angeles-Long Beach-Anaheim, CA | 8,900 | 1.56 | 0.55 | $ 24.49 | $ 50,940 |
| New York-Newark-Jersey City, NY-NJ-PA | 5,670 | 0.65 | 0.23 | $ 28.82 | $ 59,950 |
| Atlanta-Sandy Springs-Roswell, GA | 5,530 | 2.14 | 0.76 | $ 22.00 | $ 45,770 |
| Detroit-Warren-Dearborn, MI | 5,370 | 2.98 | 1.06 | $ 21.76 | $ 45,260 |
| Minneapolis-St. Paul-Bloomington, MN-WI | 5,250 | 2.88 | 1.02 | $ 24.82 | $ 51,620 |
| Virginia Beach-Norfolk-Newport News, VA-NC | 4,480 | 6.30 | 2.23 | $ 26.22 | $ 54,530 |
| Phoenix-Mesa-Scottsdale, AZ | 4,300 | 2.03 | 0.72 | $ 23.41 | $ 48,700 |
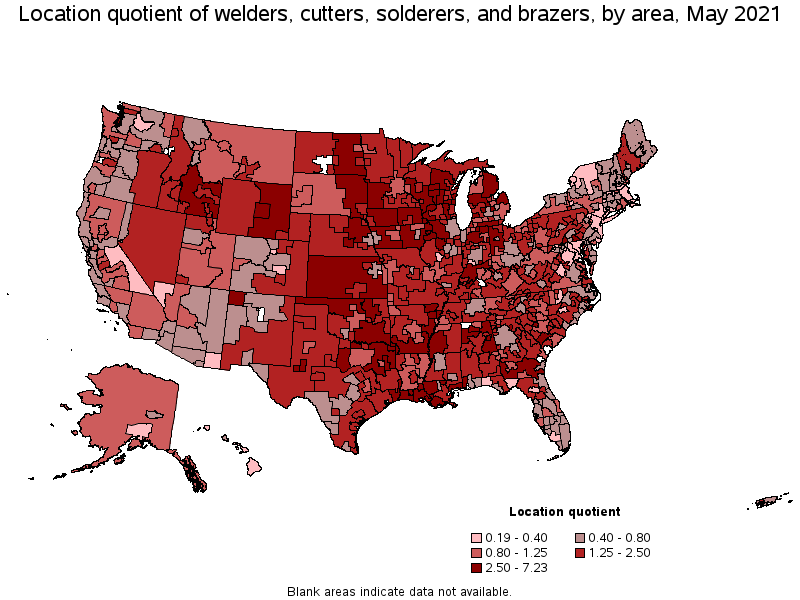
Metropolitan areas with the highest concentration of jobs and location quotients in Welders, Cutters, Solderers, and Brazers:
| Metropolitan area | Employment (1) | Employment per thousand jobs | Location quotient (9) | Hourly mean wage | Annual mean wage (2) |
|---|---|---|---|---|---|
| Elkhart-Goshen, IN | 2,730 | 20.41 | 7.23 | $ 21.83 | $ 45,400 |
| Houma-Thibodaux, LA | 1,380 | 17.29 | 6.13 | $ 23.22 | $ 48,290 |
| Sheboygan, WI | 910 | 15.81 | 5.60 | $ 22.46 | $ 46,710 |
| Gulfport-Biloxi-Pascagoula, MS | 2,250 | 15.41 | 5.46 | $ 26.44 | $ 54,990 |
| Gainesville, GA | 970 | 10.79 | 3.82 | $ 19.15 | $ 39,830 |
| Peoria, IL | 1,670 | 10.64 | 3.77 | $ 21.06 | $ 43,800 |
| Beaumont-Port Arthur, TX | 1,510 | 10.24 | 3.63 | $ 27.51 | $ 57,220 |
| Lake Charles, LA | 880 | 9.79 | 3.47 | $ 27.34 | $ 56,860 |
| Longview, TX | 870 | 9.66 | 3.42 | $ 23.24 | $ 48,340 |
| Anniston-Oxford-Jacksonville, AL | 420 | 9.65 | 3.42 | $ 23.56 | $ 49,000 |
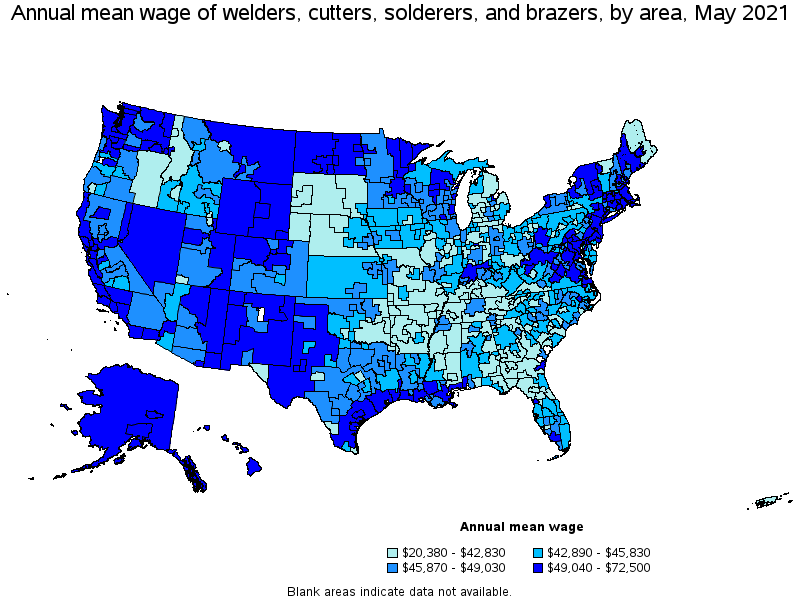
Top paying metropolitan areas for Welders, Cutters, Solderers, and Brazers:
| Metropolitan area | Employment (1) | Employment per thousand jobs | Location quotient (9) | Hourly mean wage | Annual mean wage (2) |
|---|---|---|---|---|---|
| Fairbanks, AK | 70 | 2.18 | 0.77 | $ 34.86 | $ 72,500 |
| Anchorage, AK | 160 | 0.99 | 0.35 | $ 34.54 | $ 71,840 |
| Urban Honolulu, HI | 590 | 1.50 | 0.53 | $ 32.17 | $ 66,920 |
| Kahului-Wailuku-Lahaina, HI | 30 | 0.54 | 0.19 | $ 30.98 | $ 64,430 |
| Bremerton-Silverdale, WA | 680 | 7.86 | 2.79 | $ 30.86 | $ 64,180 |
| Atlantic City-Hammonton, NJ | 90 | 0.79 | 0.28 | $ 30.76 | $ 63,980 |
| Mount Vernon-Anacortes, WA | 280 | 6.01 | 2.13 | $ 30.26 | $ 62,950 |
| San Jose-Sunnyvale-Santa Clara, CA | 1,420 | 1.33 | 0.47 | $ 29.51 | $ 61,380 |
| San Francisco-Oakland-Hayward, CA | 2,540 | 1.13 | 0.40 | $ 29.48 | $ 61,330 |
| Seattle-Tacoma-Bellevue, WA | 2,770 | 1.44 | 0.51 | $ 29.00 | $ 60,320 |
Nonmetropolitan areas with the highest employment in Welders, Cutters, Solderers, and Brazers:
| Nonmetropolitan area | Employment (1) | Employment per thousand jobs | Location quotient (9) | Hourly mean wage | Annual mean wage (2) |
|---|---|---|---|---|---|
| Kansas nonmetropolitan area | 2,840 | 7.56 | 2.68 | $ 21.01 | $ 43,690 |
| North Texas Region of Texas nonmetropolitan area | 2,560 | 9.62 | 3.41 | $ 22.66 | $ 47,140 |
| Southern Indiana nonmetropolitan area | 2,270 | 12.38 | 4.39 | $ 25.45 | $ 52,930 |
| West Northwestern Ohio nonmetropolitan area | 2,180 | 9.12 | 3.23 | $ 22.40 | $ 46,590 |
| North Northeastern Ohio nonmetropolitan area (noncontiguous) | 2,140 | 6.81 | 2.41 | $ 21.09 | $ 43,870 |
Nonmetropolitan areas with the highest concentration of jobs and location quotients in Welders, Cutters, Solderers, and Brazers:
| Nonmetropolitan area | Employment (1) | Employment per thousand jobs | Location quotient (9) | Hourly mean wage | Annual mean wage (2) |
|---|---|---|---|---|---|
| East North Dakota nonmetropolitan area | 1,110 | 18.20 | 6.45 | $ 27.34 | $ 56,870 |
| East South Dakota nonmetropolitan area | 1,810 | 14.26 | 5.05 | $ 20.30 | $ 42,220 |
| Southern Indiana nonmetropolitan area | 2,270 | 12.38 | 4.39 | $ 25.45 | $ 52,930 |
| Northeast Nebraska nonmetropolitan area | 1,020 | 11.14 | 3.95 | $ 20.69 | $ 43,030 |
| Northeastern Wisconsin nonmetropolitan area | 2,120 | 11.10 | 3.93 | $ 24.27 | $ 50,480 |
Top paying nonmetropolitan areas for Welders, Cutters, Solderers, and Brazers:
| Nonmetropolitan area | Employment (1) | Employment per thousand jobs | Location quotient (9) | Hourly mean wage | Annual mean wage (2) |
|---|---|---|---|---|---|
| West North Dakota nonmetropolitan area | 520 | 4.90 | 1.74 | $ 34.25 | $ 71,250 |
| Alaska nonmetropolitan area | 320 | 3.32 | 1.17 | $ 33.38 | $ 69,430 |
| Eastern Wyoming nonmetropolitan area | 710 | 8.84 | 3.13 | $ 32.35 | $ 67,290 |
| Western Wyoming nonmetropolitan area | 380 | 4.04 | 1.43 | $ 30.92 | $ 64,310 |
| Nevada nonmetropolitan area | 450 | 4.66 | 1.65 | $ 29.67 | $ 61,720 |
These estimates are calculated with data collected from employers in all industry sectors, all metropolitan and nonmetropolitan areas, and all states and the District of Columbia. The top employment and wage figures are provided above. The complete list is available in the downloadable XLS files.
The percentile wage estimate is the value of a wage below which a certain percent of workers fall. The median wage is the 50th percentile wage estimate—50 percent of workers earn less than the median and 50 percent of workers earn more than the median. More about percentile wages.
(1) Estimates for detailed occupations do not sum to the totals because the totals include occupations not shown separately. Estimates do not include self-employed workers.
(2) Annual wages have been calculated by multiplying the hourly mean wage by a "year-round, full-time" hours figure of 2,080 hours; for those occupations where there is not an hourly wage published, the annual wage has been directly calculated from the reported survey data.
(3) The relative standard error (RSE) is a measure of the reliability of a survey statistic. The smaller the relative standard error, the more precise the estimate.
(9) The location quotient is the ratio of the area concentration of occupational employment to the national average concentration. A location quotient greater than one indicates the occupation has a higher share of employment than average, and a location quotient less than one indicates the occupation is less prevalent in the area than average.
Other OEWS estimates and related information:
May 2021 National Occupational Employment and Wage Estimates
May 2021 State Occupational Employment and Wage Estimates
May 2021 Metropolitan and Nonmetropolitan Area Occupational Employment and Wage Estimates
May 2021 National Industry-Specific Occupational Employment and Wage Estimates
Last Modified Date: March 31, 2022