
An official website of the United States government
An official website of the United States government
The .gov means it's official.
Federal government websites often end in .gov or .mil. Before sharing sensitive information,
make sure you're on a federal government site.
The site is secure.
The
https:// ensures that you are connecting to the official website and that any
information you provide is encrypted and transmitted securely.
Set up, operate, or tend welding, soldering, or brazing machines or robots that weld, braze, solder, or heat treat metal products, components, or assemblies. Includes workers who operate laser cutters or laser-beam machines.
Employment estimate and mean wage estimates for Welding, Soldering, and Brazing Machine Setters, Operators, and Tenders:
| Employment (1) | Employment RSE (3) |
Mean hourly wage |
Mean annual wage (2) |
Wage RSE (3) |
|---|---|---|---|---|
| 29,980 | 3.4 % | $ 20.65 | $ 42,950 | 0.8 % |
Percentile wage estimates for Welding, Soldering, and Brazing Machine Setters, Operators, and Tenders:
| Percentile | 10% | 25% | 50% (Median) |
75% | 90% |
|---|---|---|---|---|---|
| Hourly Wage | $ 14.43 | $ 17.32 | $ 18.55 | $ 23.22 | $ 28.71 |
| Annual Wage (2) | $ 30,010 | $ 36,020 | $ 38,580 | $ 48,290 | $ 59,720 |
Industries with the highest published employment and wages for Welding, Soldering, and Brazing Machine Setters, Operators, and Tenders are provided. For a list of all industries with employment in Welding, Soldering, and Brazing Machine Setters, Operators, and Tenders, see the Create Customized Tables function.
Industries with the highest levels of employment in Welding, Soldering, and Brazing Machine Setters, Operators, and Tenders:
| Industry | Employment (1) | Percent of industry employment | Hourly mean wage | Annual mean wage (2) |
|---|---|---|---|---|
| Motor Vehicle Parts Manufacturing | 4,220 | 0.78 | $ 18.19 | $ 37,840 |
| Machinery Manufacturing (3331, 3332, 3334, and 3339 only) | 4,200 | 0.60 | $ 21.07 | $ 43,830 |
| Fabricated Metal Product Manufacturing (3323 and 3324 only) | 3,390 | 0.73 | $ 20.53 | $ 42,690 |
| Fabricated Metal Product Manufacturing (3321, 3322, 3325, 3326, and 3329 only) | 2,650 | 0.59 | $ 19.79 | $ 41,150 |
| Motor Vehicle Manufacturing | 2,330 | 0.95 | $ 26.44 | $ 54,990 |
Industries with the highest concentration of employment in Welding, Soldering, and Brazing Machine Setters, Operators, and Tenders:
| Industry | Employment (1) | Percent of industry employment | Hourly mean wage | Annual mean wage (2) |
|---|---|---|---|---|
| Railroad Rolling Stock Manufacturing | 200 | 1.00 | $ 21.93 | $ 45,610 |
| Motor Vehicle Manufacturing | 2,330 | 0.95 | $ 26.44 | $ 54,990 |
| Motor Vehicle Parts Manufacturing | 4,220 | 0.78 | $ 18.19 | $ 37,840 |
| Fabricated Metal Product Manufacturing (3323 and 3324 only) | 3,390 | 0.73 | $ 20.53 | $ 42,690 |
| Household Appliance Manufacturing | 420 | 0.65 | $ 16.98 | $ 35,320 |
Top paying industries for Welding, Soldering, and Brazing Machine Setters, Operators, and Tenders:
| Industry | Employment (1) | Percent of industry employment | Hourly mean wage | Annual mean wage (2) |
|---|---|---|---|---|
| Ship and Boat Building | 60 | 0.04 | $ 30.34 | $ 63,110 |
| Local Government, excluding schools and hospitals (OEWS Designation) | 30 | (7) | $ 26.47 | $ 55,050 |
| Motor Vehicle Manufacturing | 2,330 | 0.95 | $ 26.44 | $ 54,990 |
| Engine, Turbine, and Power Transmission Equipment Manufacturing | (8) | (8) | $ 25.75 | $ 53,550 |
| Aerospace Product and Parts Manufacturing | 330 | 0.07 | $ 25.68 | $ 53,420 |
States and areas with the highest published employment, location quotients, and wages for Welding, Soldering, and Brazing Machine Setters, Operators, and Tenders are provided. For a list of all areas with employment in Welding, Soldering, and Brazing Machine Setters, Operators, and Tenders, see the Create Customized Tables function.
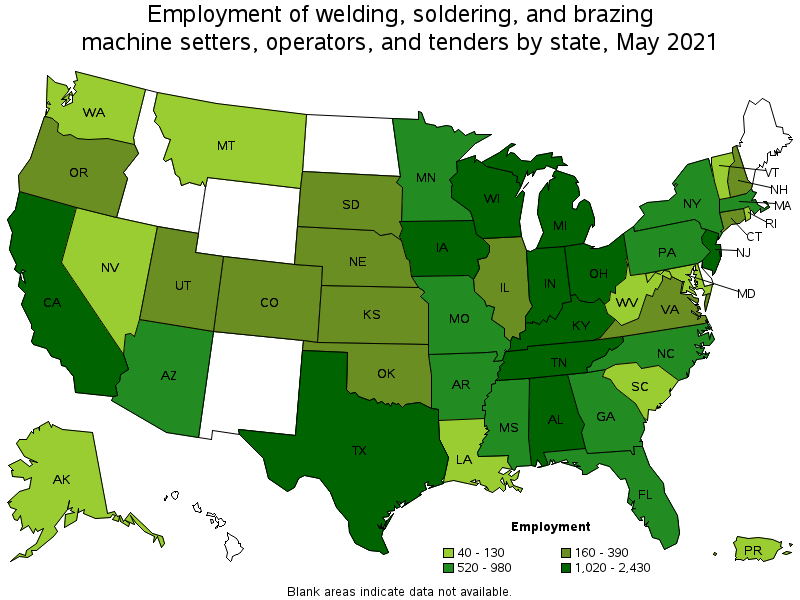
States with the highest employment level in Welding, Soldering, and Brazing Machine Setters, Operators, and Tenders:
| State | Employment (1) | Employment per thousand jobs | Location quotient (9) | Hourly mean wage | Annual mean wage (2) |
|---|---|---|---|---|---|
| Indiana | 2,430 | 0.82 | 3.83 | $ 18.50 | $ 38,480 |
| California | 2,410 | 0.15 | 0.69 | $ 22.70 | $ 47,210 |
| Michigan | 2,260 | 0.56 | 2.62 | $ 19.30 | $ 40,150 |
| Texas | 2,230 | 0.18 | 0.86 | $ 20.84 | $ 43,350 |
| Tennessee | 2,120 | 0.71 | 3.34 | $ 18.83 | $ 39,170 |
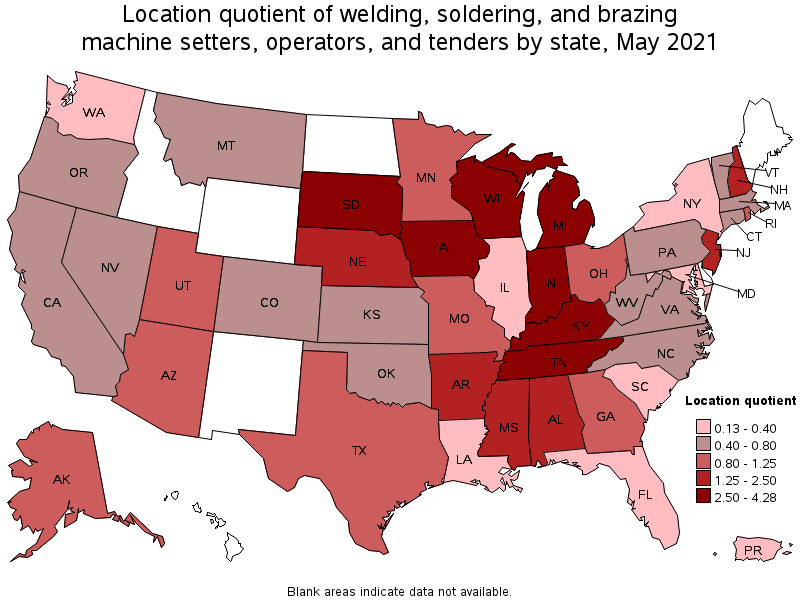
States with the highest concentration of jobs and location quotients in Welding, Soldering, and Brazing Machine Setters, Operators, and Tenders:
| State | Employment (1) | Employment per thousand jobs | Location quotient (9) | Hourly mean wage | Annual mean wage (2) |
|---|---|---|---|---|---|
| Iowa | 1,350 | 0.91 | 4.28 | $ 21.04 | $ 43,770 |
| Kentucky | 1,550 | 0.84 | 3.95 | $ 24.68 | $ 51,330 |
| Indiana | 2,430 | 0.82 | 3.83 | $ 18.50 | $ 38,480 |
| Tennessee | 2,120 | 0.71 | 3.34 | $ 18.83 | $ 39,170 |
| Wisconsin | 1,580 | 0.57 | 2.70 | $ 21.35 | $ 44,400 |
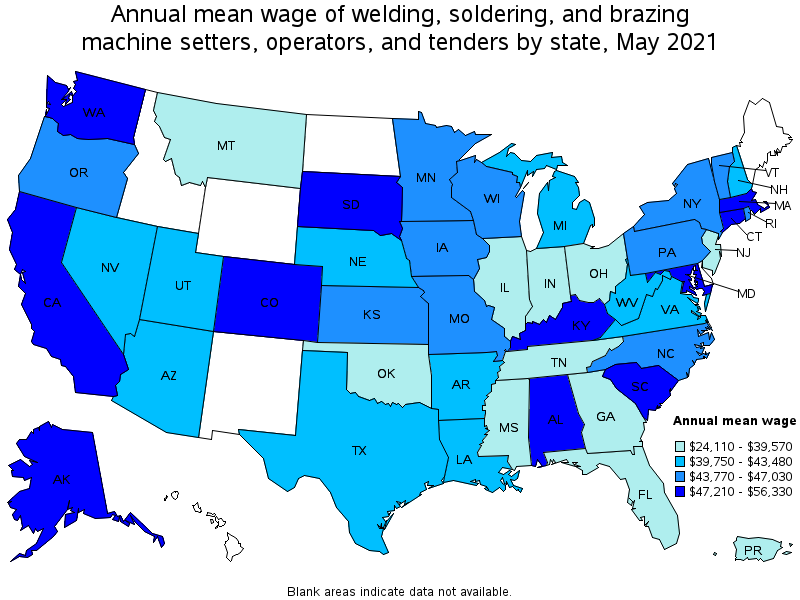
Top paying states for Welding, Soldering, and Brazing Machine Setters, Operators, and Tenders:
| State | Employment (1) | Employment per thousand jobs | Location quotient (9) | Hourly mean wage | Annual mean wage (2) |
|---|---|---|---|---|---|
| Maryland | 120 | 0.05 | 0.23 | $ 27.08 | $ 56,330 |
| Kentucky | 1,550 | 0.84 | 3.95 | $ 24.68 | $ 51,330 |
| Alaska | 60 | 0.22 | 1.01 | $ 24.48 | $ 50,930 |
| Massachusetts | 550 | 0.16 | 0.76 | $ 23.61 | $ 49,100 |
| Alabama | 1,020 | 0.53 | 2.49 | $ 23.60 | $ 49,080 |
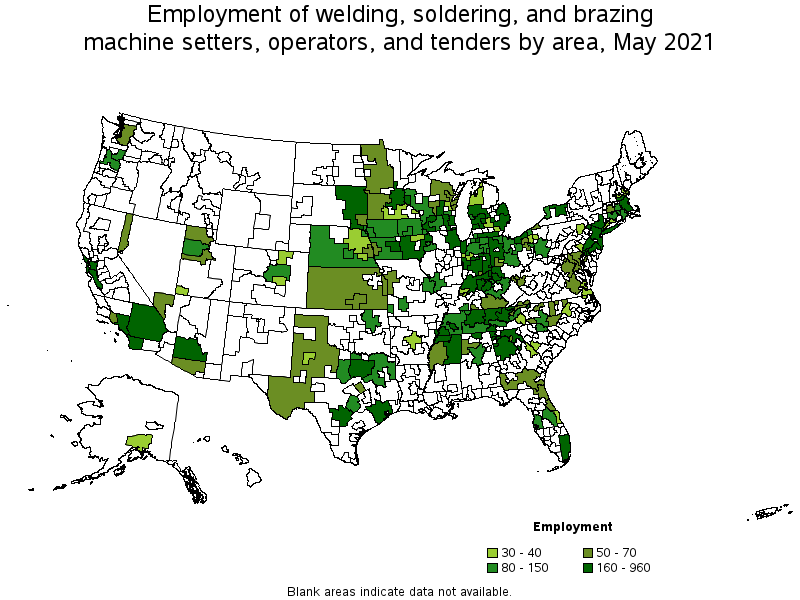
Metropolitan areas with the highest employment level in Welding, Soldering, and Brazing Machine Setters, Operators, and Tenders:
| Metropolitan area | Employment (1) | Employment per thousand jobs | Location quotient (9) | Hourly mean wage | Annual mean wage (2) |
|---|---|---|---|---|---|
| Los Angeles-Long Beach-Anaheim, CA | 960 | 0.17 | 0.78 | $ 20.28 | $ 42,190 |
| Houston-The Woodlands-Sugar Land, TX | 660 | 0.23 | 1.08 | $ 23.34 | $ 48,540 |
| Detroit-Warren-Dearborn, MI | 590 | 0.32 | 1.53 | $ 20.84 | $ 43,350 |
| Phoenix-Mesa-Scottsdale, AZ | 540 | 0.26 | 1.20 | $ 21.07 | $ 43,820 |
| Indianapolis-Carmel-Anderson, IN | 530 | 0.52 | 2.47 | $ 18.45 | $ 38,370 |
| Grand Rapids-Wyoming, MI | 520 | 1.02 | 4.81 | $ 19.55 | $ 40,660 |
| San Antonio-New Braunfels, TX | 510 | 0.51 | 2.41 | $ 18.59 | $ 38,670 |
| New York-Newark-Jersey City, NY-NJ-PA | 500 | 0.06 | 0.27 | $ 23.15 | $ 48,150 |
| Nashville-Davidson--Murfreesboro--Franklin, TN | 500 | 0.51 | 2.39 | $ 20.32 | $ 42,270 |
| Boston-Cambridge-Nashua, MA-NH | 460 | 0.18 | 0.84 | $ 23.03 | $ 47,900 |
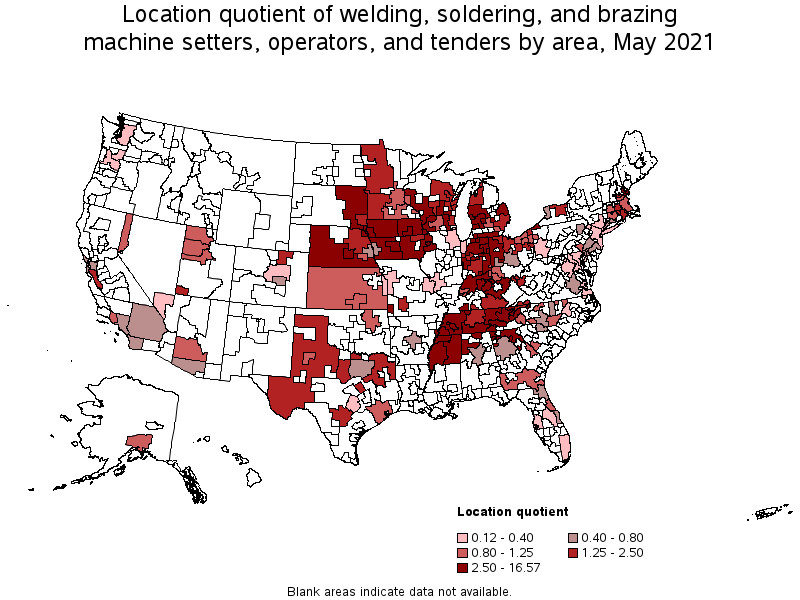
Metropolitan areas with the highest concentration of jobs and location quotients in Welding, Soldering, and Brazing Machine Setters, Operators, and Tenders:
| Metropolitan area | Employment (1) | Employment per thousand jobs | Location quotient (9) | Hourly mean wage | Annual mean wage (2) |
|---|---|---|---|---|---|
| Jackson, TN | 170 | 2.51 | 11.81 | $ 16.30 | $ 33,910 |
| Grand Island, NE | 90 | 2.27 | 10.68 | $ 20.73 | $ 43,120 |
| Fond du Lac, WI | 90 | 2.09 | 9.80 | (8) | (8) |
| Elkhart-Goshen, IN | 250 | 1.91 | 8.95 | $ 20.39 | $ 42,410 |
| Dubuque, IA | 100 | 1.71 | 8.02 | $ 21.38 | $ 44,470 |
| Muskegon, MI | 90 | 1.52 | 7.14 | $ 22.15 | $ 46,080 |
| Clarksville, TN-KY | 130 | 1.47 | 6.90 | $ 16.78 | $ 34,910 |
| Columbus, IN | 70 | 1.45 | 6.82 | $ 19.94 | $ 41,460 |
| Sioux City, IA-NE-SD | 110 | 1.37 | 6.44 | $ 20.68 | $ 43,000 |
| Morristown, TN | 60 | 1.22 | 5.76 | $ 18.12 | $ 37,680 |
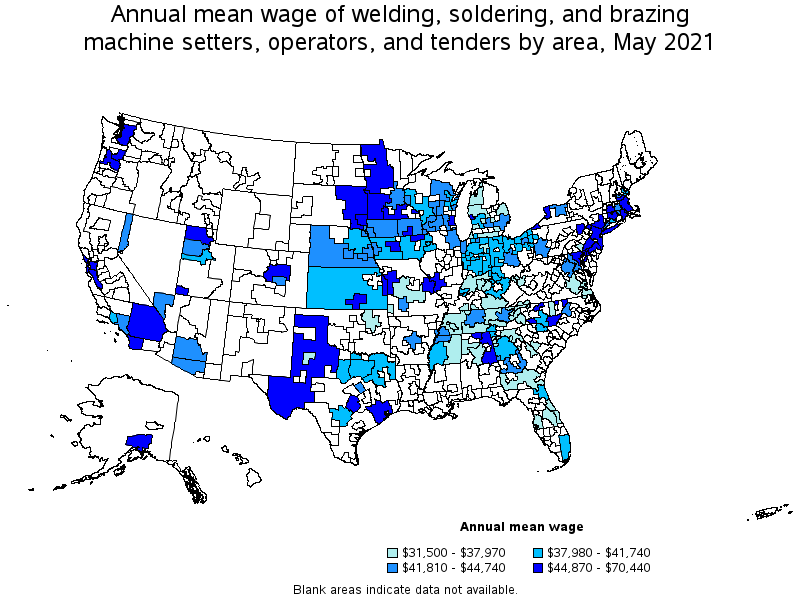
Top paying metropolitan areas for Welding, Soldering, and Brazing Machine Setters, Operators, and Tenders:
| Metropolitan area | Employment (1) | Employment per thousand jobs | Location quotient (9) | Hourly mean wage | Annual mean wage (2) |
|---|---|---|---|---|---|
| Baltimore-Columbia-Towson, MD | 60 | 0.05 | 0.23 | $ 33.87 | $ 70,440 |
| San Jose-Sunnyvale-Santa Clara, CA | 430 | 0.40 | 1.89 | $ 28.19 | $ 58,640 |
| Wichita, KS | 50 | 0.19 | 0.88 | $ 26.93 | $ 56,010 |
| Springfield, MA-CT | 60 | 0.19 | 0.90 | $ 25.91 | $ 53,890 |
| Buffalo-Cheektowaga-Niagara Falls, NY | 80 | 0.16 | 0.74 | $ 25.61 | $ 53,270 |
| St. Louis, MO-IL | 100 | 0.08 | 0.37 | $ 24.38 | $ 50,710 |
| San Francisco-Oakland-Hayward, CA | 350 | 0.16 | 0.73 | $ 24.34 | $ 50,630 |
| Huntsville, AL | 220 | 0.95 | 4.47 | $ 24.23 | $ 50,390 |
| Seattle-Tacoma-Bellevue, WA | 70 | 0.03 | 0.16 | $ 23.82 | $ 49,540 |
| Denver-Aurora-Lakewood, CO | 100 | 0.07 | 0.32 | $ 23.46 | $ 48,800 |
Nonmetropolitan areas with the highest employment in Welding, Soldering, and Brazing Machine Setters, Operators, and Tenders:
| Nonmetropolitan area | Employment (1) | Employment per thousand jobs | Location quotient (9) | Hourly mean wage | Annual mean wage (2) |
|---|---|---|---|---|---|
| Balance of Lower Peninsula of Michigan nonmetropolitan area | 570 | 2.27 | 10.66 | $ 17.68 | $ 36,770 |
| Central Indiana nonmetropolitan area | 530 | 3.53 | 16.57 | $ 18.99 | $ 39,490 |
| Southeast Iowa nonmetropolitan area | 340 | 1.64 | 7.72 | $ 19.38 | $ 40,300 |
| South Central Wisconsin nonmetropolitan area | 290 | 1.46 | 6.84 | $ 20.46 | $ 42,550 |
| Northeast Mississippi nonmetropolitan area | 290 | 1.30 | 6.11 | $ 17.02 | $ 35,410 |
Nonmetropolitan areas with the highest concentration of jobs and location quotients in Welding, Soldering, and Brazing Machine Setters, Operators, and Tenders:
| Nonmetropolitan area | Employment (1) | Employment per thousand jobs | Location quotient (9) | Hourly mean wage | Annual mean wage (2) |
|---|---|---|---|---|---|
| Central Indiana nonmetropolitan area | 530 | 3.53 | 16.57 | $ 18.99 | $ 39,490 |
| Balance of Lower Peninsula of Michigan nonmetropolitan area | 570 | 2.27 | 10.66 | $ 17.68 | $ 36,770 |
| North Central Tennessee nonmetropolitan area | 190 | 1.69 | 7.94 | $ 16.40 | $ 34,110 |
| Southeast Iowa nonmetropolitan area | 340 | 1.64 | 7.72 | $ 19.38 | $ 40,300 |
| Southern Indiana nonmetropolitan area | 270 | 1.46 | 6.87 | $ 15.21 | $ 31,640 |
Top paying nonmetropolitan areas for Welding, Soldering, and Brazing Machine Setters, Operators, and Tenders:
| Nonmetropolitan area | Employment (1) | Employment per thousand jobs | Location quotient (9) | Hourly mean wage | Annual mean wage (2) |
|---|---|---|---|---|---|
| Southwest Minnesota nonmetropolitan area | 60 | 0.49 | 2.30 | $ 25.01 | $ 52,020 |
| Northeast Alabama nonmetropolitan area | (8) | (8) | (8) | $ 24.16 | $ 50,250 |
| West Texas Region of Texas nonmetropolitan area | 60 | 0.35 | 1.65 | $ 23.25 | $ 48,350 |
| East South Dakota nonmetropolitan area | 170 | 1.30 | 6.12 | $ 23.07 | $ 47,980 |
| Northwest Minnesota nonmetropolitan area | 60 | 0.34 | 1.59 | $ 22.46 | $ 46,720 |
These estimates are calculated with data collected from employers in all industry sectors, all metropolitan and nonmetropolitan areas, and all states and the District of Columbia. The top employment and wage figures are provided above. The complete list is available in the downloadable XLS files.
The percentile wage estimate is the value of a wage below which a certain percent of workers fall. The median wage is the 50th percentile wage estimate—50 percent of workers earn less than the median and 50 percent of workers earn more than the median. More about percentile wages.
(1) Estimates for detailed occupations do not sum to the totals because the totals include occupations not shown separately. Estimates do not include self-employed workers.
(2) Annual wages have been calculated by multiplying the hourly mean wage by a "year-round, full-time" hours figure of 2,080 hours; for those occupations where there is not an hourly wage published, the annual wage has been directly calculated from the reported survey data.
(3) The relative standard error (RSE) is a measure of the reliability of a survey statistic. The smaller the relative standard error, the more precise the estimate.
(7) The value is less than .005 percent of industry employment.
(8) Estimate not released.
(9) The location quotient is the ratio of the area concentration of occupational employment to the national average concentration. A location quotient greater than one indicates the occupation has a higher share of employment than average, and a location quotient less than one indicates the occupation is less prevalent in the area than average.
Other OEWS estimates and related information:
May 2021 National Occupational Employment and Wage Estimates
May 2021 State Occupational Employment and Wage Estimates
May 2021 Metropolitan and Nonmetropolitan Area Occupational Employment and Wage Estimates
May 2021 National Industry-Specific Occupational Employment and Wage Estimates
Last Modified Date: March 31, 2022