
An official website of the United States government
An official website of the United States government
The .gov means it's official.
Federal government websites often end in .gov or .mil. Before sharing sensitive information,
make sure you're on a federal government site.
The site is secure.
The
https:// ensures that you are connecting to the official website and that any
information you provide is encrypted and transmitted securely.
Set up, operate, or tend heating equipment, such as heat-treating furnaces, flame-hardening machines, induction machines, soaking pits, or vacuum equipment to temper, harden, anneal, or heat treat metal or plastic objects.
Employment estimate and mean wage estimates for Heat Treating Equipment Setters, Operators, and Tenders, Metal and Plastic:
| Employment (1) | Employment RSE (3) |
Mean hourly wage |
Mean annual wage (2) |
Wage RSE (3) |
|---|---|---|---|---|
| 14,540 | 4.2 % | $ 19.98 | $ 41,560 | 1.1 % |
Percentile wage estimates for Heat Treating Equipment Setters, Operators, and Tenders, Metal and Plastic:
| Percentile | 10% | 25% | 50% (Median) |
75% | 90% |
|---|---|---|---|---|---|
| Hourly Wage | $ 13.99 | $ 15.33 | $ 18.49 | $ 23.05 | $ 27.97 |
| Annual Wage (2) | $ 29,110 | $ 31,890 | $ 38,450 | $ 47,940 | $ 58,180 |
Industries with the highest published employment and wages for Heat Treating Equipment Setters, Operators, and Tenders, Metal and Plastic are provided. For a list of all industries with employment in Heat Treating Equipment Setters, Operators, and Tenders, Metal and Plastic, see the Create Customized Tables function.
Industries with the highest levels of employment in Heat Treating Equipment Setters, Operators, and Tenders, Metal and Plastic:
| Industry | Employment (1) | Percent of industry employment | Hourly mean wage | Annual mean wage (2) |
|---|---|---|---|---|
| Coating, Engraving, Heat Treating, and Allied Activities | 3,690 | 2.98 | $ 19.56 | $ 40,680 |
| Fabricated Metal Product Manufacturing (3321, 3322, 3325, 3326, and 3329 only) | 1,590 | 0.36 | $ 19.46 | $ 40,470 |
| Motor Vehicle Parts Manufacturing | 920 | 0.17 | $ 18.95 | $ 39,410 |
| Employment Services | 780 | 0.02 | $ 14.91 | $ 31,010 |
| Iron and Steel Mills and Ferroalloy Manufacturing | 700 | 0.89 | $ 25.02 | $ 52,050 |
Industries with the highest concentration of employment in Heat Treating Equipment Setters, Operators, and Tenders, Metal and Plastic:
| Industry | Employment (1) | Percent of industry employment | Hourly mean wage | Annual mean wage (2) |
|---|---|---|---|---|
| Coating, Engraving, Heat Treating, and Allied Activities | 3,690 | 2.98 | $ 19.56 | $ 40,680 |
| Iron and Steel Mills and Ferroalloy Manufacturing | 700 | 0.89 | $ 25.02 | $ 52,050 |
| Nonferrous Metal (except Aluminum) Production and Processing | 270 | 0.48 | $ 22.13 | $ 46,030 |
| Steel Product Manufacturing from Purchased Steel | 220 | 0.41 | $ 21.66 | $ 45,050 |
| Foundries | 420 | 0.41 | $ 21.16 | $ 44,010 |
Top paying industries for Heat Treating Equipment Setters, Operators, and Tenders, Metal and Plastic:
| Industry | Employment (1) | Percent of industry employment | Hourly mean wage | Annual mean wage (2) |
|---|---|---|---|---|
| Management of Companies and Enterprises | (8) | (8) | $ 30.67 | $ 63,790 |
| Federal Executive Branch (OEWS Designation) | 60 | (7) | $ 29.24 | $ 60,820 |
| Iron and Steel Mills and Ferroalloy Manufacturing | 700 | 0.89 | $ 25.02 | $ 52,050 |
| Aerospace Product and Parts Manufacturing | 640 | 0.14 | $ 24.65 | $ 51,260 |
| Electrical Equipment Manufacturing | 50 | 0.04 | $ 23.76 | $ 49,410 |
States and areas with the highest published employment, location quotients, and wages for Heat Treating Equipment Setters, Operators, and Tenders, Metal and Plastic are provided. For a list of all areas with employment in Heat Treating Equipment Setters, Operators, and Tenders, Metal and Plastic, see the Create Customized Tables function.
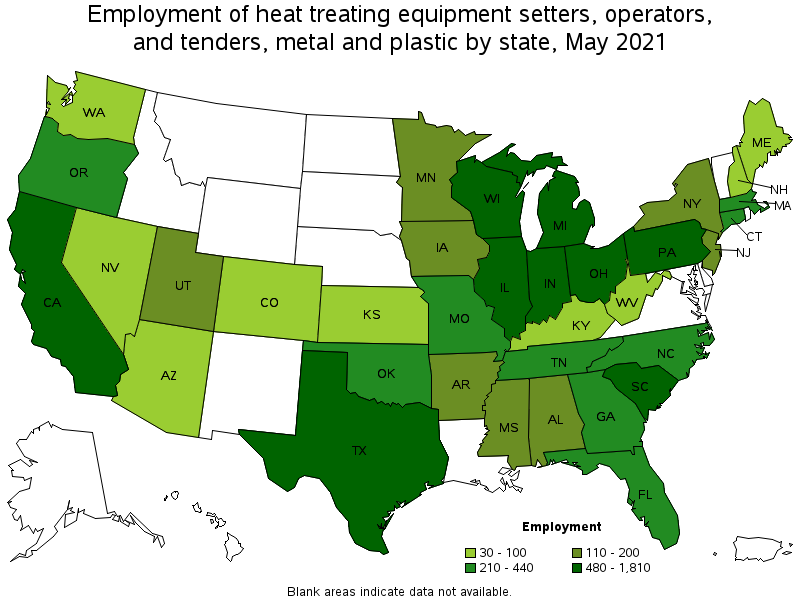
States with the highest employment level in Heat Treating Equipment Setters, Operators, and Tenders, Metal and Plastic:
| State | Employment (1) | Employment per thousand jobs | Location quotient (9) | Hourly mean wage | Annual mean wage (2) |
|---|---|---|---|---|---|
| Texas | 1,810 | 0.15 | 1.43 | $ 19.51 | $ 40,580 |
| Ohio | 1,600 | 0.31 | 2.98 | $ 19.72 | $ 41,020 |
| Pennsylvania | 1,470 | 0.26 | 2.54 | $ 18.45 | $ 38,370 |
| California | 1,190 | 0.07 | 0.69 | $ 21.85 | $ 45,450 |
| Michigan | 1,110 | 0.27 | 2.65 | $ 19.98 | $ 41,560 |
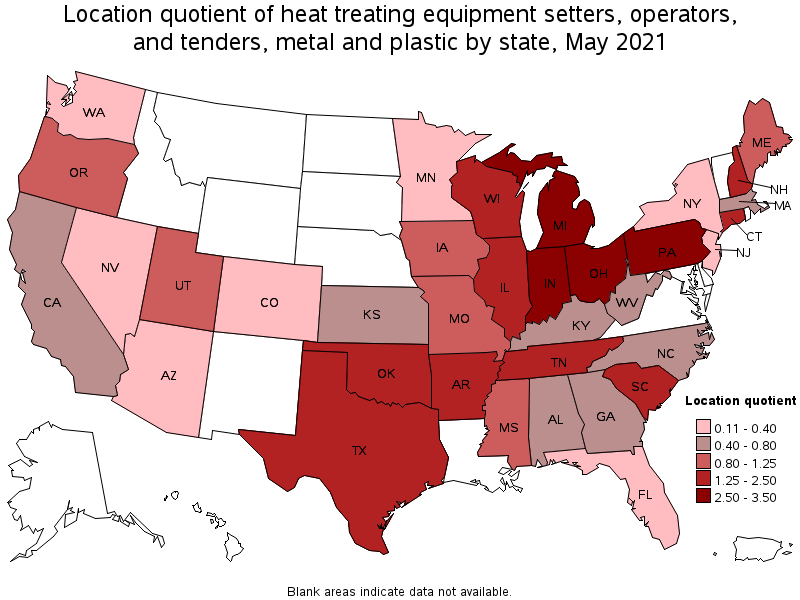
States with the highest concentration of jobs and location quotients in Heat Treating Equipment Setters, Operators, and Tenders, Metal and Plastic:
| State | Employment (1) | Employment per thousand jobs | Location quotient (9) | Hourly mean wage | Annual mean wage (2) |
|---|---|---|---|---|---|
| Indiana | 960 | 0.32 | 3.11 | $ 19.08 | $ 39,690 |
| Ohio | 1,600 | 0.31 | 2.98 | $ 19.72 | $ 41,020 |
| Michigan | 1,110 | 0.27 | 2.65 | $ 19.98 | $ 41,560 |
| Pennsylvania | 1,470 | 0.26 | 2.54 | $ 18.45 | $ 38,370 |
| South Carolina | 480 | 0.23 | 2.26 | $ 23.15 | $ 48,150 |
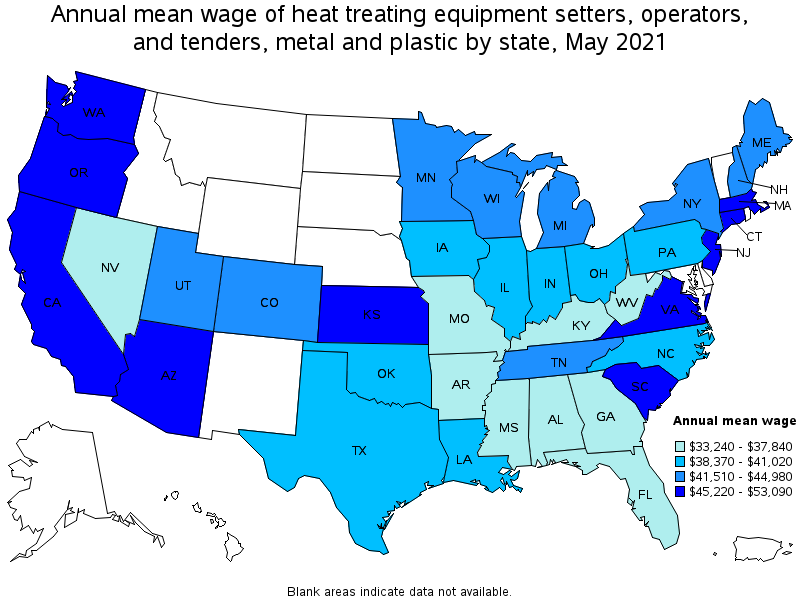
Top paying states for Heat Treating Equipment Setters, Operators, and Tenders, Metal and Plastic:
| State | Employment (1) | Employment per thousand jobs | Location quotient (9) | Hourly mean wage | Annual mean wage (2) |
|---|---|---|---|---|---|
| Virginia | (8) | (8) | (8) | $ 25.52 | $ 53,090 |
| Oregon | 210 | 0.12 | 1.12 | $ 24.99 | $ 51,980 |
| Washington | 100 | 0.03 | 0.31 | $ 24.72 | $ 51,420 |
| Kansas | 80 | 0.06 | 0.59 | $ 23.62 | $ 49,140 |
| New Jersey | 120 | 0.03 | 0.30 | $ 23.32 | $ 48,510 |
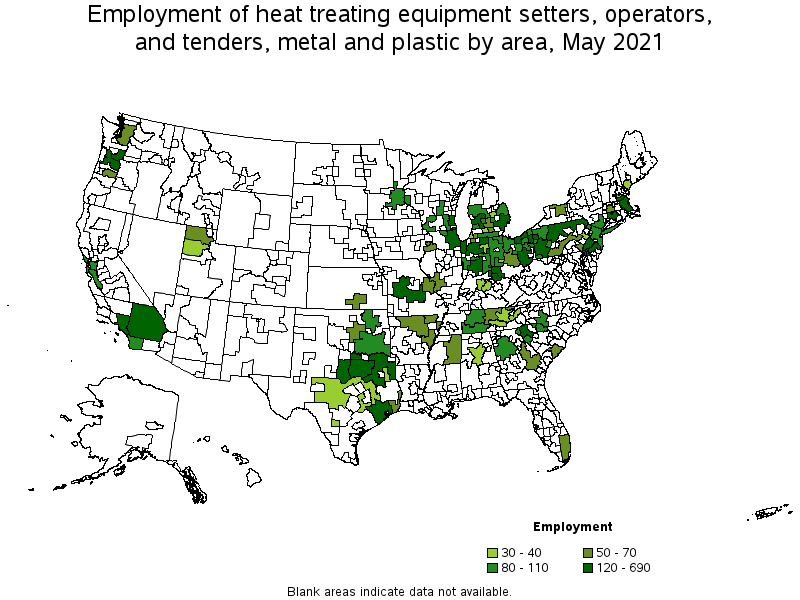
Metropolitan areas with the highest employment level in Heat Treating Equipment Setters, Operators, and Tenders, Metal and Plastic:
| Metropolitan area | Employment (1) | Employment per thousand jobs | Location quotient (9) | Hourly mean wage | Annual mean wage (2) |
|---|---|---|---|---|---|
| Chicago-Naperville-Elgin, IL-IN-WI | 690 | 0.16 | 1.59 | $ 20.06 | $ 41,710 |
| Houston-The Woodlands-Sugar Land, TX | 650 | 0.22 | 2.18 | $ 21.82 | $ 45,380 |
| Dallas-Fort Worth-Arlington, TX | 610 | 0.17 | 1.65 | $ 17.56 | $ 36,520 |
| Los Angeles-Long Beach-Anaheim, CA | 540 | 0.09 | 0.92 | $ 21.73 | $ 45,190 |
| Detroit-Warren-Dearborn, MI | 450 | 0.25 | 2.43 | $ 20.17 | $ 41,950 |
| Cleveland-Elyria, OH | 340 | 0.35 | 3.39 | $ 19.45 | $ 40,460 |
| Milwaukee-Waukesha-West Allis, WI | 260 | 0.33 | 3.22 | $ 21.01 | $ 43,700 |
| Indianapolis-Carmel-Anderson, IN | 240 | 0.24 | 2.32 | $ 18.97 | $ 39,460 |
| Youngstown-Warren-Boardman, OH-PA | 200 | 1.05 | 10.15 | $ 16.28 | $ 33,860 |
| Pittsburgh, PA | 190 | 0.18 | 1.76 | $ 22.25 | $ 46,280 |
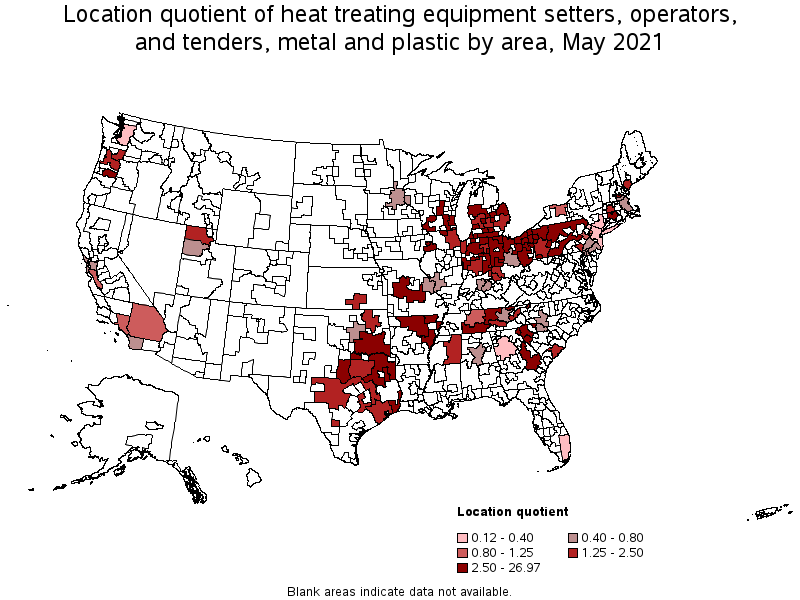
Metropolitan areas with the highest concentration of jobs and location quotients in Heat Treating Equipment Setters, Operators, and Tenders, Metal and Plastic:
| Metropolitan area | Employment (1) | Employment per thousand jobs | Location quotient (9) | Hourly mean wage | Annual mean wage (2) |
|---|---|---|---|---|---|
| Albany, OR | 50 | 1.18 | 11.39 | $ 28.19 | $ 58,640 |
| Youngstown-Warren-Boardman, OH-PA | 200 | 1.05 | 10.15 | $ 16.28 | $ 33,860 |
| Springfield, OH | 40 | 0.97 | 9.42 | $ 17.39 | $ 36,170 |
| Jackson, MI | 50 | 0.92 | 8.87 | $ 21.21 | $ 44,110 |
| Rockford, IL | 100 | 0.73 | 7.06 | $ 17.51 | $ 36,420 |
| Canton-Massillon, OH | 110 | 0.73 | 7.05 | $ 20.81 | $ 43,280 |
| Niles-Benton Harbor, MI | 40 | 0.68 | 6.57 | $ 15.99 | $ 33,250 |
| Battle Creek, MI | 30 | 0.60 | 5.83 | $ 16.89 | $ 35,140 |
| Saginaw, MI | 30 | 0.40 | 3.92 | $ 18.77 | $ 39,040 |
| Toledo, OH | 110 | 0.38 | 3.68 | $ 19.28 | $ 40,110 |
Top paying metropolitan areas for Heat Treating Equipment Setters, Operators, and Tenders, Metal and Plastic:
| Metropolitan area | Employment (1) | Employment per thousand jobs | Location quotient (9) | Hourly mean wage | Annual mean wage (2) |
|---|---|---|---|---|---|
| Albany, OR | 50 | 1.18 | 11.39 | $ 28.19 | $ 58,640 |
| Seattle-Tacoma-Bellevue, WA | 60 | 0.03 | 0.31 | $ 27.32 | $ 56,830 |
| Wichita, KS | 70 | 0.24 | 2.33 | $ 24.63 | $ 51,240 |
| San Francisco-Oakland-Hayward, CA | 90 | 0.04 | 0.41 | $ 24.55 | $ 51,070 |
| Portland-Vancouver-Hillsboro, OR-WA | 160 | 0.14 | 1.35 | $ 24.09 | $ 50,110 |
| San Diego-Carlsbad, CA | 90 | 0.07 | 0.63 | $ 24.09 | $ 50,110 |
| New York-Newark-Jersey City, NY-NJ-PA | 110 | 0.01 | 0.12 | $ 23.56 | $ 48,990 |
| Beaumont-Port Arthur, TX | 50 | 0.33 | 3.19 | $ 23.51 | $ 48,900 |
| Springfield, MA-CT | 60 | 0.19 | 1.87 | $ 23.36 | $ 48,580 |
| Boston-Cambridge-Nashua, MA-NH | 120 | 0.05 | 0.46 | $ 23.14 | $ 48,140 |
Nonmetropolitan areas with the highest employment in Heat Treating Equipment Setters, Operators, and Tenders, Metal and Plastic:
| Nonmetropolitan area | Employment (1) | Employment per thousand jobs | Location quotient (9) | Hourly mean wage | Annual mean wage (2) |
|---|---|---|---|---|---|
| Northern Pennsylvania nonmetropolitan area | 410 | 2.78 | 26.97 | $ 15.60 | $ 32,440 |
| Northern Indiana nonmetropolitan area | 170 | 0.85 | 8.23 | $ 18.54 | $ 38,570 |
| Eastern Ohio nonmetropolitan area | 130 | 0.99 | 9.58 | $ 22.12 | $ 46,010 |
| Central Missouri nonmetropolitan area | 120 | 0.79 | 7.69 | $ 17.36 | $ 36,110 |
| North Texas Region of Texas nonmetropolitan area | 120 | 0.43 | 4.21 | $ 16.84 | $ 35,030 |
Nonmetropolitan areas with the highest concentration of jobs and location quotients in Heat Treating Equipment Setters, Operators, and Tenders, Metal and Plastic:
| Nonmetropolitan area | Employment (1) | Employment per thousand jobs | Location quotient (9) | Hourly mean wage | Annual mean wage (2) |
|---|---|---|---|---|---|
| Northern Pennsylvania nonmetropolitan area | 410 | 2.78 | 26.97 | $ 15.60 | $ 32,440 |
| Upper Savannah South Carolina nonmetropolitan area | 80 | 1.00 | 9.67 | (8) | (8) |
| Eastern Ohio nonmetropolitan area | 130 | 0.99 | 9.58 | $ 22.12 | $ 46,010 |
| East Arkansas nonmetropolitan area | 60 | 0.98 | 9.49 | $ 18.76 | $ 39,020 |
| South Central Tennessee nonmetropolitan area | 90 | 0.85 | 8.27 | $ 21.95 | $ 45,660 |
Top paying nonmetropolitan areas for Heat Treating Equipment Setters, Operators, and Tenders, Metal and Plastic:
| Nonmetropolitan area | Employment (1) | Employment per thousand jobs | Location quotient (9) | Hourly mean wage | Annual mean wage (2) |
|---|---|---|---|---|---|
| Eastern Ohio nonmetropolitan area | 130 | 0.99 | 9.58 | $ 22.12 | $ 46,010 |
| South Central Tennessee nonmetropolitan area | 90 | 0.85 | 8.27 | $ 21.95 | $ 45,660 |
| East Tennessee nonmetropolitan area | 30 | 0.25 | 2.40 | $ 20.03 | $ 41,670 |
| Northwest Lower Peninsula of Michigan nonmetropolitan area | (8) | (8) | (8) | $ 19.88 | $ 41,340 |
| North Northeastern Ohio nonmetropolitan area (noncontiguous) | 110 | 0.36 | 3.47 | $ 19.77 | $ 41,120 |
These estimates are calculated with data collected from employers in all industry sectors, all metropolitan and nonmetropolitan areas, and all states and the District of Columbia. The top employment and wage figures are provided above. The complete list is available in the downloadable XLS files.
The percentile wage estimate is the value of a wage below which a certain percent of workers fall. The median wage is the 50th percentile wage estimate—50 percent of workers earn less than the median and 50 percent of workers earn more than the median. More about percentile wages.
(1) Estimates for detailed occupations do not sum to the totals because the totals include occupations not shown separately. Estimates do not include self-employed workers.
(2) Annual wages have been calculated by multiplying the hourly mean wage by a "year-round, full-time" hours figure of 2,080 hours; for those occupations where there is not an hourly wage published, the annual wage has been directly calculated from the reported survey data.
(3) The relative standard error (RSE) is a measure of the reliability of a survey statistic. The smaller the relative standard error, the more precise the estimate.
(7) The value is less than .005 percent of industry employment.
(8) Estimate not released.
(9) The location quotient is the ratio of the area concentration of occupational employment to the national average concentration. A location quotient greater than one indicates the occupation has a higher share of employment than average, and a location quotient less than one indicates the occupation is less prevalent in the area than average.
Other OEWS estimates and related information:
May 2021 National Occupational Employment and Wage Estimates
May 2021 State Occupational Employment and Wage Estimates
May 2021 Metropolitan and Nonmetropolitan Area Occupational Employment and Wage Estimates
May 2021 National Industry-Specific Occupational Employment and Wage Estimates
Last Modified Date: March 31, 2022