
An official website of the United States government
An official website of the United States government
The .gov means it's official.
Federal government websites often end in .gov or .mil. Before sharing sensitive information,
make sure you're on a federal government site.
The site is secure.
The
https:// ensures that you are connecting to the official website and that any
information you provide is encrypted and transmitted securely.
Format and proof text and images submitted by designers and clients into finished pages that can be printed. Includes digital and photo typesetting. May produce printing plates.
Employment estimate and mean wage estimates for Prepress Technicians and Workers:
| Employment (1) | Employment RSE (3) |
Mean hourly wage |
Mean annual wage (2) |
Wage RSE (3) |
|---|---|---|---|---|
| 25,840 | 2.5 % | $ 21.06 | $ 43,800 | 0.8 % |
Percentile wage estimates for Prepress Technicians and Workers:
| Percentile | 10% | 25% | 50% (Median) |
75% | 90% |
|---|---|---|---|---|---|
| Hourly Wage | $ 14.00 | $ 16.43 | $ 20.49 | $ 23.54 | $ 29.31 |
| Annual Wage (2) | $ 29,110 | $ 34,180 | $ 42,610 | $ 48,960 | $ 60,960 |
Industries with the highest published employment and wages for Prepress Technicians and Workers are provided. For a list of all industries with employment in Prepress Technicians and Workers, see the Create Customized Tables function.
Industries with the highest levels of employment in Prepress Technicians and Workers:
| Industry | Employment (1) | Percent of industry employment | Hourly mean wage | Annual mean wage (2) |
|---|---|---|---|---|
| Printing and Related Support Activities | 16,120 | 4.38 | $ 20.86 | $ 43,390 |
| Converted Paper Product Manufacturing | 1,870 | 0.72 | $ 21.30 | $ 44,300 |
| Advertising, Public Relations, and Related Services | 960 | 0.22 | $ 20.00 | $ 41,590 |
| Plastics Product Manufacturing | 650 | 0.11 | $ 20.26 | $ 42,140 |
| Employment Services | 370 | 0.01 | $ 15.03 | $ 31,260 |
Industries with the highest concentration of employment in Prepress Technicians and Workers:
| Industry | Employment (1) | Percent of industry employment | Hourly mean wage | Annual mean wage (2) |
|---|---|---|---|---|
| Printing and Related Support Activities | 16,120 | 4.38 | $ 20.86 | $ 43,390 |
| Converted Paper Product Manufacturing | 1,870 | 0.72 | $ 21.30 | $ 44,300 |
| Manufacturing and Reproducing Magnetic and Optical Media | 30 | 0.31 | $ 22.28 | $ 46,340 |
| Sound Recording Industries | 50 | 0.28 | $ 23.71 | $ 49,320 |
| Specialized Design Services | 350 | 0.26 | $ 26.68 | $ 55,480 |
Top paying industries for Prepress Technicians and Workers:
| Industry | Employment (1) | Percent of industry employment | Hourly mean wage | Annual mean wage (2) |
|---|---|---|---|---|
| Federal Executive Branch (OEWS Designation) | 200 | 0.01 | $ 43.92 | $ 91,340 |
| Scientific Research and Development Services | 30 | (7) | $ 31.40 | $ 65,300 |
| Elementary and Secondary Schools | 40 | (7) | $ 30.45 | $ 63,340 |
| Management, Scientific, and Technical Consulting Services | (8) | (8) | $ 29.10 | $ 60,540 |
| Other Personal Services | 50 | 0.02 | $ 27.93 | $ 58,090 |
States and areas with the highest published employment, location quotients, and wages for Prepress Technicians and Workers are provided. For a list of all areas with employment in Prepress Technicians and Workers, see the Create Customized Tables function.
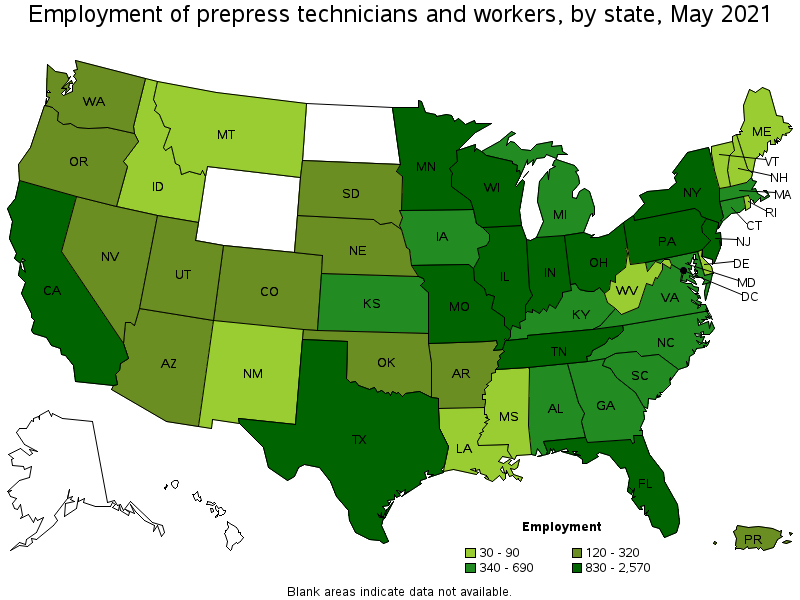
States with the highest employment level in Prepress Technicians and Workers:
| State | Employment (1) | Employment per thousand jobs | Location quotient (9) | Hourly mean wage | Annual mean wage (2) |
|---|---|---|---|---|---|
| California | 2,570 | 0.16 | 0.85 | $ 22.79 | $ 47,390 |
| Wisconsin | 1,690 | 0.61 | 3.34 | $ 20.92 | $ 43,520 |
| Ohio | 1,440 | 0.28 | 1.51 | $ 20.09 | $ 41,800 |
| Illinois | 1,270 | 0.23 | 1.23 | $ 21.91 | $ 45,560 |
| New Jersey | 1,250 | 0.32 | 1.77 | $ 26.23 | $ 54,550 |
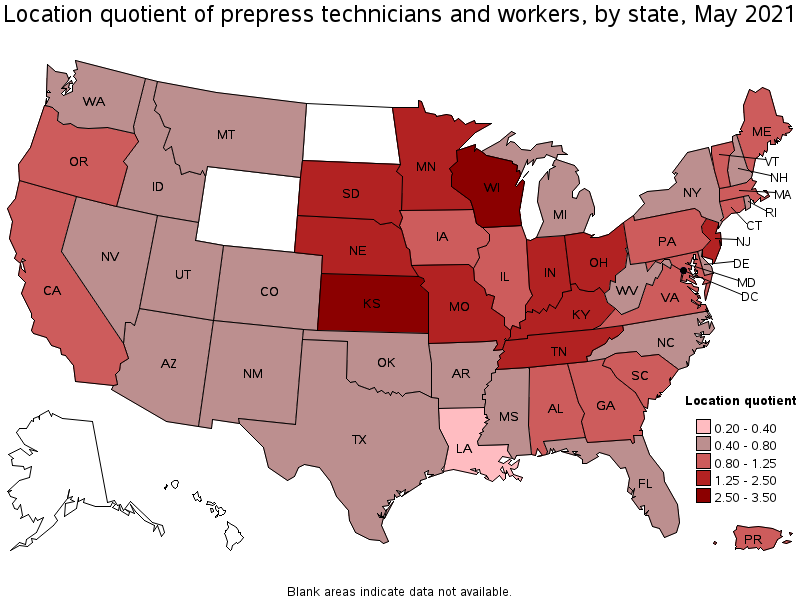
States with the highest concentration of jobs and location quotients in Prepress Technicians and Workers:
| State | Employment (1) | Employment per thousand jobs | Location quotient (9) | Hourly mean wage | Annual mean wage (2) |
|---|---|---|---|---|---|
| Wisconsin | 1,690 | 0.61 | 3.34 | $ 20.92 | $ 43,520 |
| Kansas | 660 | 0.50 | 2.70 | $ 16.84 | $ 35,030 |
| Tennessee | 1,180 | 0.40 | 2.16 | $ 17.23 | $ 35,830 |
| Minnesota | 1,020 | 0.37 | 2.03 | $ 22.89 | $ 47,600 |
| New Jersey | 1,250 | 0.32 | 1.77 | $ 26.23 | $ 54,550 |
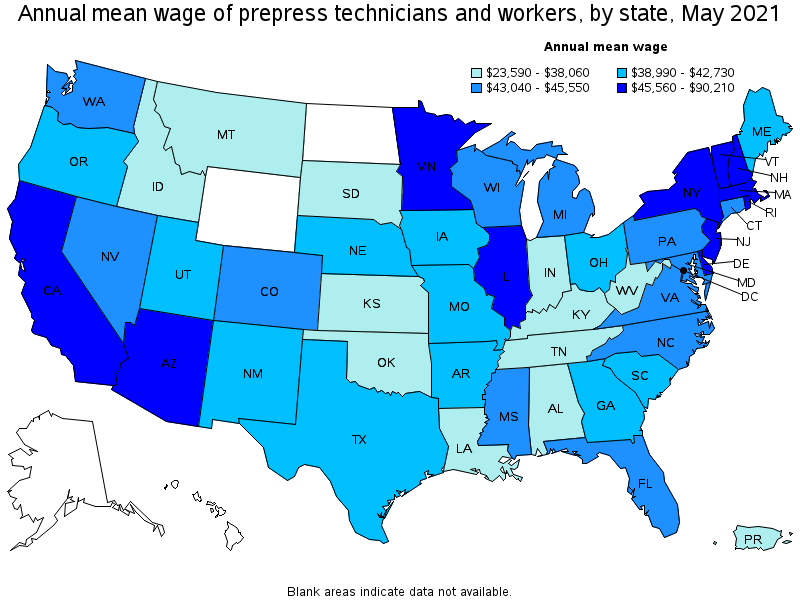
Top paying states for Prepress Technicians and Workers:
| State | Employment (1) | Employment per thousand jobs | Location quotient (9) | Hourly mean wage | Annual mean wage (2) |
|---|---|---|---|---|---|
| District of Columbia | 190 | 0.29 | 1.59 | $ 43.37 | $ 90,210 |
| Delaware | 30 | 0.08 | 0.43 | $ 26.72 | $ 55,580 |
| New Jersey | 1,250 | 0.32 | 1.77 | $ 26.23 | $ 54,550 |
| New York | 1,220 | 0.14 | 0.77 | $ 24.69 | $ 51,360 |
| Massachusetts | 570 | 0.17 | 0.92 | $ 23.98 | $ 49,880 |
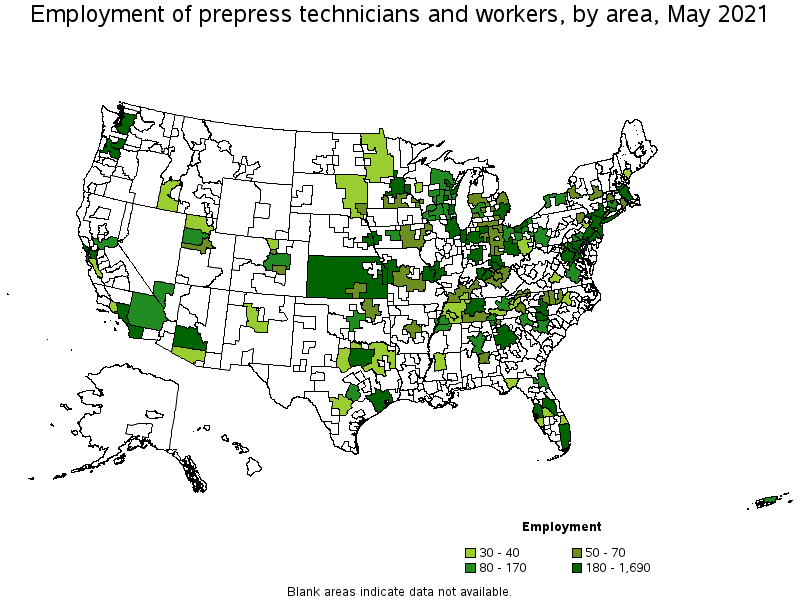
Metropolitan areas with the highest employment level in Prepress Technicians and Workers:
| Metropolitan area | Employment (1) | Employment per thousand jobs | Location quotient (9) | Hourly mean wage | Annual mean wage (2) |
|---|---|---|---|---|---|
| New York-Newark-Jersey City, NY-NJ-PA | 1,690 | 0.19 | 1.06 | $ 27.05 | $ 56,260 |
| Los Angeles-Long Beach-Anaheim, CA | 1,510 | 0.26 | 1.44 | $ 22.54 | $ 46,890 |
| Chicago-Naperville-Elgin, IL-IN-WI | 1,090 | 0.26 | 1.41 | $ 21.83 | $ 45,410 |
| Minneapolis-St. Paul-Bloomington, MN-WI | 770 | 0.42 | 2.30 | $ 23.80 | $ 49,500 |
| Washington-Arlington-Alexandria, DC-VA-MD-WV | 740 | 0.25 | 1.38 | $ 27.40 | $ 56,990 |
| Dallas-Fort Worth-Arlington, TX | 510 | 0.14 | 0.77 | $ 20.50 | $ 42,640 |
| Philadelphia-Camden-Wilmington, PA-NJ-DE-MD | 470 | 0.18 | 0.96 | $ 24.10 | $ 50,120 |
| Milwaukee-Waukesha-West Allis, WI | 470 | 0.59 | 3.23 | $ 22.15 | $ 46,070 |
| Atlanta-Sandy Springs-Roswell, GA | 450 | 0.18 | 0.96 | $ 20.19 | $ 41,990 |
| St. Louis, MO-IL | 440 | 0.34 | 1.87 | $ 20.11 | $ 41,820 |
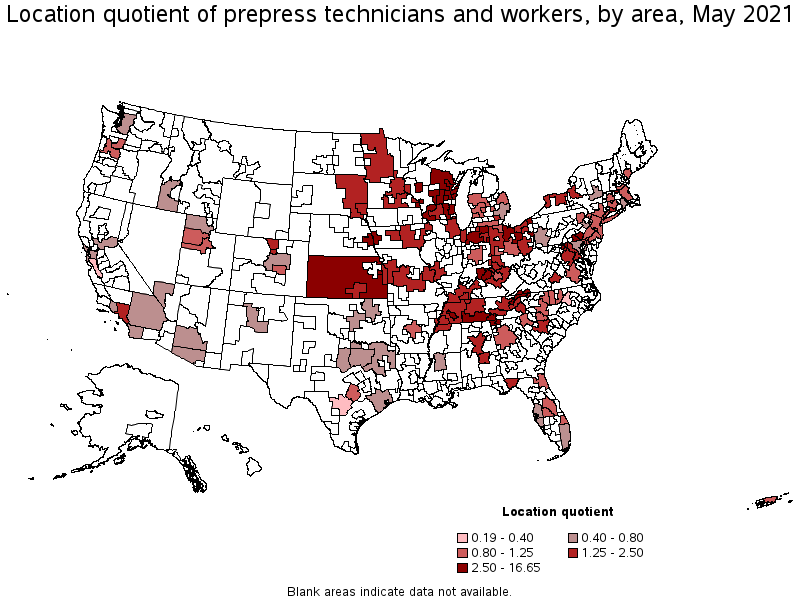
Metropolitan areas with the highest concentration of jobs and location quotients in Prepress Technicians and Workers:
| Metropolitan area | Employment (1) | Employment per thousand jobs | Location quotient (9) | Hourly mean wage | Annual mean wage (2) |
|---|---|---|---|---|---|
| Oshkosh-Neenah, WI | 270 | 3.05 | 16.65 | $ 20.82 | $ 43,310 |
| Lawrence, KS | 100 | 2.22 | 12.13 | $ 16.88 | $ 35,110 |
| Green Bay, WI | 190 | 1.17 | 6.40 | $ 21.30 | $ 44,300 |
| Appleton, WI | 120 | 1.03 | 5.63 | $ 20.15 | $ 41,920 |
| Dalton, GA | 60 | 0.97 | 5.30 | $ 15.75 | $ 32,770 |
| Leominster-Gardner, MA | 40 | 0.89 | 4.83 | $ 21.41 | $ 44,540 |
| Morristown, TN | 40 | 0.86 | 4.67 | $ 17.44 | $ 36,260 |
| La Crosse-Onalaska, WI-MN | 50 | 0.68 | 3.73 | $ 17.16 | $ 35,690 |
| Jackson, TN | 40 | 0.61 | 3.30 | $ 17.00 | $ 35,370 |
| Milwaukee-Waukesha-West Allis, WI | 470 | 0.59 | 3.23 | $ 22.15 | $ 46,070 |
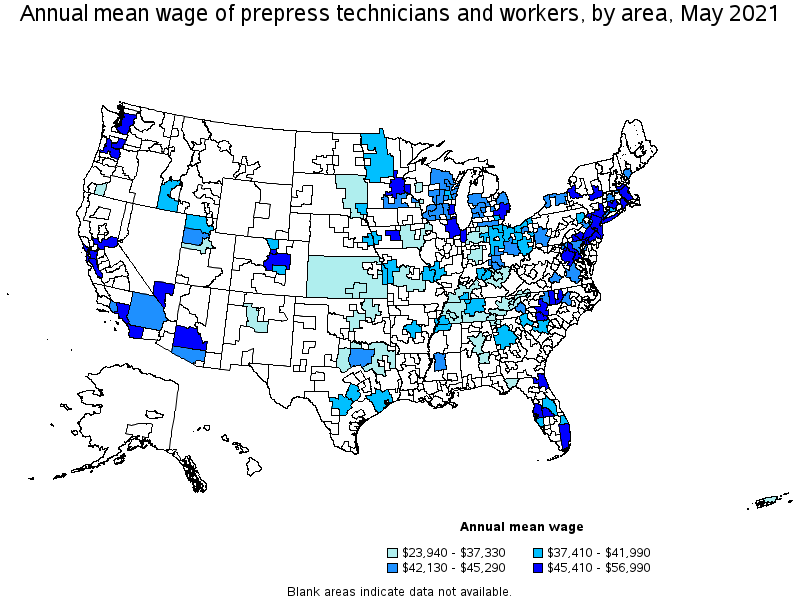
Top paying metropolitan areas for Prepress Technicians and Workers:
| Metropolitan area | Employment (1) | Employment per thousand jobs | Location quotient (9) | Hourly mean wage | Annual mean wage (2) |
|---|---|---|---|---|---|
| Washington-Arlington-Alexandria, DC-VA-MD-WV | 740 | 0.25 | 1.38 | $ 27.40 | $ 56,990 |
| New York-Newark-Jersey City, NY-NJ-PA | 1,690 | 0.19 | 1.06 | $ 27.05 | $ 56,260 |
| San Francisco-Oakland-Hayward, CA | 220 | 0.10 | 0.52 | $ 26.64 | $ 55,420 |
| Des Moines-West Des Moines, IA | 90 | 0.26 | 1.42 | $ 26.43 | $ 54,980 |
| San Jose-Sunnyvale-Santa Clara, CA | 40 | 0.04 | 0.22 | $ 25.93 | $ 53,930 |
| Durham-Chapel Hill, NC | 60 | 0.18 | 0.99 | $ 25.91 | $ 53,900 |
| Trenton, NJ | 40 | 0.17 | 0.94 | $ 25.87 | $ 53,810 |
| Boston-Cambridge-Nashua, MA-NH | 420 | 0.16 | 0.89 | $ 24.76 | $ 51,500 |
| Philadelphia-Camden-Wilmington, PA-NJ-DE-MD | 470 | 0.18 | 0.96 | $ 24.10 | $ 50,120 |
| San Diego-Carlsbad, CA | 190 | 0.13 | 0.73 | $ 23.96 | $ 49,830 |
Nonmetropolitan areas with the highest employment in Prepress Technicians and Workers:
| Nonmetropolitan area | Employment (1) | Employment per thousand jobs | Location quotient (9) | Hourly mean wage | Annual mean wage (2) |
|---|---|---|---|---|---|
| Kansas nonmetropolitan area | 230 | 0.61 | 3.32 | $ 15.09 | $ 31,380 |
| Northern Indiana nonmetropolitan area | 180 | 0.86 | 4.71 | $ 13.76 | $ 28,610 |
| North Northeastern Ohio nonmetropolitan area (noncontiguous) | 160 | 0.50 | 2.75 | $ 18.27 | $ 37,990 |
| Northeastern Wisconsin nonmetropolitan area | 120 | 0.63 | 3.42 | $ 20.88 | $ 43,440 |
| South Central Wisconsin nonmetropolitan area | 100 | 0.49 | 2.70 | $ 21.11 | $ 43,900 |
Nonmetropolitan areas with the highest concentration of jobs and location quotients in Prepress Technicians and Workers:
| Nonmetropolitan area | Employment (1) | Employment per thousand jobs | Location quotient (9) | Hourly mean wage | Annual mean wage (2) |
|---|---|---|---|---|---|
| Northern Indiana nonmetropolitan area | 180 | 0.86 | 4.71 | $ 13.76 | $ 28,610 |
| Northeastern Wisconsin nonmetropolitan area | 120 | 0.63 | 3.42 | $ 20.88 | $ 43,440 |
| Kansas nonmetropolitan area | 230 | 0.61 | 3.32 | $ 15.09 | $ 31,380 |
| South Central Tennessee nonmetropolitan area | 50 | 0.52 | 2.82 | $ 16.52 | $ 34,360 |
| North Northeastern Ohio nonmetropolitan area (noncontiguous) | 160 | 0.50 | 2.75 | $ 18.27 | $ 37,990 |
Top paying nonmetropolitan areas for Prepress Technicians and Workers:
| Nonmetropolitan area | Employment (1) | Employment per thousand jobs | Location quotient (9) | Hourly mean wage | Annual mean wage (2) |
|---|---|---|---|---|---|
| South Central Wisconsin nonmetropolitan area | 100 | 0.49 | 2.70 | $ 21.11 | $ 43,900 |
| Northeastern Wisconsin nonmetropolitan area | 120 | 0.63 | 3.42 | $ 20.88 | $ 43,440 |
| Southeast Minnesota nonmetropolitan area | 60 | 0.42 | 2.31 | $ 20.62 | $ 42,890 |
| Balance of Lower Peninsula of Michigan nonmetropolitan area | 50 | 0.21 | 1.13 | $ 20.59 | $ 42,820 |
| Eastern Ohio nonmetropolitan area | 40 | 0.28 | 1.50 | $ 20.14 | $ 41,880 |
These estimates are calculated with data collected from employers in all industry sectors, all metropolitan and nonmetropolitan areas, and all states and the District of Columbia. The top employment and wage figures are provided above. The complete list is available in the downloadable XLS files.
The percentile wage estimate is the value of a wage below which a certain percent of workers fall. The median wage is the 50th percentile wage estimate—50 percent of workers earn less than the median and 50 percent of workers earn more than the median. More about percentile wages.
(1) Estimates for detailed occupations do not sum to the totals because the totals include occupations not shown separately. Estimates do not include self-employed workers.
(2) Annual wages have been calculated by multiplying the hourly mean wage by a "year-round, full-time" hours figure of 2,080 hours; for those occupations where there is not an hourly wage published, the annual wage has been directly calculated from the reported survey data.
(3) The relative standard error (RSE) is a measure of the reliability of a survey statistic. The smaller the relative standard error, the more precise the estimate.
(7) The value is less than .005 percent of industry employment.
(8) Estimate not released.
(9) The location quotient is the ratio of the area concentration of occupational employment to the national average concentration. A location quotient greater than one indicates the occupation has a higher share of employment than average, and a location quotient less than one indicates the occupation is less prevalent in the area than average.
Other OEWS estimates and related information:
May 2021 National Occupational Employment and Wage Estimates
May 2021 State Occupational Employment and Wage Estimates
May 2021 Metropolitan and Nonmetropolitan Area Occupational Employment and Wage Estimates
May 2021 National Industry-Specific Occupational Employment and Wage Estimates
Last Modified Date: March 31, 2022