
An official website of the United States government
An official website of the United States government
The .gov means it's official.
Federal government websites often end in .gov or .mil. Before sharing sensitive information,
make sure you're on a federal government site.
The site is secure.
The
https:// ensures that you are connecting to the official website and that any
information you provide is encrypted and transmitted securely.
Grind, sand, or polish, using hand tools or hand-held power tools, a variety of metal, wood, stone, clay, plastic, or glass objects. Includes chippers, buffers, and finishers.
Employment estimate and mean wage estimates for Grinding and Polishing Workers, Hand:
| Employment (1) | Employment RSE (3) |
Mean hourly wage |
Mean annual wage (2) |
Wage RSE (3) |
|---|---|---|---|---|
| 15,680 | 5.1 % | $ 17.30 | $ 35,990 | 1.2 % |
Percentile wage estimates for Grinding and Polishing Workers, Hand:
| Percentile | 10% | 25% | 50% (Median) |
75% | 90% |
|---|---|---|---|---|---|
| Hourly Wage | $ 11.76 | $ 14.31 | $ 17.15 | $ 18.71 | $ 22.95 |
| Annual Wage (2) | $ 24,470 | $ 29,750 | $ 35,670 | $ 38,910 | $ 47,730 |
Industries with the highest published employment and wages for Grinding and Polishing Workers, Hand are provided. For a list of all industries with employment in Grinding and Polishing Workers, Hand, see the Create Customized Tables function.
Industries with the highest levels of employment in Grinding and Polishing Workers, Hand:
| Industry | Employment (1) | Percent of industry employment | Hourly mean wage | Annual mean wage (2) |
|---|---|---|---|---|
| Employment Services | 2,620 | 0.08 | $ 13.68 | $ 28,450 |
| Nonmetallic Mineral Product Manufacturing | 1,680 | 0.42 | $ 18.70 | $ 38,900 |
| Other Miscellaneous Manufacturing | 1,260 | 0.46 | $ 18.31 | $ 38,080 |
| Machine Shops; Turned Product; and Screw, Nut, and Bolt Manufacturing | 950 | 0.29 | $ 17.68 | $ 36,770 |
| Foundries | 940 | 0.93 | $ 16.29 | $ 33,880 |
Industries with the highest concentration of employment in Grinding and Polishing Workers, Hand:
| Industry | Employment (1) | Percent of industry employment | Hourly mean wage | Annual mean wage (2) |
|---|---|---|---|---|
| Foundries | 940 | 0.93 | $ 16.29 | $ 33,880 |
| Ship and Boat Building | 900 | 0.62 | $ 17.07 | $ 35,500 |
| Coating, Engraving, Heat Treating, and Allied Activities | 730 | 0.59 | $ 17.65 | $ 36,710 |
| Other Miscellaneous Manufacturing | 1,260 | 0.46 | $ 18.31 | $ 38,080 |
| Nonmetallic Mineral Product Manufacturing | 1,680 | 0.42 | $ 18.70 | $ 38,900 |
Top paying industries for Grinding and Polishing Workers, Hand:
| Industry | Employment (1) | Percent of industry employment | Hourly mean wage | Annual mean wage (2) |
|---|---|---|---|---|
| Aerospace Product and Parts Manufacturing | 450 | 0.10 | $ 23.86 | $ 49,620 |
| Metalworking Machinery Manufacturing | 220 | 0.13 | $ 21.75 | $ 45,240 |
| Electric Lighting Equipment Manufacturing | 50 | 0.13 | $ 21.55 | $ 44,820 |
| Foundation, Structure, and Building Exterior Contractors | 160 | 0.02 | $ 20.66 | $ 42,970 |
| Semiconductor and Other Electronic Component Manufacturing | 240 | 0.07 | $ 20.58 | $ 42,800 |
States and areas with the highest published employment, location quotients, and wages for Grinding and Polishing Workers, Hand are provided. For a list of all areas with employment in Grinding and Polishing Workers, Hand, see the Create Customized Tables function.
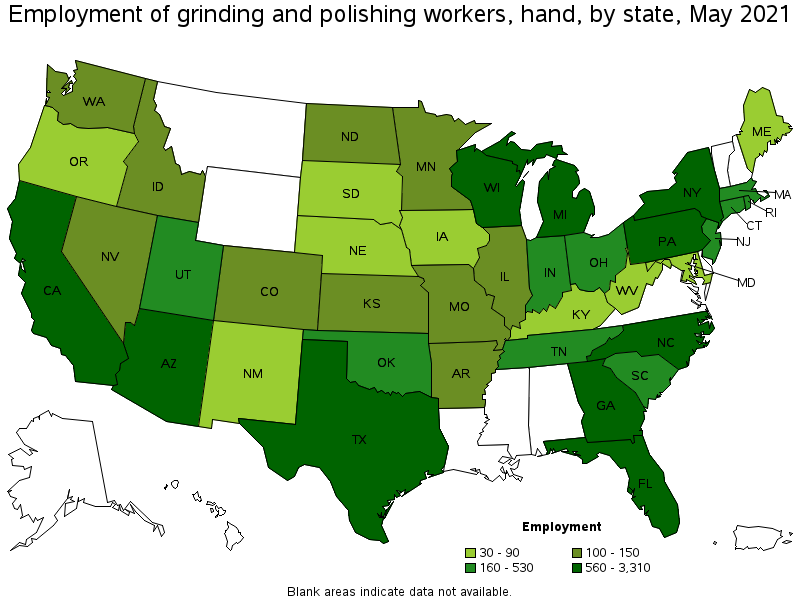
States with the highest employment level in Grinding and Polishing Workers, Hand:
| State | Employment (1) | Employment per thousand jobs | Location quotient (9) | Hourly mean wage | Annual mean wage (2) |
|---|---|---|---|---|---|
| California | 3,310 | 0.20 | 1.80 | $ 18.23 | $ 37,920 |
| Texas | 1,160 | 0.09 | 0.85 | $ 15.53 | $ 32,300 |
| Wisconsin | 1,020 | 0.37 | 3.33 | $ 16.61 | $ 34,550 |
| Florida | 750 | 0.09 | 0.79 | $ 16.15 | $ 33,600 |
| Michigan | 740 | 0.18 | 1.63 | $ 16.82 | $ 34,980 |
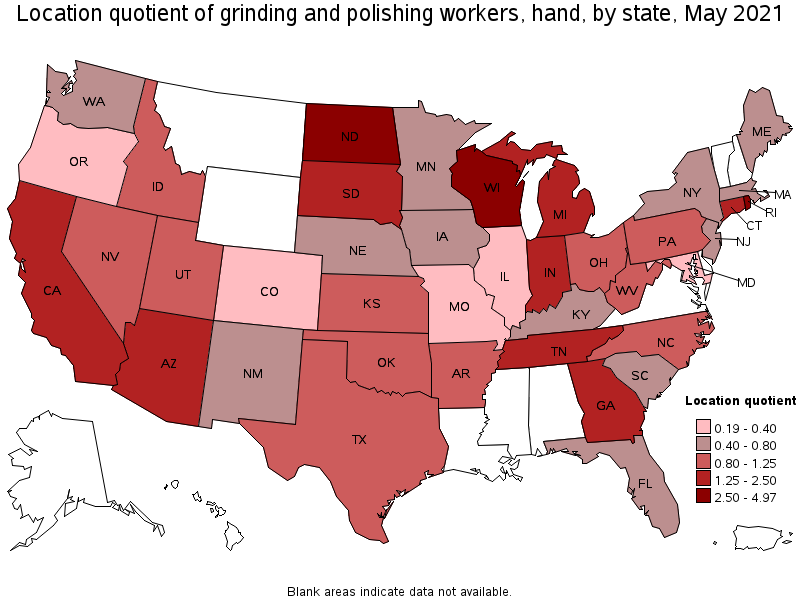
States with the highest concentration of jobs and location quotients in Grinding and Polishing Workers, Hand:
| State | Employment (1) | Employment per thousand jobs | Location quotient (9) | Hourly mean wage | Annual mean wage (2) |
|---|---|---|---|---|---|
| Rhode Island | 250 | 0.55 | 4.97 | $ 19.05 | $ 39,620 |
| Wisconsin | 1,020 | 0.37 | 3.33 | $ 16.61 | $ 34,550 |
| North Dakota | 120 | 0.30 | 2.72 | $ 16.52 | $ 34,370 |
| California | 3,310 | 0.20 | 1.80 | $ 18.23 | $ 37,920 |
| Arizona | 560 | 0.20 | 1.75 | $ 18.83 | $ 39,160 |
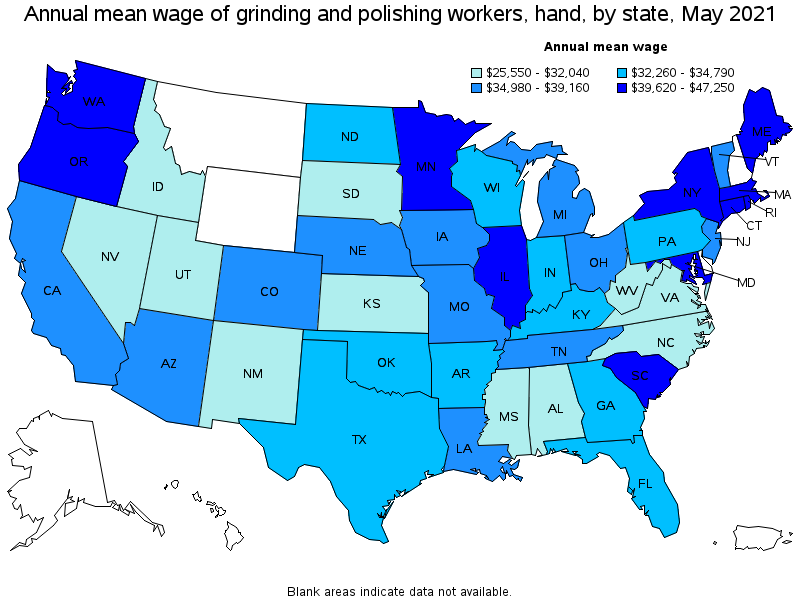
Top paying states for Grinding and Polishing Workers, Hand:
| State | Employment (1) | Employment per thousand jobs | Location quotient (9) | Hourly mean wage | Annual mean wage (2) |
|---|---|---|---|---|---|
| Connecticut | 250 | 0.16 | 1.44 | $ 22.72 | $ 47,250 |
| Maine | 30 | 0.05 | 0.48 | $ 21.50 | $ 44,720 |
| Maryland | 60 | 0.02 | 0.20 | $ 21.21 | $ 44,120 |
| New York | 690 | 0.08 | 0.72 | $ 21.13 | $ 43,950 |
| Oregon | 60 | 0.03 | 0.27 | $ 20.57 | $ 42,790 |
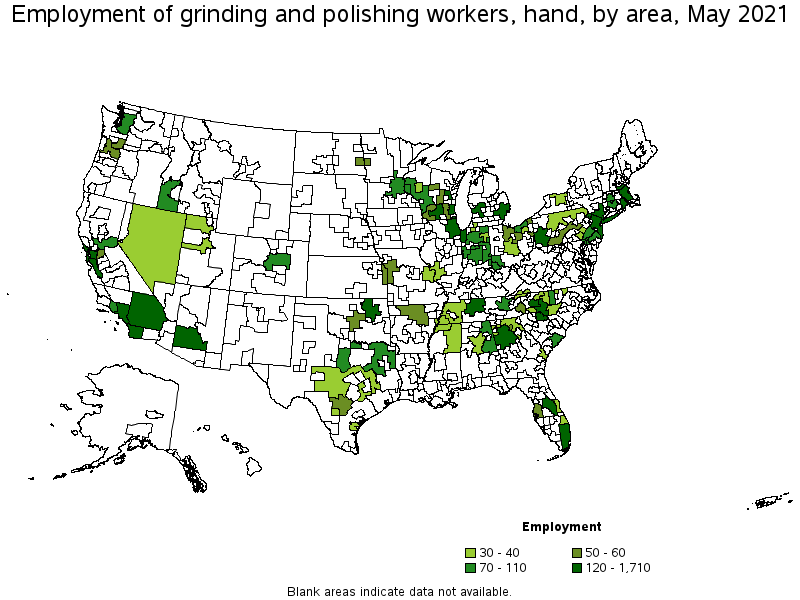
Metropolitan areas with the highest employment level in Grinding and Polishing Workers, Hand:
| Metropolitan area | Employment (1) | Employment per thousand jobs | Location quotient (9) | Hourly mean wage | Annual mean wage (2) |
|---|---|---|---|---|---|
| Los Angeles-Long Beach-Anaheim, CA | 1,710 | 0.30 | 2.69 | $ 17.75 | $ 36,920 |
| New York-Newark-Jersey City, NY-NJ-PA | 760 | 0.09 | 0.79 | $ 21.18 | $ 44,050 |
| Phoenix-Mesa-Scottsdale, AZ | 490 | 0.23 | 2.09 | $ 19.16 | $ 39,850 |
| Riverside-San Bernardino-Ontario, CA | 340 | 0.22 | 2.02 | $ 17.13 | $ 35,620 |
| San Diego-Carlsbad, CA | 280 | 0.20 | 1.80 | $ 18.18 | $ 37,810 |
| Providence-Warwick, RI-MA | 270 | 0.49 | 4.45 | $ 19.24 | $ 40,020 |
| San Francisco-Oakland-Hayward, CA | 250 | 0.11 | 1.00 | $ 21.59 | $ 44,900 |
| San Jose-Sunnyvale-Santa Clara, CA | 240 | 0.22 | 2.02 | $ 20.66 | $ 42,970 |
| Atlanta-Sandy Springs-Roswell, GA | 200 | 0.08 | 0.71 | $ 18.50 | $ 38,470 |
| Miami-Fort Lauderdale-West Palm Beach, FL | 200 | 0.08 | 0.74 | $ 16.60 | $ 34,520 |
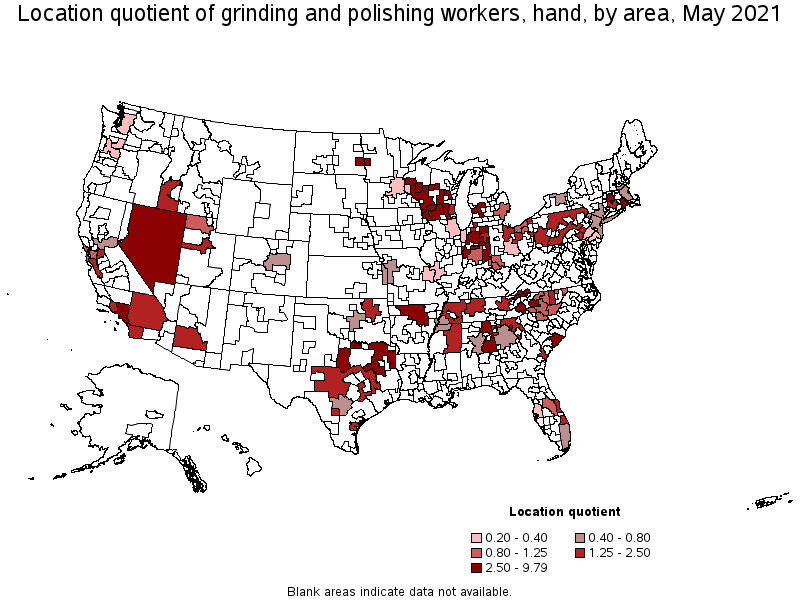
Metropolitan areas with the highest concentration of jobs and location quotients in Grinding and Polishing Workers, Hand:
| Metropolitan area | Employment (1) | Employment per thousand jobs | Location quotient (9) | Hourly mean wage | Annual mean wage (2) |
|---|---|---|---|---|---|
| Appleton, WI | 130 | 1.09 | 9.79 | $ 15.18 | $ 31,570 |
| Hickory-Lenoir-Morganton, NC | 130 | 0.90 | 8.07 | $ 14.91 | $ 31,000 |
| Wausau, WI | 50 | 0.72 | 6.51 | $ 16.74 | $ 34,820 |
| Gainesville, GA | 60 | 0.62 | 5.58 | $ 15.60 | $ 32,450 |
| Providence-Warwick, RI-MA | 270 | 0.49 | 4.45 | $ 19.24 | $ 40,020 |
| Eau Claire, WI | 30 | 0.39 | 3.51 | $ 17.00 | $ 35,360 |
| Grand Rapids-Wyoming, MI | 200 | 0.39 | 3.48 | $ 16.60 | $ 34,520 |
| Fargo, ND-MN | 50 | 0.38 | 3.38 | $ 17.87 | $ 37,180 |
| Charleston-North Charleston, SC | 110 | 0.32 | 2.89 | $ 20.60 | $ 42,850 |
| Madison, WI | 120 | 0.31 | 2.75 | $ 16.44 | $ 34,190 |
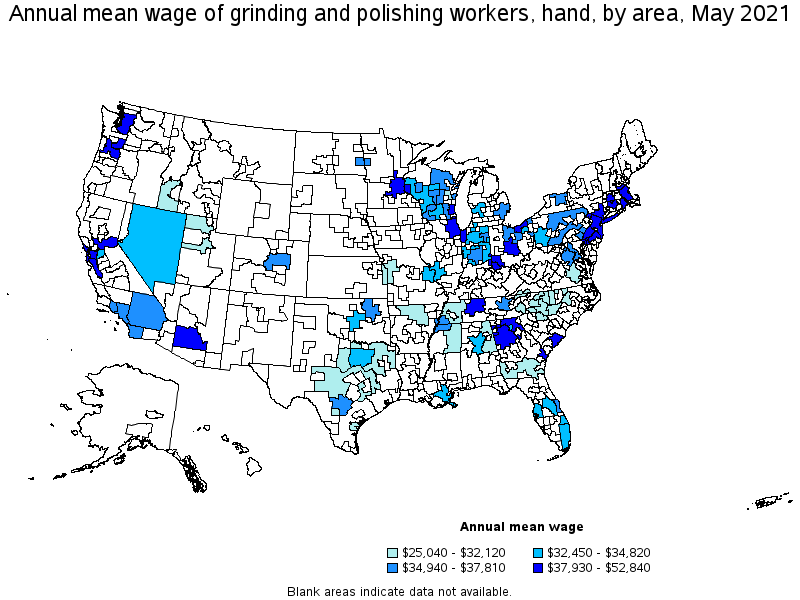
Top paying metropolitan areas for Grinding and Polishing Workers, Hand:
| Metropolitan area | Employment (1) | Employment per thousand jobs | Location quotient (9) | Hourly mean wage | Annual mean wage (2) |
|---|---|---|---|---|---|
| Springfield, MA-CT | 90 | 0.29 | 2.62 | $ 25.40 | $ 52,840 |
| Hartford-West Hartford-East Hartford, CT | 90 | 0.17 | 1.56 | $ 22.39 | $ 46,560 |
| Cincinnati, OH-KY-IN | 110 | 0.11 | 0.97 | $ 21.93 | $ 45,620 |
| San Francisco-Oakland-Hayward, CA | 250 | 0.11 | 1.00 | $ 21.59 | $ 44,900 |
| Portland-Vancouver-Hillsboro, OR-WA | 50 | 0.04 | 0.37 | $ 21.58 | $ 44,880 |
| New York-Newark-Jersey City, NY-NJ-PA | 760 | 0.09 | 0.79 | $ 21.18 | $ 44,050 |
| Minneapolis-St. Paul-Bloomington, MN-WI | 70 | 0.04 | 0.33 | $ 21.04 | $ 43,770 |
| San Jose-Sunnyvale-Santa Clara, CA | 240 | 0.22 | 2.02 | $ 20.66 | $ 42,970 |
| Charleston-North Charleston, SC | 110 | 0.32 | 2.89 | $ 20.60 | $ 42,850 |
| Columbus, OH | 40 | 0.04 | 0.36 | $ 20.49 | $ 42,630 |
Nonmetropolitan areas with the highest employment in Grinding and Polishing Workers, Hand:
| Nonmetropolitan area | Employment (1) | Employment per thousand jobs | Location quotient (9) | Hourly mean wage | Annual mean wage (2) |
|---|---|---|---|---|---|
| Northeast Alabama nonmetropolitan area | 80 | 0.59 | 5.31 | $ 12.04 | $ 25,040 |
| Northern Indiana nonmetropolitan area | 80 | 0.39 | 3.52 | $ 16.00 | $ 33,280 |
| North Texas Region of Texas nonmetropolitan area | 80 | 0.30 | 2.69 | $ 14.92 | $ 31,020 |
| Western Wisconsin nonmetropolitan area | 70 | 0.55 | 4.97 | $ 15.78 | $ 32,820 |
| Central Indiana nonmetropolitan area | 70 | 0.48 | 4.34 | $ 16.64 | $ 34,610 |
Nonmetropolitan areas with the highest concentration of jobs and location quotients in Grinding and Polishing Workers, Hand:
| Nonmetropolitan area | Employment (1) | Employment per thousand jobs | Location quotient (9) | Hourly mean wage | Annual mean wage (2) |
|---|---|---|---|---|---|
| Northeast Alabama nonmetropolitan area | 80 | 0.59 | 5.31 | $ 12.04 | $ 25,040 |
| Western Wisconsin nonmetropolitan area | 70 | 0.55 | 4.97 | $ 15.78 | $ 32,820 |
| North Arkansas nonmetropolitan area | 60 | 0.50 | 4.45 | $ 14.88 | $ 30,960 |
| Central Indiana nonmetropolitan area | 70 | 0.48 | 4.34 | $ 16.64 | $ 34,610 |
| Nevada nonmetropolitan area | 40 | 0.40 | 3.60 | $ 16.11 | $ 33,500 |
Top paying nonmetropolitan areas for Grinding and Polishing Workers, Hand:
| Nonmetropolitan area | Employment (1) | Employment per thousand jobs | Location quotient (9) | Hourly mean wage | Annual mean wage (2) |
|---|---|---|---|---|---|
| North Georgia nonmetropolitan area | 40 | 0.26 | 2.38 | $ 18.75 | $ 38,990 |
| Northern Pennsylvania nonmetropolitan area | 40 | 0.24 | 2.20 | $ 17.46 | $ 36,330 |
| Southern Pennsylvania nonmetropolitan area | 50 | 0.26 | 2.31 | $ 17.19 | $ 35,760 |
| North Northeastern Ohio nonmetropolitan area (noncontiguous) | 60 | 0.21 | 1.86 | $ 17.16 | $ 35,700 |
| Northeastern Wisconsin nonmetropolitan area | (8) | (8) | (8) | $ 17.00 | $ 35,350 |
These estimates are calculated with data collected from employers in all industry sectors, all metropolitan and nonmetropolitan areas, and all states and the District of Columbia. The top employment and wage figures are provided above. The complete list is available in the downloadable XLS files.
The percentile wage estimate is the value of a wage below which a certain percent of workers fall. The median wage is the 50th percentile wage estimate—50 percent of workers earn less than the median and 50 percent of workers earn more than the median. More about percentile wages.
(1) Estimates for detailed occupations do not sum to the totals because the totals include occupations not shown separately. Estimates do not include self-employed workers.
(2) Annual wages have been calculated by multiplying the hourly mean wage by a "year-round, full-time" hours figure of 2,080 hours; for those occupations where there is not an hourly wage published, the annual wage has been directly calculated from the reported survey data.
(3) The relative standard error (RSE) is a measure of the reliability of a survey statistic. The smaller the relative standard error, the more precise the estimate.
(8) Estimate not released.
(9) The location quotient is the ratio of the area concentration of occupational employment to the national average concentration. A location quotient greater than one indicates the occupation has a higher share of employment than average, and a location quotient less than one indicates the occupation is less prevalent in the area than average.
Other OEWS estimates and related information:
May 2021 National Occupational Employment and Wage Estimates
May 2021 State Occupational Employment and Wage Estimates
May 2021 Metropolitan and Nonmetropolitan Area Occupational Employment and Wage Estimates
May 2021 National Industry-Specific Occupational Employment and Wage Estimates
Last Modified Date: March 31, 2022