
An official website of the United States government
An official website of the United States government
The .gov means it's official.
Federal government websites often end in .gov or .mil. Before sharing sensitive information,
make sure you're on a federal government site.
The site is secure.
The
https:// ensures that you are connecting to the official website and that any
information you provide is encrypted and transmitted securely.
Set up, operate, or tend machines that cut or slice materials, such as glass, stone, cork, rubber, tobacco, food, paper, or insulating material. Excludes �Cutting, Punching, and Press Machine Setters, Operators, and Tenders, Metal and Plastic� (51-4031), �Textile Cutting Machine Setters, Operators, and Tenders� (51-6062), and �Woodworking Machine Setters, Operators, and Tenders� (51-7040).
Employment estimate and mean wage estimates for Cutting and Slicing Machine Setters, Operators, and Tenders:
| Employment (1) | Employment RSE (3) |
Mean hourly wage |
Mean annual wage (2) |
Wage RSE (3) |
|---|---|---|---|---|
| 55,930 | 1.6 % | $ 19.23 | $ 40,010 | 0.4 % |
Percentile wage estimates for Cutting and Slicing Machine Setters, Operators, and Tenders:
| Percentile | 10% | 25% | 50% (Median) |
75% | 90% |
|---|---|---|---|---|---|
| Hourly Wage | $ 13.94 | $ 15.05 | $ 18.18 | $ 22.73 | $ 23.90 |
| Annual Wage (2) | $ 28,990 | $ 31,310 | $ 37,810 | $ 47,280 | $ 49,710 |
Industries with the highest published employment and wages for Cutting and Slicing Machine Setters, Operators, and Tenders are provided. For a list of all industries with employment in Cutting and Slicing Machine Setters, Operators, and Tenders, see the Create Customized Tables function.
Industries with the highest levels of employment in Cutting and Slicing Machine Setters, Operators, and Tenders:
| Industry | Employment (1) | Percent of industry employment | Hourly mean wage | Annual mean wage (2) |
|---|---|---|---|---|
| Nonmetallic Mineral Product Manufacturing | 12,030 | 3.01 | $ 19.24 | $ 40,020 |
| Converted Paper Product Manufacturing | 9,940 | 3.81 | $ 20.88 | $ 43,430 |
| Animal Slaughtering and Processing | 4,890 | 0.94 | $ 18.98 | $ 39,480 |
| Printing and Related Support Activities | 4,340 | 1.18 | $ 19.32 | $ 40,180 |
| Plastics Product Manufacturing | 2,880 | 0.49 | $ 17.27 | $ 35,930 |
Industries with the highest concentration of employment in Cutting and Slicing Machine Setters, Operators, and Tenders:
| Industry | Employment (1) | Percent of industry employment | Hourly mean wage | Annual mean wage (2) |
|---|---|---|---|---|
| Converted Paper Product Manufacturing | 9,940 | 3.81 | $ 20.88 | $ 43,430 |
| Nonmetallic Mineral Product Manufacturing | 12,030 | 3.01 | $ 19.24 | $ 40,020 |
| Rubber Product Manufacturing | 2,790 | 2.18 | $ 18.72 | $ 38,940 |
| Pulp, Paper, and Paperboard Mills | 1,660 | 1.90 | $ 23.31 | $ 48,490 |
| Leather and Hide Tanning and Finishing | 50 | 1.60 | $ 14.88 | $ 30,960 |
Top paying industries for Cutting and Slicing Machine Setters, Operators, and Tenders:
| Industry | Employment (1) | Percent of industry employment | Hourly mean wage | Annual mean wage (2) |
|---|---|---|---|---|
| Petroleum and Coal Products Manufacturing | 70 | 0.07 | $ 24.39 | $ 50,720 |
| Residential Building Construction | (8) | (8) | $ 24.09 | $ 50,120 |
| Other Specialty Trade Contractors | 120 | 0.02 | $ 23.72 | $ 49,340 |
| Tobacco Manufacturing | (8) | (8) | $ 23.33 | $ 48,520 |
| Pulp, Paper, and Paperboard Mills | 1,660 | 1.90 | $ 23.31 | $ 48,490 |
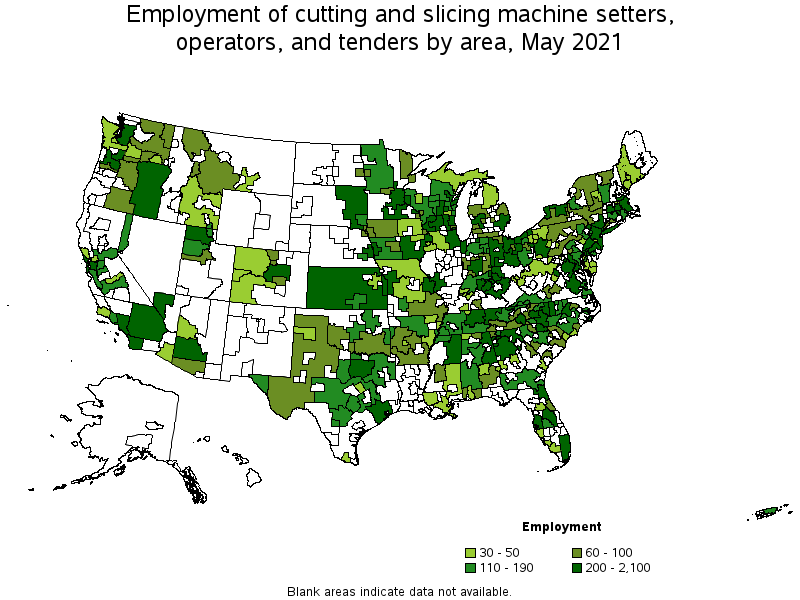
States and areas with the highest published employment, location quotients, and wages for Cutting and Slicing Machine Setters, Operators, and Tenders are provided. For a list of all areas with employment in Cutting and Slicing Machine Setters, Operators, and Tenders, see the Create Customized Tables function.
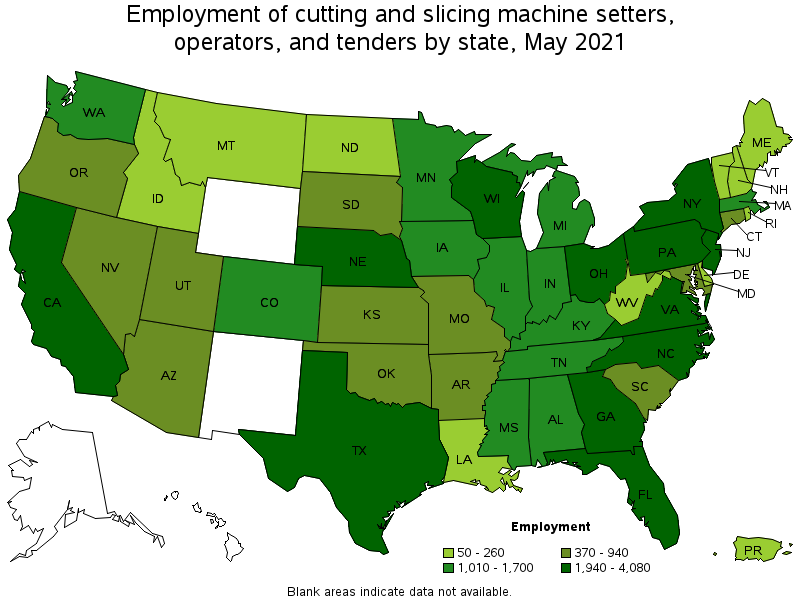
States with the highest employment level in Cutting and Slicing Machine Setters, Operators, and Tenders:
| State | Employment (1) | Employment per thousand jobs | Location quotient (9) | Hourly mean wage | Annual mean wage (2) |
|---|---|---|---|---|---|
| California | 4,080 | 0.25 | 0.62 | $ 20.10 | $ 41,800 |
| North Carolina | 3,640 | 0.82 | 2.07 | $ 17.71 | $ 36,830 |
| Texas | 2,760 | 0.23 | 0.57 | $ 17.91 | $ 37,240 |
| Nebraska | 2,660 | 2.77 | 6.98 | $ 21.29 | $ 44,290 |
| Wisconsin | 2,600 | 0.94 | 2.38 | $ 20.14 | $ 41,890 |
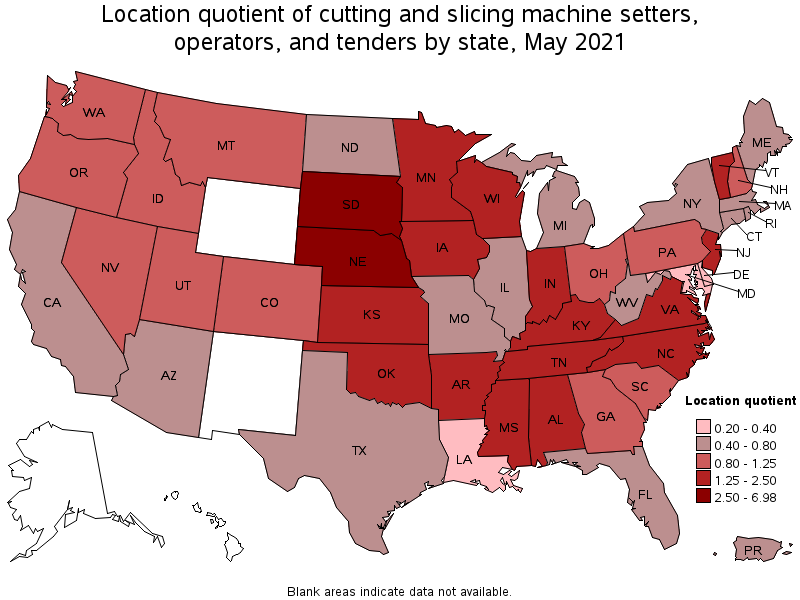
States with the highest concentration of jobs and location quotients in Cutting and Slicing Machine Setters, Operators, and Tenders:
| State | Employment (1) | Employment per thousand jobs | Location quotient (9) | Hourly mean wage | Annual mean wage (2) |
|---|---|---|---|---|---|
| Nebraska | 2,660 | 2.77 | 6.98 | $ 21.29 | $ 44,290 |
| South Dakota | 870 | 2.08 | 5.23 | $ 19.79 | $ 41,160 |
| Wisconsin | 2,600 | 0.94 | 2.38 | $ 20.14 | $ 41,890 |
| Vermont | 260 | 0.93 | 2.34 | $ 17.77 | $ 36,970 |
| Mississippi | 1,010 | 0.92 | 2.31 | $ 17.28 | $ 35,930 |
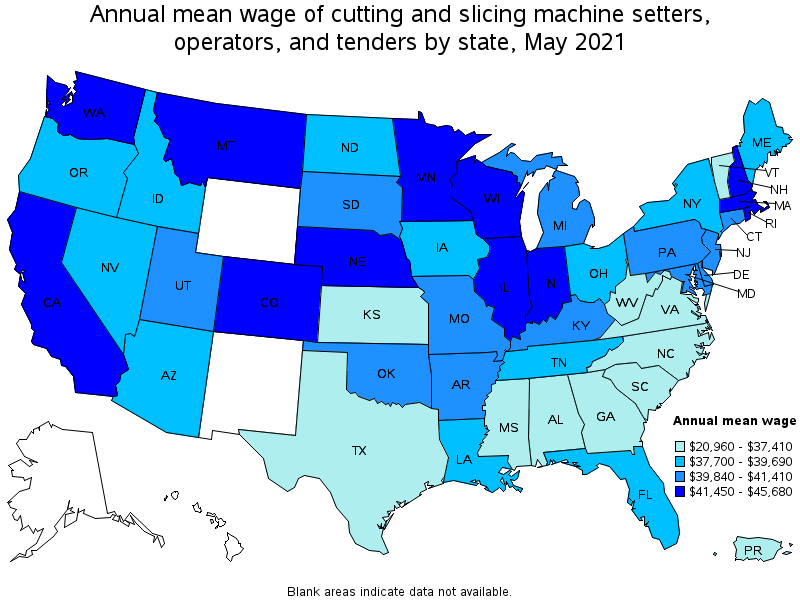
Top paying states for Cutting and Slicing Machine Setters, Operators, and Tenders:
| State | Employment (1) | Employment per thousand jobs | Location quotient (9) | Hourly mean wage | Annual mean wage (2) |
|---|---|---|---|---|---|
| Minnesota | 1,700 | 0.62 | 1.56 | $ 21.96 | $ 45,680 |
| New Hampshire | 210 | 0.32 | 0.81 | $ 21.87 | $ 45,490 |
| Montana | 230 | 0.48 | 1.22 | $ 21.65 | $ 45,040 |
| Nebraska | 2,660 | 2.77 | 6.98 | $ 21.29 | $ 44,290 |
| Colorado | 1,130 | 0.43 | 1.09 | $ 20.97 | $ 43,630 |
Metropolitan areas with the highest employment level in Cutting and Slicing Machine Setters, Operators, and Tenders:
| Metropolitan area | Employment (1) | Employment per thousand jobs | Location quotient (9) | Hourly mean wage | Annual mean wage (2) |
|---|---|---|---|---|---|
| New York-Newark-Jersey City, NY-NJ-PA | 2,100 | 0.24 | 0.61 | $ 19.93 | $ 41,440 |
| Los Angeles-Long Beach-Anaheim, CA | 1,620 | 0.28 | 0.71 | $ 19.40 | $ 40,360 |
| Omaha-Council Bluffs, NE-IA | 1,280 | 2.75 | 6.94 | $ 21.33 | $ 44,360 |
| Chicago-Naperville-Elgin, IL-IN-WI | 1,090 | 0.26 | 0.65 | $ 21.24 | $ 44,180 |
| Philadelphia-Camden-Wilmington, PA-NJ-DE-MD | 1,000 | 0.38 | 0.95 | $ 19.90 | $ 41,380 |
| Dallas-Fort Worth-Arlington, TX | 980 | 0.27 | 0.69 | $ 18.70 | $ 38,890 |
| Atlanta-Sandy Springs-Roswell, GA | 890 | 0.34 | 0.86 | $ 18.05 | $ 37,540 |
| Charlotte-Concord-Gastonia, NC-SC | 850 | 0.70 | 1.76 | $ 17.86 | $ 37,140 |
| Minneapolis-St. Paul-Bloomington, MN-WI | 780 | 0.43 | 1.08 | $ 22.27 | $ 46,320 |
| Denver-Aurora-Lakewood, CO | 690 | 0.47 | 1.19 | $ 20.59 | $ 42,830 |
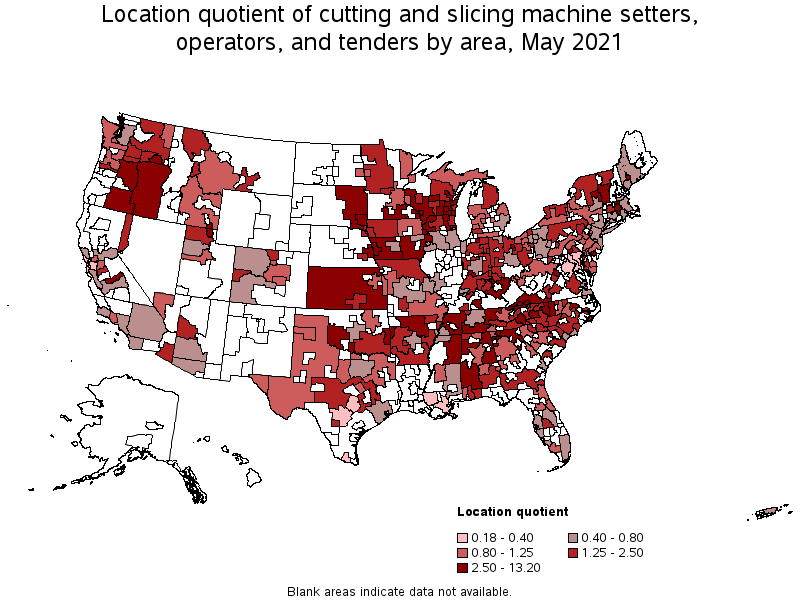
Metropolitan areas with the highest concentration of jobs and location quotients in Cutting and Slicing Machine Setters, Operators, and Tenders:
| Metropolitan area | Employment (1) | Employment per thousand jobs | Location quotient (9) | Hourly mean wage | Annual mean wage (2) |
|---|---|---|---|---|---|
| Hickory-Lenoir-Morganton, NC | 660 | 4.52 | 11.38 | $ 17.93 | $ 37,280 |
| Harrisonburg, VA | 200 | 3.31 | 8.34 | $ 14.09 | $ 29,310 |
| Vineland-Bridgeton, NJ | 190 | 3.27 | 8.24 | $ 19.86 | $ 41,300 |
| Wausau, WI | 190 | 2.81 | 7.07 | $ 21.34 | $ 44,380 |
| Omaha-Council Bluffs, NE-IA | 1,280 | 2.75 | 6.94 | $ 21.33 | $ 44,360 |
| Oshkosh-Neenah, WI | 230 | 2.51 | 6.32 | $ 21.38 | $ 44,480 |
| Gettysburg, PA | 80 | 2.50 | 6.30 | $ 21.10 | $ 43,880 |
| Elkhart-Goshen, IN | 290 | 2.17 | 5.47 | $ 19.62 | $ 40,820 |
| Walla Walla, WA | 50 | 1.97 | 4.97 | $ 18.70 | $ 38,890 |
| Dalton, GA | 120 | 1.96 | 4.95 | $ 13.79 | $ 28,670 |
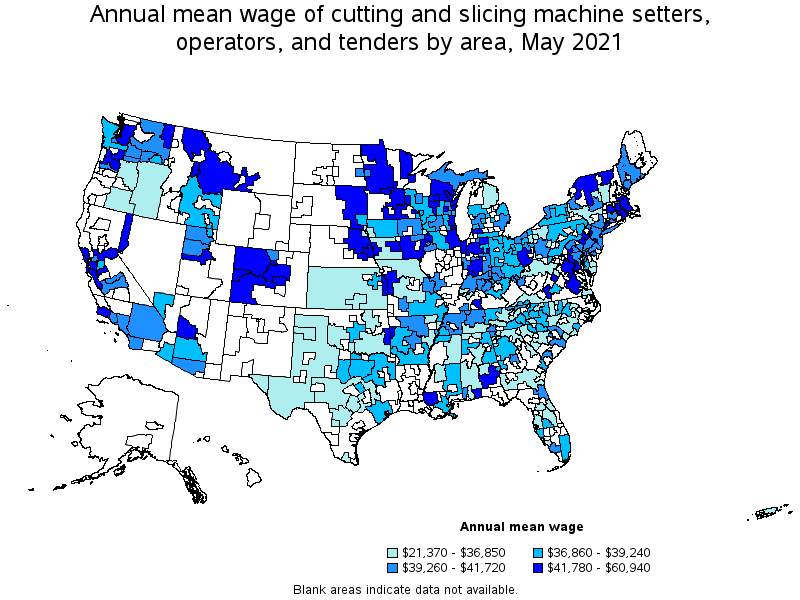
Top paying metropolitan areas for Cutting and Slicing Machine Setters, Operators, and Tenders:
| Metropolitan area | Employment (1) | Employment per thousand jobs | Location quotient (9) | Hourly mean wage | Annual mean wage (2) |
|---|---|---|---|---|---|
| Bowling Green, KY | 80 | 1.10 | 2.77 | $ 24.03 | $ 49,980 |
| Pensacola-Ferry Pass-Brent, FL | 90 | 0.51 | 1.29 | $ 23.27 | $ 48,400 |
| Duluth, MN-WI | 60 | 0.47 | 1.17 | $ 23.25 | $ 48,360 |
| San Francisco-Oakland-Hayward, CA | 340 | 0.15 | 0.39 | $ 22.67 | $ 47,150 |
| Billings, MT | 50 | 0.64 | 1.61 | $ 22.64 | $ 47,080 |
| San Jose-Sunnyvale-Santa Clara, CA | 180 | 0.17 | 0.43 | $ 22.59 | $ 46,990 |
| Minneapolis-St. Paul-Bloomington, MN-WI | 780 | 0.43 | 1.08 | $ 22.27 | $ 46,320 |
| Kalamazoo-Portage, MI | 90 | 0.70 | 1.77 | $ 22.14 | $ 46,040 |
| Washington-Arlington-Alexandria, DC-VA-MD-WV | 210 | 0.07 | 0.18 | $ 22.03 | $ 45,820 |
| Seattle-Tacoma-Bellevue, WA | 590 | 0.31 | 0.78 | $ 21.96 | $ 45,690 |
Nonmetropolitan areas with the highest employment in Cutting and Slicing Machine Setters, Operators, and Tenders:
| Nonmetropolitan area | Employment (1) | Employment per thousand jobs | Location quotient (9) | Hourly mean wage | Annual mean wage (2) |
|---|---|---|---|---|---|
| East South Dakota nonmetropolitan area | 660 | 5.24 | 13.20 | $ 20.23 | $ 42,070 |
| Northeast Mississippi nonmetropolitan area | 620 | 2.81 | 7.07 | $ 17.26 | $ 35,900 |
| Southeast Iowa nonmetropolitan area | 440 | 2.10 | 5.28 | $ 20.44 | $ 42,500 |
| Kansas nonmetropolitan area | 420 | 1.11 | 2.80 | $ 17.18 | $ 35,720 |
| North Georgia nonmetropolitan area | 330 | 1.92 | 4.83 | $ 17.68 | $ 36,770 |
Nonmetropolitan areas with the highest concentration of jobs and location quotients in Cutting and Slicing Machine Setters, Operators, and Tenders:
| Nonmetropolitan area | Employment (1) | Employment per thousand jobs | Location quotient (9) | Hourly mean wage | Annual mean wage (2) |
|---|---|---|---|---|---|
| East South Dakota nonmetropolitan area | 660 | 5.24 | 13.20 | $ 20.23 | $ 42,070 |
| Eastern Oregon nonmetropolitan area | 200 | 2.91 | 7.32 | $ 15.71 | $ 32,680 |
| Northeast Mississippi nonmetropolitan area | 620 | 2.81 | 7.07 | $ 17.26 | $ 35,900 |
| Southwest Iowa nonmetropolitan area | 190 | 2.39 | 6.02 | $ 17.64 | $ 36,690 |
| Southeast Iowa nonmetropolitan area | 440 | 2.10 | 5.28 | $ 20.44 | $ 42,500 |
Top paying nonmetropolitan areas for Cutting and Slicing Machine Setters, Operators, and Tenders:
| Nonmetropolitan area | Employment (1) | Employment per thousand jobs | Location quotient (9) | Hourly mean wage | Annual mean wage (2) |
|---|---|---|---|---|---|
| Northwest Colorado nonmetropolitan area | 30 | 0.29 | 0.73 | $ 29.30 | $ 60,940 |
| Southwest Colorado nonmetropolitan area | 30 | 0.32 | 0.79 | $ 25.25 | $ 52,510 |
| Northeastern Wisconsin nonmetropolitan area | 170 | 0.88 | 2.22 | $ 22.40 | $ 46,590 |
| West Montana nonmetropolitan area | 60 | 0.75 | 1.90 | $ 21.89 | $ 45,540 |
| Southeast Alabama nonmetropolitan area | 70 | 0.83 | 2.10 | $ 21.51 | $ 44,740 |
These estimates are calculated with data collected from employers in all industry sectors, all metropolitan and nonmetropolitan areas, and all states and the District of Columbia. The top employment and wage figures are provided above. The complete list is available in the downloadable XLS files.
The percentile wage estimate is the value of a wage below which a certain percent of workers fall. The median wage is the 50th percentile wage estimate—50 percent of workers earn less than the median and 50 percent of workers earn more than the median. More about percentile wages.
(1) Estimates for detailed occupations do not sum to the totals because the totals include occupations not shown separately. Estimates do not include self-employed workers.
(2) Annual wages have been calculated by multiplying the hourly mean wage by a "year-round, full-time" hours figure of 2,080 hours; for those occupations where there is not an hourly wage published, the annual wage has been directly calculated from the reported survey data.
(3) The relative standard error (RSE) is a measure of the reliability of a survey statistic. The smaller the relative standard error, the more precise the estimate.
(8) Estimate not released.
(9) The location quotient is the ratio of the area concentration of occupational employment to the national average concentration. A location quotient greater than one indicates the occupation has a higher share of employment than average, and a location quotient less than one indicates the occupation is less prevalent in the area than average.
Other OEWS estimates and related information:
May 2021 National Occupational Employment and Wage Estimates
May 2021 State Occupational Employment and Wage Estimates
May 2021 Metropolitan and Nonmetropolitan Area Occupational Employment and Wage Estimates
May 2021 National Industry-Specific Occupational Employment and Wage Estimates
Last Modified Date: March 31, 2022