
An official website of the United States government
An official website of the United States government
The .gov means it's official.
Federal government websites often end in .gov or .mil. Before sharing sensitive information,
make sure you're on a federal government site.
The site is secure.
The
https:// ensures that you are connecting to the official website and that any
information you provide is encrypted and transmitted securely.
Paint, coat, or decorate articles, such as furniture, glass, plateware, pottery, jewelry, toys, books, or leather. Excludes �Artists and Related Workers" (27-1010), �Designers� (27-1020), �Photographic Process Workers and Processing Machine Operators� (51-9151), and �Etchers and Engravers� (51-9194).
Employment estimate and mean wage estimates for Painting, Coating, and Decorating Workers:
| Employment (1) | Employment RSE (3) |
Mean hourly wage |
Mean annual wage (2) |
Wage RSE (3) |
|---|---|---|---|---|
| 11,850 | 4.5 % | $ 18.39 | $ 38,250 | 1.1 % |
Percentile wage estimates for Painting, Coating, and Decorating Workers:
| Percentile | 10% | 25% | 50% (Median) |
75% | 90% |
|---|---|---|---|---|---|
| Hourly Wage | $ 12.59 | $ 14.43 | $ 17.95 | $ 22.04 | $ 24.39 |
| Annual Wage (2) | $ 26,190 | $ 30,010 | $ 37,330 | $ 45,850 | $ 50,720 |
Industries with the highest published employment and wages for Painting, Coating, and Decorating Workers are provided. For a list of all industries with employment in Painting, Coating, and Decorating Workers, see the Create Customized Tables function.
Industries with the highest levels of employment in Painting, Coating, and Decorating Workers:
| Industry | Employment (1) | Percent of industry employment | Hourly mean wage | Annual mean wage (2) |
|---|---|---|---|---|
| Other Miscellaneous Manufacturing | 1,550 | 0.56 | $ 18.19 | $ 37,840 |
| Coating, Engraving, Heat Treating, and Allied Activities | 1,310 | 1.06 | $ 15.79 | $ 32,850 |
| Furniture and Related Product Manufacturing (3371 and 3372 only) | 890 | 0.27 | $ 17.35 | $ 36,080 |
| Automotive Repair and Maintenance | 830 | 0.09 | $ 20.21 | $ 42,030 |
| Nonmetallic Mineral Product Manufacturing | 680 | 0.17 | $ 17.66 | $ 36,720 |
Industries with the highest concentration of employment in Painting, Coating, and Decorating Workers:
| Industry | Employment (1) | Percent of industry employment | Hourly mean wage | Annual mean wage (2) |
|---|---|---|---|---|
| Coating, Engraving, Heat Treating, and Allied Activities | 1,310 | 1.06 | $ 15.79 | $ 32,850 |
| Other Miscellaneous Manufacturing | 1,550 | 0.56 | $ 18.19 | $ 37,840 |
| Other Leather and Allied Product Manufacturing | 50 | 0.43 | $ 14.73 | $ 30,640 |
| Furniture and Related Product Manufacturing (3371 and 3372 only) | 890 | 0.27 | $ 17.35 | $ 36,080 |
| Nonmetallic Mineral Product Manufacturing | 680 | 0.17 | $ 17.66 | $ 36,720 |
Top paying industries for Painting, Coating, and Decorating Workers:
| Industry | Employment (1) | Percent of industry employment | Hourly mean wage | Annual mean wage (2) |
|---|---|---|---|---|
| Local Government, excluding schools and hospitals (OEWS Designation) | 90 | (7) | $ 29.32 | $ 60,980 |
| Federal Executive Branch (OEWS Designation) | 80 | (7) | $ 28.86 | $ 60,040 |
| Personal and Household Goods Repair and Maintenance | 90 | 0.12 | $ 23.81 | $ 49,530 |
| General Medical and Surgical Hospitals | (8) | (8) | $ 23.58 | $ 49,040 |
| Aerospace Product and Parts Manufacturing | 40 | 0.01 | $ 22.65 | $ 47,120 |
States and areas with the highest published employment, location quotients, and wages for Painting, Coating, and Decorating Workers are provided. For a list of all areas with employment in Painting, Coating, and Decorating Workers, see the Create Customized Tables function.
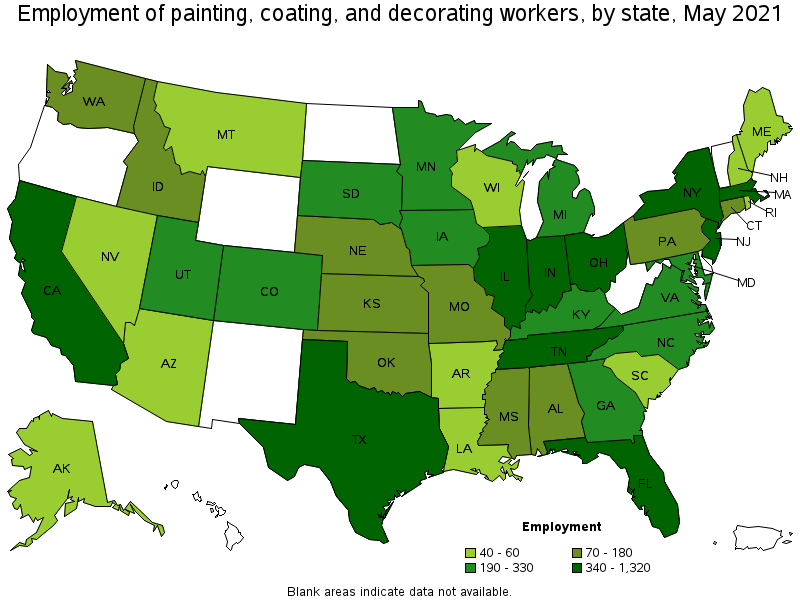
States with the highest employment level in Painting, Coating, and Decorating Workers:
| State | Employment (1) | Employment per thousand jobs | Location quotient (9) | Hourly mean wage | Annual mean wage (2) |
|---|---|---|---|---|---|
| California | 1,320 | 0.08 | 0.95 | $ 20.58 | $ 42,800 |
| Tennessee | 1,030 | 0.35 | 4.12 | $ 18.79 | $ 39,080 |
| Indiana | 880 | 0.29 | 3.50 | $ 17.10 | $ 35,560 |
| Texas | 830 | 0.07 | 0.81 | $ 14.87 | $ 30,930 |
| New Jersey | 640 | 0.17 | 1.98 | $ 19.62 | $ 40,810 |
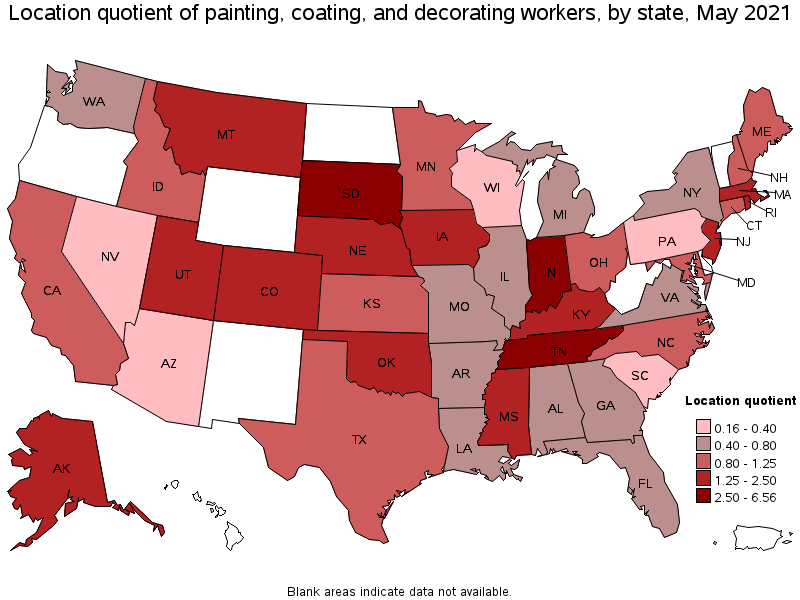
States with the highest concentration of jobs and location quotients in Painting, Coating, and Decorating Workers:
| State | Employment (1) | Employment per thousand jobs | Location quotient (9) | Hourly mean wage | Annual mean wage (2) |
|---|---|---|---|---|---|
| South Dakota | 230 | 0.55 | 6.56 | $ 17.65 | $ 36,720 |
| Tennessee | 1,030 | 0.35 | 4.12 | $ 18.79 | $ 39,080 |
| Indiana | 880 | 0.29 | 3.50 | $ 17.10 | $ 35,560 |
| Iowa | 260 | 0.18 | 2.10 | $ 18.41 | $ 38,290 |
| New Jersey | 640 | 0.17 | 1.98 | $ 19.62 | $ 40,810 |
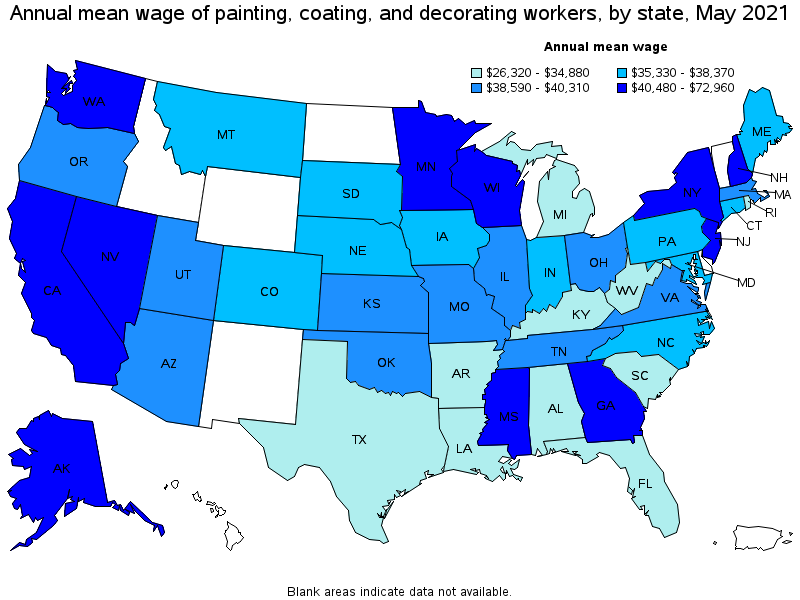
Top paying states for Painting, Coating, and Decorating Workers:
| State | Employment (1) | Employment per thousand jobs | Location quotient (9) | Hourly mean wage | Annual mean wage (2) |
|---|---|---|---|---|---|
| Alaska | 40 | 0.13 | 1.56 | $ 35.08 | $ 72,960 |
| Georgia | 230 | 0.05 | 0.61 | $ 21.04 | $ 43,750 |
| Washington | 160 | 0.05 | 0.58 | $ 21.00 | $ 43,680 |
| California | 1,320 | 0.08 | 0.95 | $ 20.58 | $ 42,800 |
| New York | 520 | 0.06 | 0.72 | $ 20.20 | $ 42,010 |
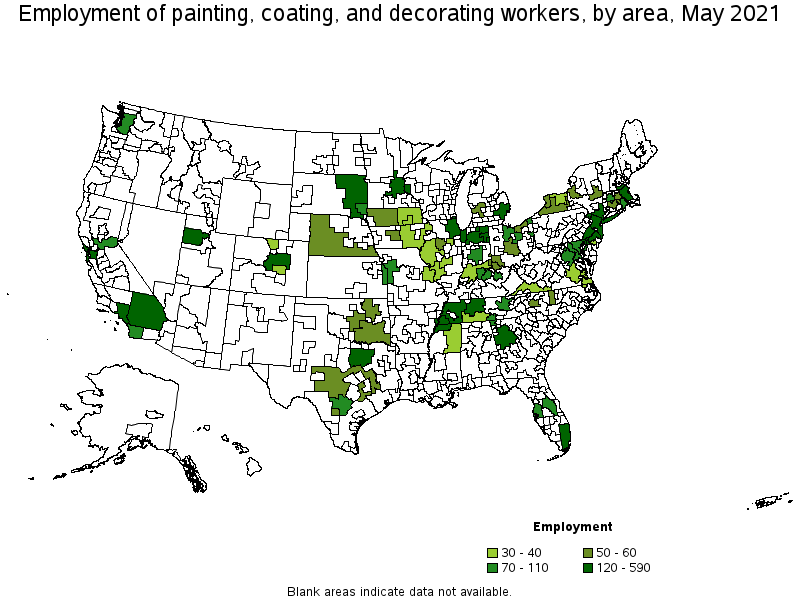
Metropolitan areas with the highest employment level in Painting, Coating, and Decorating Workers:
| Metropolitan area | Employment (1) | Employment per thousand jobs | Location quotient (9) | Hourly mean wage | Annual mean wage (2) |
|---|---|---|---|---|---|
| New York-Newark-Jersey City, NY-NJ-PA | 590 | 0.07 | 0.81 | $ 20.03 | $ 41,660 |
| Los Angeles-Long Beach-Anaheim, CA | 560 | 0.10 | 1.16 | $ 19.93 | $ 41,460 |
| Nashville-Davidson--Murfreesboro--Franklin, TN | 300 | 0.30 | 3.60 | $ 18.92 | $ 39,350 |
| Chicago-Naperville-Elgin, IL-IN-WI | 270 | 0.06 | 0.75 | $ 19.85 | $ 41,290 |
| Dallas-Fort Worth-Arlington, TX | 260 | 0.07 | 0.88 | $ 14.87 | $ 30,930 |
| Boston-Cambridge-Nashua, MA-NH | 220 | 0.08 | 1.01 | $ 19.63 | $ 40,830 |
| San Francisco-Oakland-Hayward, CA | 200 | 0.09 | 1.08 | $ 25.38 | $ 52,790 |
| Elkhart-Goshen, IN | 180 | 1.32 | 15.75 | $ 18.82 | $ 39,150 |
| Denver-Aurora-Lakewood, CO | 180 | 0.12 | 1.43 | $ 18.13 | $ 37,710 |
| Atlanta-Sandy Springs-Roswell, GA | 170 | 0.07 | 0.80 | $ 21.30 | $ 44,310 |
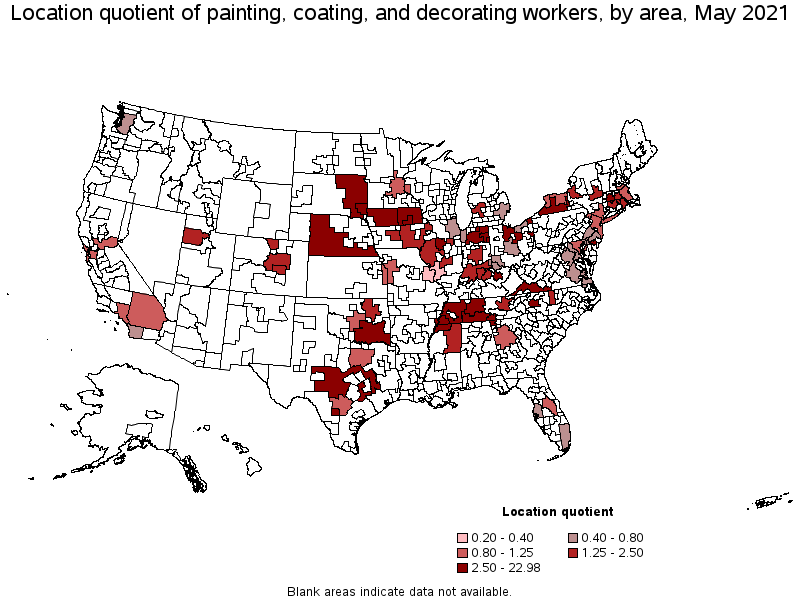
Metropolitan areas with the highest concentration of jobs and location quotients in Painting, Coating, and Decorating Workers:
| Metropolitan area | Employment (1) | Employment per thousand jobs | Location quotient (9) | Hourly mean wage | Annual mean wage (2) |
|---|---|---|---|---|---|
| Elkhart-Goshen, IN | 180 | 1.32 | 15.75 | $ 18.82 | $ 39,150 |
| Vineland-Bridgeton, NJ | 40 | 0.71 | 8.41 | $ 20.93 | $ 43,540 |
| Sioux Falls, SD | 90 | 0.59 | 6.97 | $ 17.92 | $ 37,270 |
| Fort Wayne, IN | 120 | 0.56 | 6.67 | $ 18.00 | $ 37,440 |
| Waterloo-Cedar Falls, IA | 30 | 0.39 | 4.66 | $ 19.62 | $ 40,810 |
| Hickory-Lenoir-Morganton, NC | 50 | 0.36 | 4.28 | $ 16.65 | $ 34,640 |
| Springfield, MA-CT | 110 | 0.34 | 4.09 | $ 19.10 | $ 39,720 |
| Peoria, IL | 50 | 0.30 | 3.60 | $ 17.07 | $ 35,500 |
| Nashville-Davidson--Murfreesboro--Franklin, TN | 300 | 0.30 | 3.60 | $ 18.92 | $ 39,350 |
| Lexington-Fayette, KY | 70 | 0.27 | 3.20 | $ 15.77 | $ 32,800 |
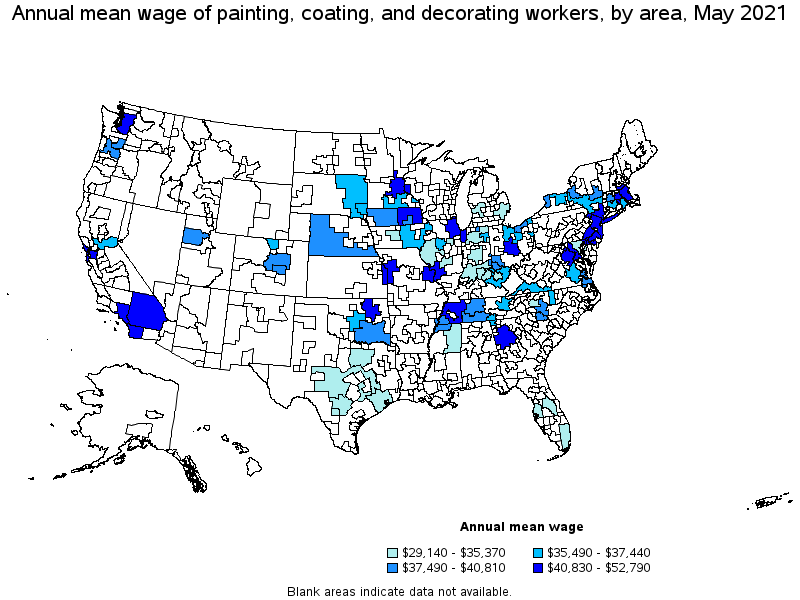
Top paying metropolitan areas for Painting, Coating, and Decorating Workers:
| Metropolitan area | Employment (1) | Employment per thousand jobs | Location quotient (9) | Hourly mean wage | Annual mean wage (2) |
|---|---|---|---|---|---|
| San Francisco-Oakland-Hayward, CA | 200 | 0.09 | 1.08 | $ 25.38 | $ 52,790 |
| Minneapolis-St. Paul-Bloomington, MN-WI | 140 | 0.08 | 0.91 | $ 21.62 | $ 44,960 |
| Atlanta-Sandy Springs-Roswell, GA | 170 | 0.07 | 0.80 | $ 21.30 | $ 44,310 |
| Vineland-Bridgeton, NJ | 40 | 0.71 | 8.41 | $ 20.93 | $ 43,540 |
| Tulsa, OK | 60 | 0.14 | 1.61 | $ 20.79 | $ 43,240 |
| Seattle-Tacoma-Bellevue, WA | 100 | 0.05 | 0.63 | $ 20.68 | $ 43,010 |
| Kansas City, MO-KS | 100 | 0.10 | 1.20 | $ 20.63 | $ 42,900 |
| Philadelphia-Camden-Wilmington, PA-NJ-DE-MD | 120 | 0.05 | 0.54 | $ 20.61 | $ 42,860 |
| Columbus, OH | 50 | 0.05 | 0.56 | $ 20.56 | $ 42,760 |
| San Diego-Carlsbad, CA | 80 | 0.06 | 0.68 | $ 20.34 | $ 42,300 |
Nonmetropolitan areas with the highest employment in Painting, Coating, and Decorating Workers:
| Nonmetropolitan area | Employment (1) | Employment per thousand jobs | Location quotient (9) | Hourly mean wage | Annual mean wage (2) |
|---|---|---|---|---|---|
| West Tennessee nonmetropolitan area | 240 | 1.93 | 22.98 | $ 20.76 | $ 43,180 |
| Northern Indiana nonmetropolitan area | 210 | 1.05 | 12.49 | $ 15.45 | $ 32,140 |
| East South Dakota nonmetropolitan area | 120 | 0.93 | 11.00 | $ 17.76 | $ 36,930 |
| North Northeastern Ohio nonmetropolitan area (noncontiguous) | 70 | 0.21 | 2.55 | $ 17.80 | $ 37,030 |
| Hill Country Region of Texas nonmetropolitan area | 60 | 0.33 | 3.90 | $ 16.85 | $ 35,040 |
Nonmetropolitan areas with the highest concentration of jobs and location quotients in Painting, Coating, and Decorating Workers:
| Nonmetropolitan area | Employment (1) | Employment per thousand jobs | Location quotient (9) | Hourly mean wage | Annual mean wage (2) |
|---|---|---|---|---|---|
| West Tennessee nonmetropolitan area | 240 | 1.93 | 22.98 | $ 20.76 | $ 43,180 |
| Northern Indiana nonmetropolitan area | 210 | 1.05 | 12.49 | $ 15.45 | $ 32,140 |
| East South Dakota nonmetropolitan area | 120 | 0.93 | 11.00 | $ 17.76 | $ 36,930 |
| South Central Tennessee nonmetropolitan area | 40 | 0.42 | 4.97 | $ 18.03 | $ 37,500 |
| Northwest Iowa nonmetropolitan area | 50 | 0.37 | 4.41 | $ 19.61 | $ 40,780 |
Top paying nonmetropolitan areas for Painting, Coating, and Decorating Workers:
| Nonmetropolitan area | Employment (1) | Employment per thousand jobs | Location quotient (9) | Hourly mean wage | Annual mean wage (2) |
|---|---|---|---|---|---|
| West Tennessee nonmetropolitan area | 240 | 1.93 | 22.98 | $ 20.76 | $ 43,180 |
| Northeast Iowa nonmetropolitan area | 30 | 0.35 | 4.14 | $ 19.74 | $ 41,060 |
| Northwest Iowa nonmetropolitan area | 50 | 0.37 | 4.41 | $ 19.61 | $ 40,780 |
| South Nebraska nonmetropolitan area | 50 | 0.36 | 4.29 | $ 18.35 | $ 38,170 |
| Southeast Oklahoma nonmetropolitan area | 50 | 0.31 | 3.70 | $ 18.17 | $ 37,790 |
These estimates are calculated with data collected from employers in all industry sectors, all metropolitan and nonmetropolitan areas, and all states and the District of Columbia. The top employment and wage figures are provided above. The complete list is available in the downloadable XLS files.
The percentile wage estimate is the value of a wage below which a certain percent of workers fall. The median wage is the 50th percentile wage estimate—50 percent of workers earn less than the median and 50 percent of workers earn more than the median. More about percentile wages.
(1) Estimates for detailed occupations do not sum to the totals because the totals include occupations not shown separately. Estimates do not include self-employed workers.
(2) Annual wages have been calculated by multiplying the hourly mean wage by a "year-round, full-time" hours figure of 2,080 hours; for those occupations where there is not an hourly wage published, the annual wage has been directly calculated from the reported survey data.
(3) The relative standard error (RSE) is a measure of the reliability of a survey statistic. The smaller the relative standard error, the more precise the estimate.
(7) The value is less than .005 percent of industry employment.
(8) Estimate not released.
(9) The location quotient is the ratio of the area concentration of occupational employment to the national average concentration. A location quotient greater than one indicates the occupation has a higher share of employment than average, and a location quotient less than one indicates the occupation is less prevalent in the area than average.
Other OEWS estimates and related information:
May 2021 National Occupational Employment and Wage Estimates
May 2021 State Occupational Employment and Wage Estimates
May 2021 Metropolitan and Nonmetropolitan Area Occupational Employment and Wage Estimates
May 2021 National Industry-Specific Occupational Employment and Wage Estimates
Last Modified Date: March 31, 2022