
An official website of the United States government
An official website of the United States government
The .gov means it's official.
Federal government websites often end in .gov or .mil. Before sharing sensitive information,
make sure you're on a federal government site.
The site is secure.
The
https:// ensures that you are connecting to the official website and that any
information you provide is encrypted and transmitted securely.
Operate or tend machines to wash or clean products, such as barrels or kegs, glass items, tin plate, food, pulp, coal, plastic, or rubber, to remove impurities.
Employment estimate and mean wage estimates for Cleaning, Washing, and Metal Pickling Equipment Operators and Tenders:
| Employment (1) | Employment RSE (3) |
Mean hourly wage |
Mean annual wage (2) |
Wage RSE (3) |
|---|---|---|---|---|
| 13,580 | 3.2 % | $ 17.22 | $ 35,820 | 0.8 % |
Percentile wage estimates for Cleaning, Washing, and Metal Pickling Equipment Operators and Tenders:
| Percentile | 10% | 25% | 50% (Median) |
75% | 90% |
|---|---|---|---|---|---|
| Hourly Wage | $ 12.42 | $ 14.06 | $ 16.87 | $ 18.72 | $ 22.76 |
| Annual Wage (2) | $ 25,840 | $ 29,250 | $ 35,090 | $ 38,940 | $ 47,330 |
Industries with the highest published employment and wages for Cleaning, Washing, and Metal Pickling Equipment Operators and Tenders are provided. For a list of all industries with employment in Cleaning, Washing, and Metal Pickling Equipment Operators and Tenders, see the Create Customized Tables function.
Industries with the highest levels of employment in Cleaning, Washing, and Metal Pickling Equipment Operators and Tenders:
| Industry | Employment (1) | Percent of industry employment | Hourly mean wage | Annual mean wage (2) |
|---|---|---|---|---|
| Animal Slaughtering and Processing | 1,710 | 0.33 | $ 14.84 | $ 30,870 |
| Bakeries and Tortilla Manufacturing | 1,290 | 0.44 | $ 16.86 | $ 35,080 |
| Employment Services | 1,030 | 0.03 | $ 13.47 | $ 28,010 |
| Other Food Manufacturing | 760 | 0.32 | $ 18.30 | $ 38,060 |
| Coating, Engraving, Heat Treating, and Allied Activities | 740 | 0.60 | $ 17.69 | $ 36,780 |
Industries with the highest concentration of employment in Cleaning, Washing, and Metal Pickling Equipment Operators and Tenders:
| Industry | Employment (1) | Percent of industry employment | Hourly mean wage | Annual mean wage (2) |
|---|---|---|---|---|
| Coating, Engraving, Heat Treating, and Allied Activities | 740 | 0.60 | $ 17.69 | $ 36,780 |
| Bakeries and Tortilla Manufacturing | 1,290 | 0.44 | $ 16.86 | $ 35,080 |
| Fruit and Vegetable Preserving and Specialty Food Manufacturing | 630 | 0.37 | $ 17.76 | $ 36,940 |
| Animal Slaughtering and Processing | 1,710 | 0.33 | $ 14.84 | $ 30,870 |
| Other Food Manufacturing | 760 | 0.32 | $ 18.30 | $ 38,060 |
Top paying industries for Cleaning, Washing, and Metal Pickling Equipment Operators and Tenders:
| Industry | Employment (1) | Percent of industry employment | Hourly mean wage | Annual mean wage (2) |
|---|---|---|---|---|
| Nonferrous Metal (except Aluminum) Production and Processing | 90 | 0.17 | $ 30.64 | $ 63,740 |
| Pulp, Paper, and Paperboard Mills | 100 | 0.12 | $ 26.38 | $ 54,880 |
| Nonmetallic Mineral Mining and Quarrying | 80 | 0.08 | $ 24.95 | $ 51,900 |
| Sugar and Confectionery Product Manufacturing | 60 | 0.08 | $ 23.46 | $ 48,800 |
| Steel Product Manufacturing from Purchased Steel | 50 | 0.09 | $ 23.15 | $ 48,160 |
States and areas with the highest published employment, location quotients, and wages for Cleaning, Washing, and Metal Pickling Equipment Operators and Tenders are provided. For a list of all areas with employment in Cleaning, Washing, and Metal Pickling Equipment Operators and Tenders, see the Create Customized Tables function.
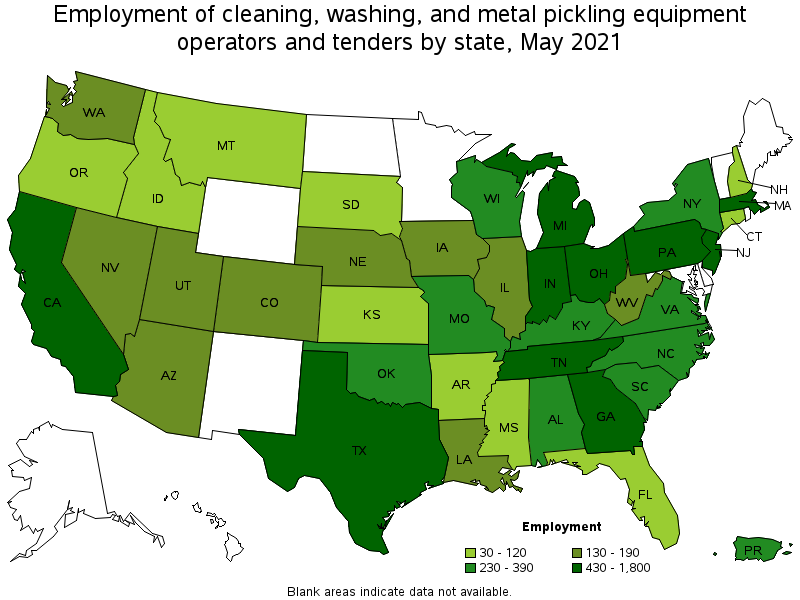
States with the highest employment level in Cleaning, Washing, and Metal Pickling Equipment Operators and Tenders:
| State | Employment (1) | Employment per thousand jobs | Location quotient (9) | Hourly mean wage | Annual mean wage (2) |
|---|---|---|---|---|---|
| California | 1,800 | 0.11 | 1.13 | $ 17.80 | $ 37,020 |
| Texas | 1,370 | 0.11 | 1.17 | $ 14.57 | $ 30,310 |
| Georgia | 830 | 0.19 | 1.96 | $ 15.38 | $ 31,990 |
| Pennsylvania | 820 | 0.15 | 1.52 | $ 20.17 | $ 41,950 |
| Michigan | 810 | 0.20 | 2.07 | $ 16.73 | $ 34,790 |
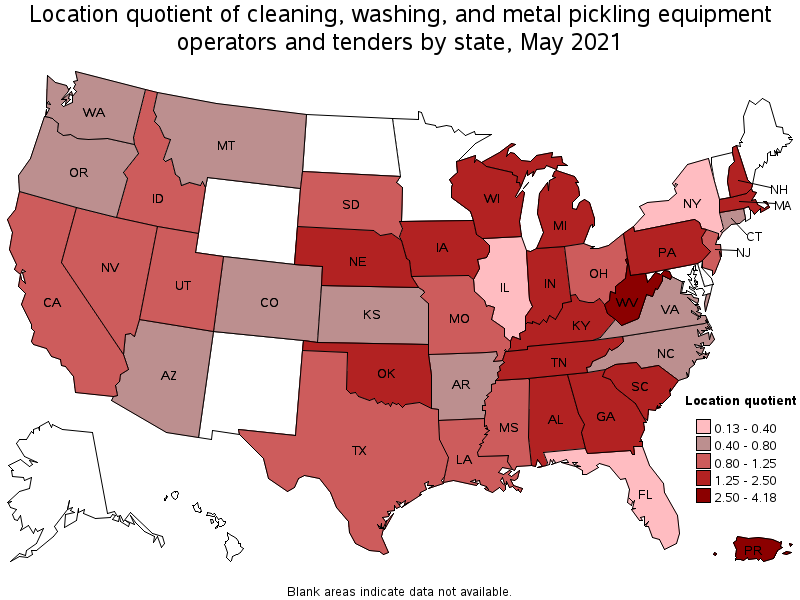
States with the highest concentration of jobs and location quotients in Cleaning, Washing, and Metal Pickling Equipment Operators and Tenders:
| State | Employment (1) | Employment per thousand jobs | Location quotient (9) | Hourly mean wage | Annual mean wage (2) |
|---|---|---|---|---|---|
| West Virginia | 170 | 0.25 | 2.63 | $ 20.20 | $ 42,020 |
| Oklahoma | 330 | 0.21 | 2.19 | $ 14.51 | $ 30,180 |
| Kentucky | 390 | 0.21 | 2.18 | $ 17.43 | $ 36,260 |
| Tennessee | 610 | 0.20 | 2.11 | $ 16.82 | $ 34,990 |
| Michigan | 810 | 0.20 | 2.07 | $ 16.73 | $ 34,790 |
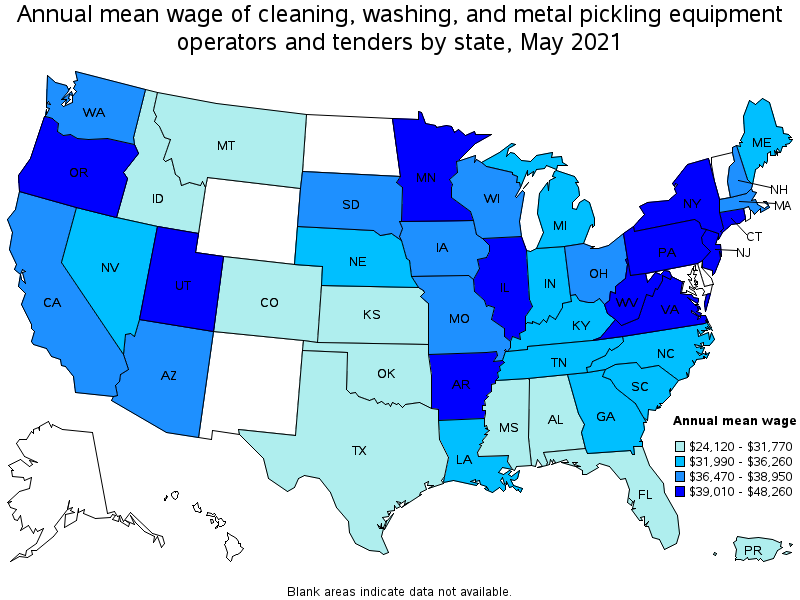
Top paying states for Cleaning, Washing, and Metal Pickling Equipment Operators and Tenders:
| State | Employment (1) | Employment per thousand jobs | Location quotient (9) | Hourly mean wage | Annual mean wage (2) |
|---|---|---|---|---|---|
| Virginia | 230 | 0.06 | 0.65 | $ 23.20 | $ 48,260 |
| Connecticut | 60 | 0.04 | 0.40 | $ 21.35 | $ 44,400 |
| Illinois | 140 | 0.02 | 0.26 | $ 20.86 | $ 43,380 |
| West Virginia | 170 | 0.25 | 2.63 | $ 20.20 | $ 42,020 |
| Pennsylvania | 820 | 0.15 | 1.52 | $ 20.17 | $ 41,950 |
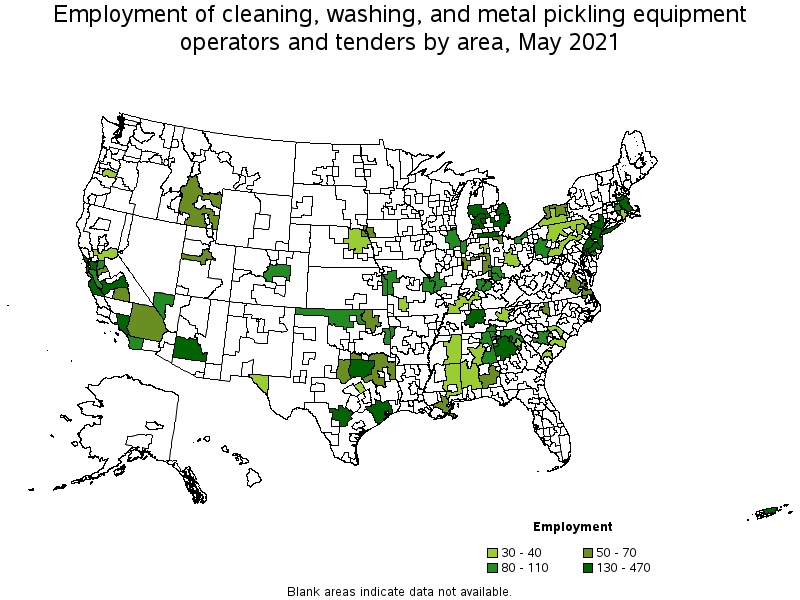
Metropolitan areas with the highest employment level in Cleaning, Washing, and Metal Pickling Equipment Operators and Tenders:
| Metropolitan area | Employment (1) | Employment per thousand jobs | Location quotient (9) | Hourly mean wage | Annual mean wage (2) |
|---|---|---|---|---|---|
| Dallas-Fort Worth-Arlington, TX | 470 | 0.13 | 1.36 | $ 14.59 | $ 30,350 |
| Los Angeles-Long Beach-Anaheim, CA | 430 | 0.07 | 0.78 | $ 17.22 | $ 35,820 |
| New York-Newark-Jersey City, NY-NJ-PA | 380 | 0.04 | 0.46 | $ 19.02 | $ 39,560 |
| Boston-Cambridge-Nashua, MA-NH | 380 | 0.15 | 1.52 | $ 17.61 | $ 36,630 |
| Houston-The Woodlands-Sugar Land, TX | 290 | 0.10 | 1.03 | $ 15.33 | $ 31,880 |
| Atlanta-Sandy Springs-Roswell, GA | 270 | 0.10 | 1.08 | $ 16.44 | $ 34,200 |
| Grand Rapids-Wyoming, MI | 220 | 0.43 | 4.44 | $ 16.91 | $ 35,180 |
| Nashville-Davidson--Murfreesboro--Franklin, TN | 220 | 0.22 | 2.30 | $ 15.49 | $ 32,210 |
| Detroit-Warren-Dearborn, MI | 210 | 0.12 | 1.23 | $ 16.97 | $ 35,290 |
| Salinas, CA | 180 | 1.07 | 11.10 | $ 15.76 | $ 32,780 |
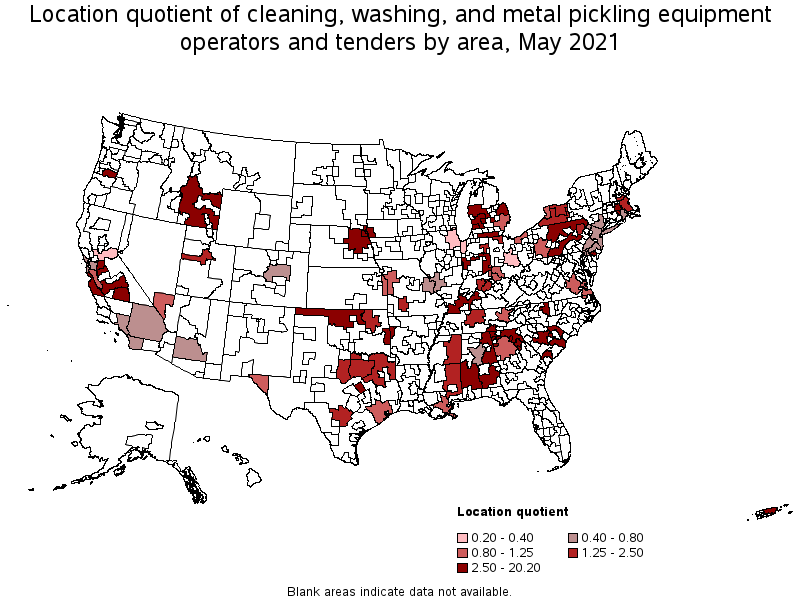
Metropolitan areas with the highest concentration of jobs and location quotients in Cleaning, Washing, and Metal Pickling Equipment Operators and Tenders:
| Metropolitan area | Employment (1) | Employment per thousand jobs | Location quotient (9) | Hourly mean wage | Annual mean wage (2) |
|---|---|---|---|---|---|
| Gainesville, GA | 170 | 1.95 | 20.20 | $ 14.05 | $ 29,220 |
| Vineland-Bridgeton, NJ | 80 | 1.31 | 13.61 | $ 20.76 | $ 43,170 |
| Fort Smith, AR-OK | 110 | 1.07 | 11.11 | $ 14.42 | $ 29,990 |
| Salinas, CA | 180 | 1.07 | 11.10 | $ 15.76 | $ 32,780 |
| Sioux City, IA-NE-SD | 70 | 0.84 | 8.76 | $ 19.62 | $ 40,800 |
| Albany, OR | 40 | 0.84 | 8.69 | $ 24.25 | $ 50,430 |
| Santa Cruz-Watsonville, CA | 50 | 0.50 | 5.19 | $ 18.05 | $ 37,540 |
| Stockton-Lodi, CA | 110 | 0.43 | 4.51 | $ 16.43 | $ 34,170 |
| Grand Rapids-Wyoming, MI | 220 | 0.43 | 4.44 | $ 16.91 | $ 35,180 |
| Athens-Clarke County, GA | 40 | 0.42 | 4.33 | $ 13.55 | $ 28,190 |
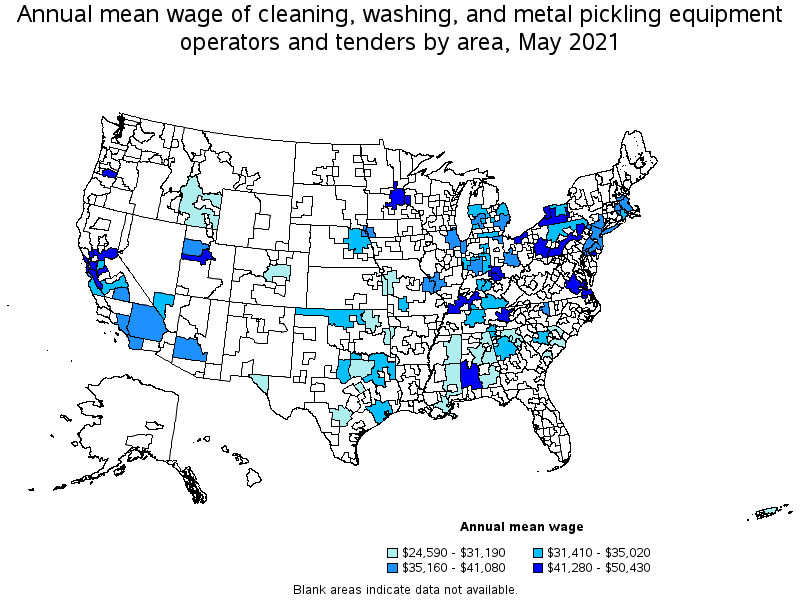
Top paying metropolitan areas for Cleaning, Washing, and Metal Pickling Equipment Operators and Tenders:
| Metropolitan area | Employment (1) | Employment per thousand jobs | Location quotient (9) | Hourly mean wage | Annual mean wage (2) |
|---|---|---|---|---|---|
| Albany, OR | 40 | 0.84 | 8.69 | $ 24.25 | $ 50,430 |
| Pittsburgh, PA | 100 | 0.09 | 0.96 | $ 23.56 | $ 49,010 |
| Richmond, VA | 60 | 0.10 | 0.99 | $ 22.37 | $ 46,530 |
| Minneapolis-St. Paul-Bloomington, MN-WI | (8) | (8) | (8) | $ 21.51 | $ 44,750 |
| San Francisco-Oakland-Hayward, CA | 160 | 0.07 | 0.73 | $ 21.29 | $ 44,280 |
| Scranton--Wilkes-Barre--Hazleton, PA | 40 | 0.15 | 1.54 | $ 20.88 | $ 43,420 |
| Buffalo-Cheektowaga-Niagara Falls, NY | 60 | 0.11 | 1.17 | $ 20.76 | $ 43,190 |
| Provo-Orem, UT | 50 | 0.19 | 1.94 | $ 20.77 | $ 43,190 |
| Vineland-Bridgeton, NJ | 80 | 1.31 | 13.61 | $ 20.76 | $ 43,170 |
| Knoxville, TN | 30 | 0.09 | 0.93 | $ 20.60 | $ 42,850 |
Nonmetropolitan areas with the highest employment in Cleaning, Washing, and Metal Pickling Equipment Operators and Tenders:
| Nonmetropolitan area | Employment (1) | Employment per thousand jobs | Location quotient (9) | Hourly mean wage | Annual mean wage (2) |
|---|---|---|---|---|---|
| Balance of Lower Peninsula of Michigan nonmetropolitan area | 130 | 0.52 | 5.40 | $ 16.70 | $ 34,730 |
| North Georgia nonmetropolitan area | 110 | 0.62 | 6.44 | $ 14.55 | $ 30,260 |
| Northwest Oklahoma nonmetropolitan area | 80 | 0.89 | 9.27 | $ 16.53 | $ 34,390 |
| Northeast Alabama nonmetropolitan area | 80 | 0.57 | 5.96 | $ 14.26 | $ 29,670 |
| Southeast Alabama nonmetropolitan area | 70 | 0.79 | 8.21 | $ 12.57 | $ 26,150 |
Nonmetropolitan areas with the highest concentration of jobs and location quotients in Cleaning, Washing, and Metal Pickling Equipment Operators and Tenders:
| Nonmetropolitan area | Employment (1) | Employment per thousand jobs | Location quotient (9) | Hourly mean wage | Annual mean wage (2) |
|---|---|---|---|---|---|
| Northwest Oklahoma nonmetropolitan area | 80 | 0.89 | 9.27 | $ 16.53 | $ 34,390 |
| Southeast Alabama nonmetropolitan area | 70 | 0.79 | 8.21 | $ 12.57 | $ 26,150 |
| Southwest Alabama nonmetropolitan area | 40 | 0.63 | 6.56 | $ 23.37 | $ 48,610 |
| North Georgia nonmetropolitan area | 110 | 0.62 | 6.44 | $ 14.55 | $ 30,260 |
| Southeast-Central Idaho nonmetropolitan area | 50 | 0.60 | 6.19 | $ 14.01 | $ 29,150 |
Top paying nonmetropolitan areas for Cleaning, Washing, and Metal Pickling Equipment Operators and Tenders:
| Nonmetropolitan area | Employment (1) | Employment per thousand jobs | Location quotient (9) | Hourly mean wage | Annual mean wage (2) |
|---|---|---|---|---|---|
| Southwest Alabama nonmetropolitan area | 40 | 0.63 | 6.56 | $ 23.37 | $ 48,610 |
| West Kentucky nonmetropolitan area | 40 | 0.27 | 2.77 | $ 21.61 | $ 44,950 |
| Southwest New York nonmetropolitan area | 40 | 0.22 | 2.31 | $ 20.78 | $ 43,220 |
| Southern Pennsylvania nonmetropolitan area | 40 | 0.24 | 2.52 | $ 20.24 | $ 42,090 |
| Northern Pennsylvania nonmetropolitan area | 40 | 0.27 | 2.79 | $ 16.84 | $ 35,020 |
These estimates are calculated with data collected from employers in all industry sectors, all metropolitan and nonmetropolitan areas, and all states and the District of Columbia. The top employment and wage figures are provided above. The complete list is available in the downloadable XLS files.
The percentile wage estimate is the value of a wage below which a certain percent of workers fall. The median wage is the 50th percentile wage estimate—50 percent of workers earn less than the median and 50 percent of workers earn more than the median. More about percentile wages.
(1) Estimates for detailed occupations do not sum to the totals because the totals include occupations not shown separately. Estimates do not include self-employed workers.
(2) Annual wages have been calculated by multiplying the hourly mean wage by a "year-round, full-time" hours figure of 2,080 hours; for those occupations where there is not an hourly wage published, the annual wage has been directly calculated from the reported survey data.
(3) The relative standard error (RSE) is a measure of the reliability of a survey statistic. The smaller the relative standard error, the more precise the estimate.
(8) Estimate not released.
(9) The location quotient is the ratio of the area concentration of occupational employment to the national average concentration. A location quotient greater than one indicates the occupation has a higher share of employment than average, and a location quotient less than one indicates the occupation is less prevalent in the area than average.
Other OEWS estimates and related information:
May 2021 National Occupational Employment and Wage Estimates
May 2021 State Occupational Employment and Wage Estimates
May 2021 Metropolitan and Nonmetropolitan Area Occupational Employment and Wage Estimates
May 2021 National Industry-Specific Occupational Employment and Wage Estimates
Last Modified Date: March 31, 2022