
An official website of the United States government
An official website of the United States government
The .gov means it's official.
Federal government websites often end in .gov or .mil. Before sharing sensitive information,
make sure you're on a federal government site.
The site is secure.
The
https:// ensures that you are connecting to the official website and that any
information you provide is encrypted and transmitted securely.
Mold, shape, form, cast, or carve products such as food products, figurines, tile, pipes, and candles consisting of clay, glass, plaster, concrete, stone, or combinations of materials.
Employment estimate and mean wage estimates for Molders, Shapers, and Casters, Except Metal and Plastic:
| Employment (1) | Employment RSE (3) |
Mean hourly wage |
Mean annual wage (2) |
Wage RSE (3) |
|---|---|---|---|---|
| 38,420 | 2.7 % | $ 18.76 | $ 39,020 | 0.6 % |
Percentile wage estimates for Molders, Shapers, and Casters, Except Metal and Plastic:
| Percentile | 10% | 25% | 50% (Median) |
75% | 90% |
|---|---|---|---|---|---|
| Hourly Wage | $ 13.86 | $ 14.55 | $ 18.03 | $ 22.22 | $ 24.76 |
| Annual Wage (2) | $ 28,820 | $ 30,270 | $ 37,500 | $ 46,210 | $ 51,500 |
Industries with the highest published employment and wages for Molders, Shapers, and Casters, Except Metal and Plastic are provided. For a list of all industries with employment in Molders, Shapers, and Casters, Except Metal and Plastic, see the Create Customized Tables function.
Industries with the highest levels of employment in Molders, Shapers, and Casters, Except Metal and Plastic:
| Industry | Employment (1) | Percent of industry employment | Hourly mean wage | Annual mean wage (2) |
|---|---|---|---|---|
| Nonmetallic Mineral Product Manufacturing | 23,280 | 5.83 | $ 18.84 | $ 39,180 |
| Rubber Product Manufacturing | 2,030 | 1.58 | $ 19.74 | $ 41,060 |
| Building Finishing Contractors | 1,880 | 0.23 | $ 20.53 | $ 42,710 |
| Other Miscellaneous Manufacturing | 1,530 | 0.56 | $ 17.55 | $ 36,510 |
| Employment Services | 1,120 | 0.03 | $ 14.50 | $ 30,170 |
Industries with the highest concentration of employment in Molders, Shapers, and Casters, Except Metal and Plastic:
| Industry | Employment (1) | Percent of industry employment | Hourly mean wage | Annual mean wage (2) |
|---|---|---|---|---|
| Nonmetallic Mineral Product Manufacturing | 23,280 | 5.83 | $ 18.84 | $ 39,180 |
| Rubber Product Manufacturing | 2,030 | 1.58 | $ 19.74 | $ 41,060 |
| Other Miscellaneous Manufacturing | 1,530 | 0.56 | $ 17.55 | $ 36,510 |
| Medical Equipment and Supplies Manufacturing | 980 | 0.31 | $ 17.81 | $ 37,050 |
| Other Miscellaneous Store Retailers | 1,000 | 0.27 | $ 18.14 | $ 37,730 |
Top paying industries for Molders, Shapers, and Casters, Except Metal and Plastic:
| Industry | Employment (1) | Percent of industry employment | Hourly mean wage | Annual mean wage (2) |
|---|---|---|---|---|
| Federal Executive Branch (OEWS Designation) | 70 | (7) | $ 27.74 | $ 57,690 |
| Semiconductor and Other Electronic Component Manufacturing | 120 | 0.03 | $ 26.04 | $ 54,160 |
| Management of Companies and Enterprises | (8) | (8) | $ 25.89 | $ 53,860 |
| Chemical Manufacturing (3251, 3252, 3253, and 3259 only) | 80 | 0.02 | $ 22.92 | $ 47,670 |
| Fabricated Metal Product Manufacturing (3323 and 3324 only) | 60 | 0.01 | $ 21.94 | $ 45,640 |
States and areas with the highest published employment, location quotients, and wages for Molders, Shapers, and Casters, Except Metal and Plastic are provided. For a list of all areas with employment in Molders, Shapers, and Casters, Except Metal and Plastic, see the Create Customized Tables function.
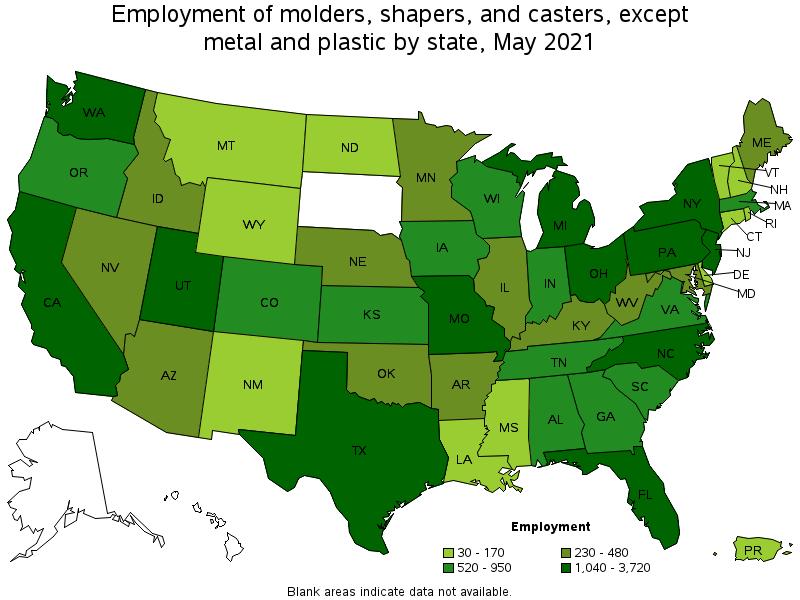
States with the highest employment level in Molders, Shapers, and Casters, Except Metal and Plastic:
| State | Employment (1) | Employment per thousand jobs | Location quotient (9) | Hourly mean wage | Annual mean wage (2) |
|---|---|---|---|---|---|
| California | 3,720 | 0.23 | 0.83 | $ 21.41 | $ 44,530 |
| Texas | 3,000 | 0.25 | 0.90 | $ 16.66 | $ 34,650 |
| Ohio | 2,830 | 0.54 | 1.99 | $ 18.77 | $ 39,040 |
| Pennsylvania | 2,470 | 0.44 | 1.62 | $ 19.27 | $ 40,080 |
| Michigan | 2,320 | 0.57 | 2.10 | $ 18.17 | $ 37,790 |
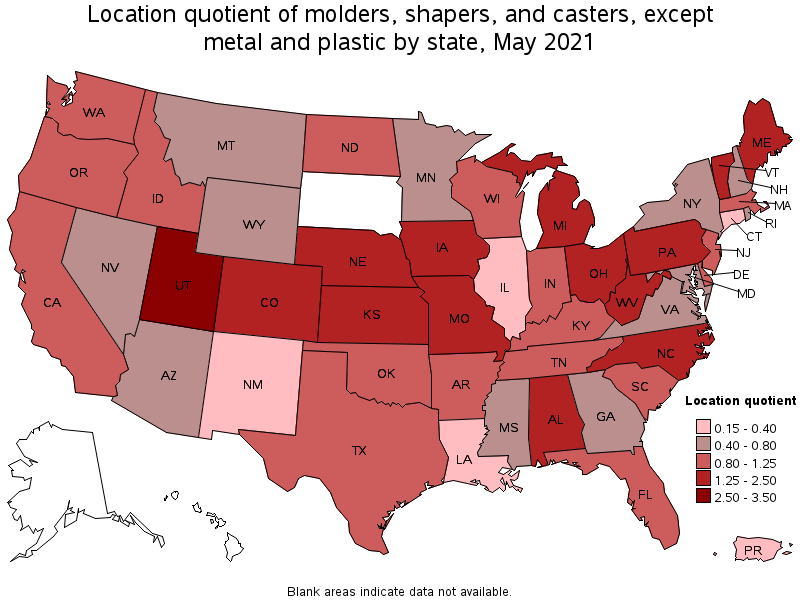
States with the highest concentration of jobs and location quotients in Molders, Shapers, and Casters, Except Metal and Plastic:
| State | Employment (1) | Employment per thousand jobs | Location quotient (9) | Hourly mean wage | Annual mean wage (2) |
|---|---|---|---|---|---|
| Utah | 1,450 | 0.93 | 3.41 | $ 18.65 | $ 38,790 |
| Vermont | 170 | 0.59 | 2.15 | $ 21.22 | $ 44,140 |
| Michigan | 2,320 | 0.57 | 2.10 | $ 18.17 | $ 37,790 |
| Missouri | 1,500 | 0.55 | 2.01 | $ 19.45 | $ 40,460 |
| Ohio | 2,830 | 0.54 | 1.99 | $ 18.77 | $ 39,040 |
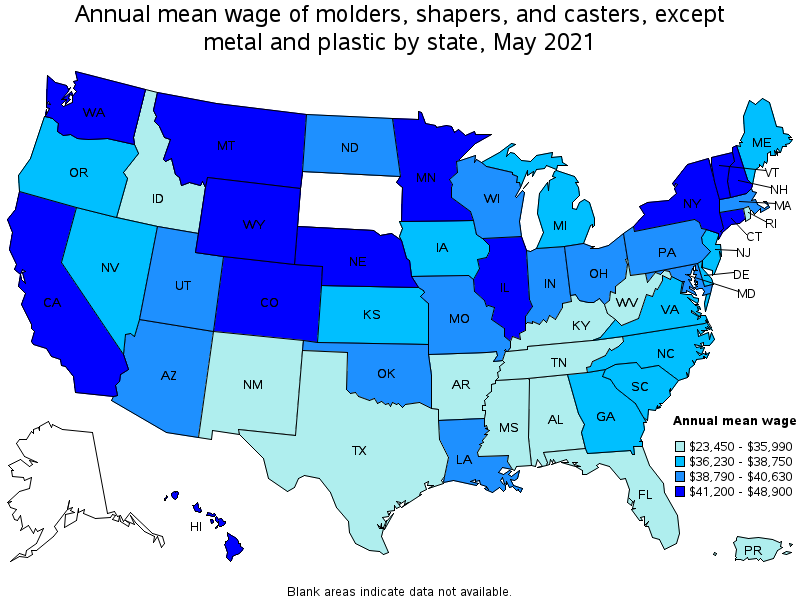
Top paying states for Molders, Shapers, and Casters, Except Metal and Plastic:
| State | Employment (1) | Employment per thousand jobs | Location quotient (9) | Hourly mean wage | Annual mean wage (2) |
|---|---|---|---|---|---|
| Hawaii | (8) | (8) | (8) | $ 23.51 | $ 48,900 |
| Nebraska | 330 | 0.35 | 1.27 | $ 22.26 | $ 46,310 |
| Montana | 60 | 0.12 | 0.46 | $ 21.62 | $ 44,970 |
| California | 3,720 | 0.23 | 0.83 | $ 21.41 | $ 44,530 |
| Connecticut | 150 | 0.09 | 0.35 | $ 21.35 | $ 44,400 |
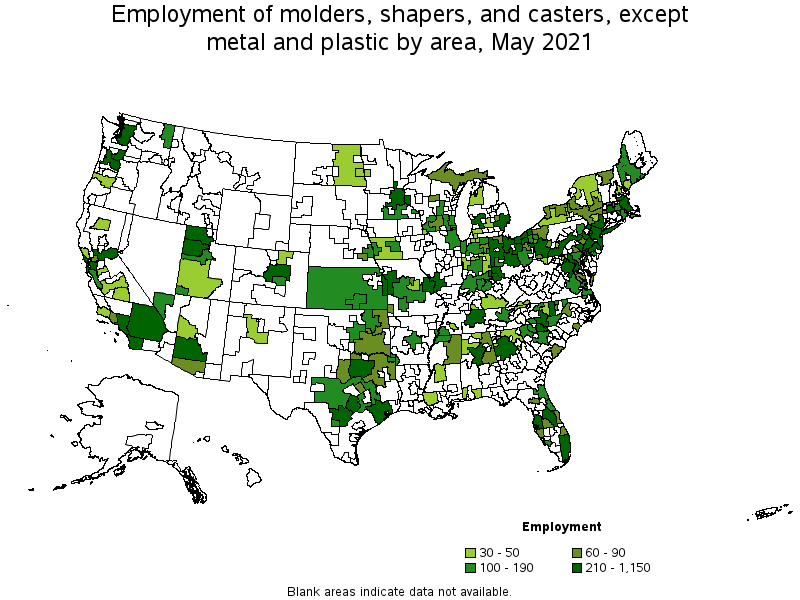
Metropolitan areas with the highest employment level in Molders, Shapers, and Casters, Except Metal and Plastic:
| Metropolitan area | Employment (1) | Employment per thousand jobs | Location quotient (9) | Hourly mean wage | Annual mean wage (2) |
|---|---|---|---|---|---|
| New York-Newark-Jersey City, NY-NJ-PA | 1,150 | 0.13 | 0.49 | $ 19.28 | $ 40,090 |
| Los Angeles-Long Beach-Anaheim, CA | 1,040 | 0.18 | 0.67 | $ 21.07 | $ 43,820 |
| Detroit-Warren-Dearborn, MI | 880 | 0.49 | 1.79 | $ 18.78 | $ 39,060 |
| Dallas-Fort Worth-Arlington, TX | 880 | 0.24 | 0.90 | $ 16.98 | $ 35,320 |
| Houston-The Woodlands-Sugar Land, TX | 720 | 0.25 | 0.91 | $ 17.42 | $ 36,230 |
| Riverside-San Bernardino-Ontario, CA | 720 | 0.47 | 1.72 | $ 20.21 | $ 42,040 |
| Ogden-Clearfield, UT | 680 | 2.54 | 9.31 | $ 17.86 | $ 37,150 |
| Seattle-Tacoma-Bellevue, WA | 650 | 0.34 | 1.24 | $ 22.42 | $ 46,630 |
| Philadelphia-Camden-Wilmington, PA-NJ-DE-MD | 640 | 0.24 | 0.89 | $ 20.50 | $ 42,640 |
| Denver-Aurora-Lakewood, CO | 580 | 0.40 | 1.46 | $ 20.93 | $ 43,530 |
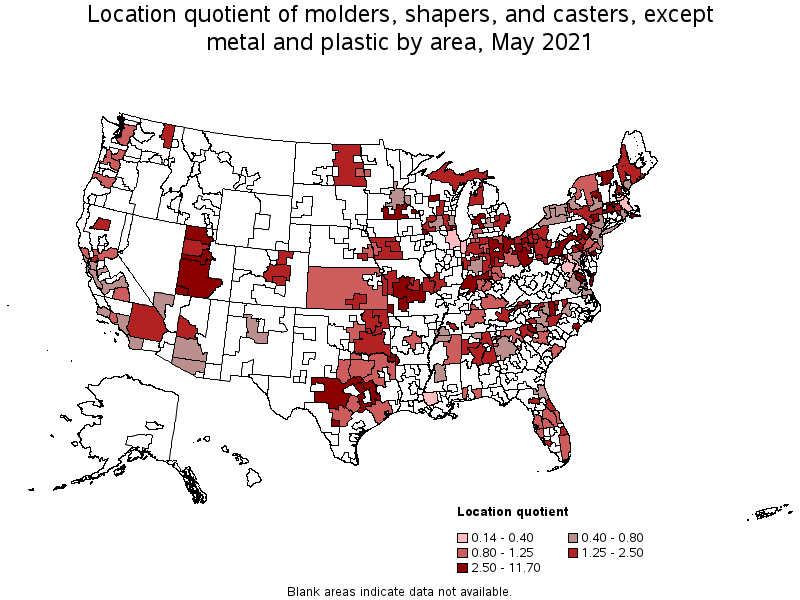
Metropolitan areas with the highest concentration of jobs and location quotients in Molders, Shapers, and Casters, Except Metal and Plastic:
| Metropolitan area | Employment (1) | Employment per thousand jobs | Location quotient (9) | Hourly mean wage | Annual mean wage (2) |
|---|---|---|---|---|---|
| Vineland-Bridgeton, NJ | 190 | 3.19 | 11.70 | $ 19.87 | $ 41,330 |
| Ogden-Clearfield, UT | 680 | 2.54 | 9.31 | $ 17.86 | $ 37,150 |
| Texarkana, TX-AR | 100 | 1.87 | 6.86 | $ 22.45 | $ 46,690 |
| St. George, UT | 110 | 1.51 | 5.55 | $ 18.65 | $ 38,790 |
| Racine, WI | 100 | 1.42 | 5.21 | $ 19.30 | $ 40,150 |
| Wausau, WI | 90 | 1.36 | 4.97 | $ 20.23 | $ 42,080 |
| Grand Rapids-Wyoming, MI | 580 | 1.15 | 4.21 | $ 17.33 | $ 36,040 |
| Burlington, NC | 70 | 1.11 | 4.08 | $ 16.27 | $ 33,840 |
| Joplin, MO | 70 | 0.97 | 3.56 | $ 18.03 | $ 37,510 |
| Lancaster, PA | 230 | 0.96 | 3.53 | $ 19.91 | $ 41,410 |
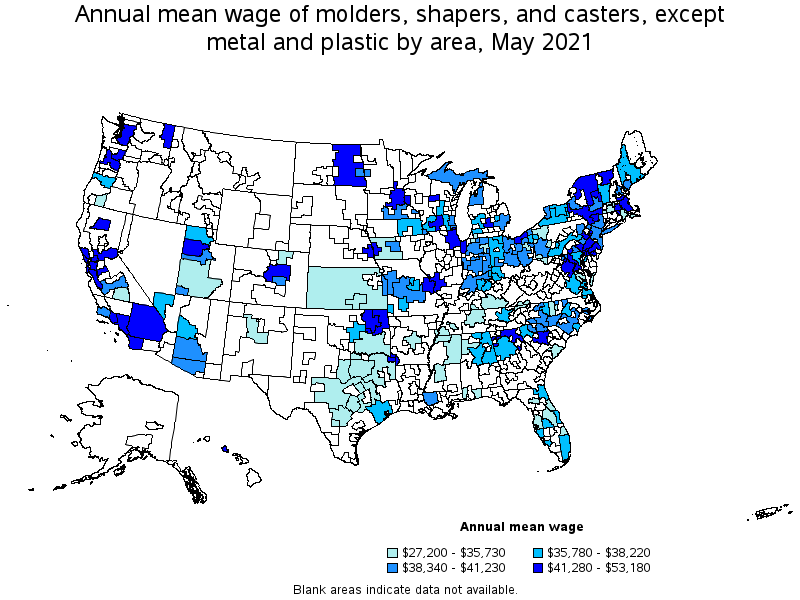
Top paying metropolitan areas for Molders, Shapers, and Casters, Except Metal and Plastic:
| Metropolitan area | Employment (1) | Employment per thousand jobs | Location quotient (9) | Hourly mean wage | Annual mean wage (2) |
|---|---|---|---|---|---|
| San Francisco-Oakland-Hayward, CA | 470 | 0.21 | 0.76 | $ 25.57 | $ 53,180 |
| San Jose-Sunnyvale-Santa Clara, CA | 140 | 0.13 | 0.47 | $ 25.41 | $ 52,850 |
| Urban Honolulu, HI | (8) | (8) | (8) | $ 23.21 | $ 48,290 |
| Santa Rosa, CA | 50 | 0.27 | 0.97 | $ 23.20 | $ 48,250 |
| Chicago-Naperville-Elgin, IL-IN-WI | 160 | 0.04 | 0.14 | $ 22.76 | $ 47,330 |
| Texarkana, TX-AR | 100 | 1.87 | 6.86 | $ 22.45 | $ 46,690 |
| Seattle-Tacoma-Bellevue, WA | 650 | 0.34 | 1.24 | $ 22.42 | $ 46,630 |
| Worcester, MA-CT | 170 | 0.64 | 2.35 | $ 22.27 | $ 46,320 |
| Washington-Arlington-Alexandria, DC-VA-MD-WV | 300 | 0.10 | 0.37 | $ 22.24 | $ 46,250 |
| Minneapolis-St. Paul-Bloomington, MN-WI | 250 | 0.14 | 0.51 | $ 21.88 | $ 45,520 |
Nonmetropolitan areas with the highest employment in Molders, Shapers, and Casters, Except Metal and Plastic:
| Nonmetropolitan area | Employment (1) | Employment per thousand jobs | Location quotient (9) | Hourly mean wage | Annual mean wage (2) |
|---|---|---|---|---|---|
| North Northeastern Ohio nonmetropolitan area (noncontiguous) | 820 | 2.62 | 9.62 | $ 19.54 | $ 40,640 |
| Southern Pennsylvania nonmetropolitan area | 210 | 1.16 | 4.27 | $ 17.33 | $ 36,050 |
| West Northwestern Ohio nonmetropolitan area | 210 | 0.87 | 3.18 | $ 17.99 | $ 37,410 |
| Central Missouri nonmetropolitan area | 150 | 1.01 | 3.69 | $ 19.35 | $ 40,250 |
| Hill Country Region of Texas nonmetropolitan area | 150 | 0.79 | 2.91 | $ 16.58 | $ 34,490 |
Nonmetropolitan areas with the highest concentration of jobs and location quotients in Molders, Shapers, and Casters, Except Metal and Plastic:
| Nonmetropolitan area | Employment (1) | Employment per thousand jobs | Location quotient (9) | Hourly mean wage | Annual mean wage (2) |
|---|---|---|---|---|---|
| North Northeastern Ohio nonmetropolitan area (noncontiguous) | 820 | 2.62 | 9.62 | $ 19.54 | $ 40,640 |
| Northeast Virginia nonmetropolitan area | 60 | 1.19 | 4.35 | $ 17.18 | $ 35,730 |
| Southern Pennsylvania nonmetropolitan area | 210 | 1.16 | 4.27 | $ 17.33 | $ 36,050 |
| Eastern Ohio nonmetropolitan area | 130 | 1.02 | 3.74 | $ 19.15 | $ 39,820 |
| Central Missouri nonmetropolitan area | 150 | 1.01 | 3.69 | $ 19.35 | $ 40,250 |
Top paying nonmetropolitan areas for Molders, Shapers, and Casters, Except Metal and Plastic:
| Nonmetropolitan area | Employment (1) | Employment per thousand jobs | Location quotient (9) | Hourly mean wage | Annual mean wage (2) |
|---|---|---|---|---|---|
| Northern Vermont nonmetropolitan area | 60 | 0.95 | 3.49 | $ 25.30 | $ 52,620 |
| Northeast Oklahoma nonmetropolitan area | 60 | 0.55 | 2.03 | $ 25.14 | $ 52,290 |
| North Georgia nonmetropolitan area | 50 | 0.28 | 1.04 | $ 21.89 | $ 45,540 |
| Central East New York nonmetropolitan area | 70 | 0.44 | 1.61 | $ 21.36 | $ 44,420 |
| Capital/Northern New York nonmetropolitan area | 30 | 0.26 | 0.94 | $ 20.25 | $ 42,110 |
These estimates are calculated with data collected from employers in all industry sectors, all metropolitan and nonmetropolitan areas, and all states and the District of Columbia. The top employment and wage figures are provided above. The complete list is available in the downloadable XLS files.
The percentile wage estimate is the value of a wage below which a certain percent of workers fall. The median wage is the 50th percentile wage estimate—50 percent of workers earn less than the median and 50 percent of workers earn more than the median. More about percentile wages.
(1) Estimates for detailed occupations do not sum to the totals because the totals include occupations not shown separately. Estimates do not include self-employed workers.
(2) Annual wages have been calculated by multiplying the hourly mean wage by a "year-round, full-time" hours figure of 2,080 hours; for those occupations where there is not an hourly wage published, the annual wage has been directly calculated from the reported survey data.
(3) The relative standard error (RSE) is a measure of the reliability of a survey statistic. The smaller the relative standard error, the more precise the estimate.
(7) The value is less than .005 percent of industry employment.
(8) Estimate not released.
(9) The location quotient is the ratio of the area concentration of occupational employment to the national average concentration. A location quotient greater than one indicates the occupation has a higher share of employment than average, and a location quotient less than one indicates the occupation is less prevalent in the area than average.
Other OEWS estimates and related information:
May 2021 National Occupational Employment and Wage Estimates
May 2021 State Occupational Employment and Wage Estimates
May 2021 Metropolitan and Nonmetropolitan Area Occupational Employment and Wage Estimates
May 2021 National Industry-Specific Occupational Employment and Wage Estimates
Last Modified Date: March 31, 2022