
An official website of the United States government
An official website of the United States government
The .gov means it's official.
Federal government websites often end in .gov or .mil. Before sharing sensitive information,
make sure you're on a federal government site.
The site is secure.
The
https:// ensures that you are connecting to the official website and that any
information you provide is encrypted and transmitted securely.
Set up, operate, or tend paper goods machines that perform a variety of functions, such as converting, sawing, corrugating, banding, wrapping, boxing, stitching, forming, or sealing paper or paperboard sheets into products.
Employment estimate and mean wage estimates for Paper Goods Machine Setters, Operators, and Tenders:
| Employment (1) | Employment RSE (3) |
Mean hourly wage |
Mean annual wage (2) |
Wage RSE (3) |
|---|---|---|---|---|
| 87,480 | 1.7 % | $ 21.24 | $ 44,180 | 0.5 % |
Percentile wage estimates for Paper Goods Machine Setters, Operators, and Tenders:
| Percentile | 10% | 25% | 50% (Median) |
75% | 90% |
|---|---|---|---|---|---|
| Hourly Wage | $ 14.17 | $ 17.50 | $ 21.55 | $ 23.39 | $ 29.51 |
| Annual Wage (2) | $ 29,480 | $ 36,390 | $ 44,820 | $ 48,640 | $ 61,380 |
Industries with the highest published employment and wages for Paper Goods Machine Setters, Operators, and Tenders are provided. For a list of all industries with employment in Paper Goods Machine Setters, Operators, and Tenders, see the Create Customized Tables function.
Industries with the highest levels of employment in Paper Goods Machine Setters, Operators, and Tenders:
| Industry | Employment (1) | Percent of industry employment | Hourly mean wage | Annual mean wage (2) |
|---|---|---|---|---|
| Converted Paper Product Manufacturing | 54,880 | 21.02 | $ 20.03 | $ 41,660 |
| Pulp, Paper, and Paperboard Mills | 21,580 | 24.67 | $ 26.45 | $ 55,010 |
| Printing and Related Support Activities | 3,020 | 0.82 | $ 19.43 | $ 40,400 |
| Employment Services | 2,710 | 0.08 | $ 13.18 | $ 27,420 |
| Merchant Wholesalers, Nondurable Goods (4241, 4247, and 4249 only) | 1,770 | 0.34 | $ 20.26 | $ 42,130 |
Industries with the highest concentration of employment in Paper Goods Machine Setters, Operators, and Tenders:
| Industry | Employment (1) | Percent of industry employment | Hourly mean wage | Annual mean wage (2) |
|---|---|---|---|---|
| Pulp, Paper, and Paperboard Mills | 21,580 | 24.67 | $ 26.45 | $ 55,010 |
| Converted Paper Product Manufacturing | 54,880 | 21.02 | $ 20.03 | $ 41,660 |
| Printing and Related Support Activities | 3,020 | 0.82 | $ 19.43 | $ 40,400 |
| Merchant Wholesalers, Nondurable Goods (4241, 4247, and 4249 only) | 1,770 | 0.34 | $ 20.26 | $ 42,130 |
| Plastics Product Manufacturing | 810 | 0.14 | $ 16.31 | $ 33,930 |
Top paying industries for Paper Goods Machine Setters, Operators, and Tenders:
| Industry | Employment (1) | Percent of industry employment | Hourly mean wage | Annual mean wage (2) |
|---|---|---|---|---|
| Pulp, Paper, and Paperboard Mills | 21,580 | 24.67 | $ 26.45 | $ 55,010 |
| Dairy Product Manufacturing | 50 | 0.03 | $ 23.00 | $ 47,840 |
| Other Wood Product Manufacturing | 80 | 0.03 | $ 20.54 | $ 42,720 |
| Merchant Wholesalers, Nondurable Goods (4241, 4247, and 4249 only) | 1,770 | 0.34 | $ 20.26 | $ 42,130 |
| Converted Paper Product Manufacturing | 54,880 | 21.02 | $ 20.03 | $ 41,660 |
States and areas with the highest published employment, location quotients, and wages for Paper Goods Machine Setters, Operators, and Tenders are provided. For a list of all areas with employment in Paper Goods Machine Setters, Operators, and Tenders, see the Create Customized Tables function.
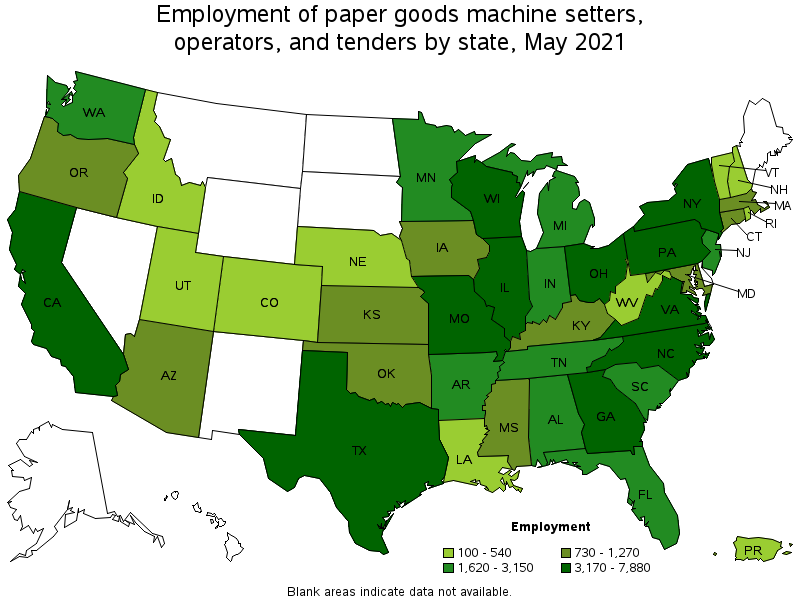
States with the highest employment level in Paper Goods Machine Setters, Operators, and Tenders:
| State | Employment (1) | Employment per thousand jobs | Location quotient (9) | Hourly mean wage | Annual mean wage (2) |
|---|---|---|---|---|---|
| Wisconsin | 7,880 | 2.86 | 4.60 | $ 22.92 | $ 47,670 |
| Pennsylvania | 6,010 | 1.08 | 1.73 | $ 20.83 | $ 43,330 |
| Ohio | 5,980 | 1.15 | 1.85 | $ 19.73 | $ 41,050 |
| North Carolina | 4,760 | 1.08 | 1.74 | $ 19.39 | $ 40,340 |
| Texas | 4,410 | 0.36 | 0.58 | $ 18.30 | $ 38,070 |
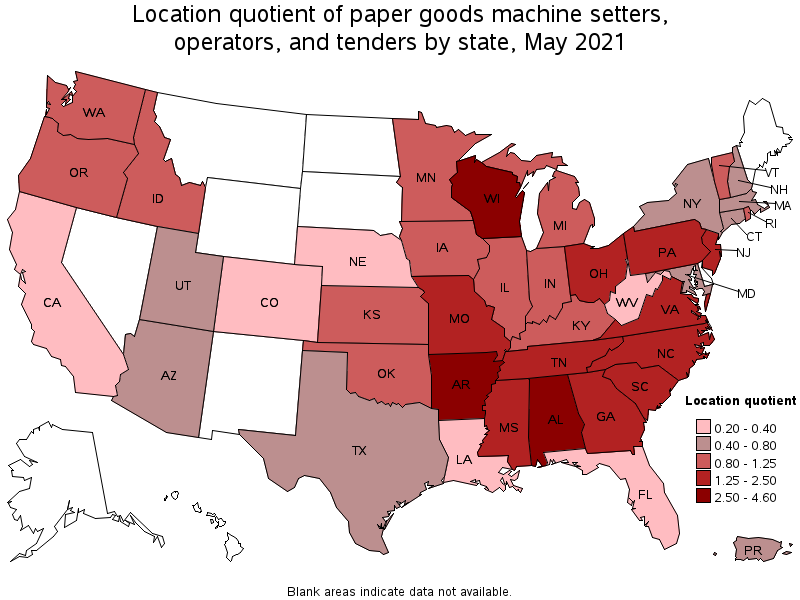
States with the highest concentration of jobs and location quotients in Paper Goods Machine Setters, Operators, and Tenders:
| State | Employment (1) | Employment per thousand jobs | Location quotient (9) | Hourly mean wage | Annual mean wage (2) |
|---|---|---|---|---|---|
| Wisconsin | 7,880 | 2.86 | 4.60 | $ 22.92 | $ 47,670 |
| Arkansas | 2,590 | 2.17 | 3.50 | $ 21.14 | $ 43,960 |
| Alabama | 3,150 | 1.64 | 2.63 | $ 24.58 | $ 51,130 |
| South Carolina | 2,610 | 1.26 | 2.03 | $ 24.94 | $ 51,870 |
| Missouri | 3,270 | 1.20 | 1.93 | $ 20.52 | $ 42,670 |
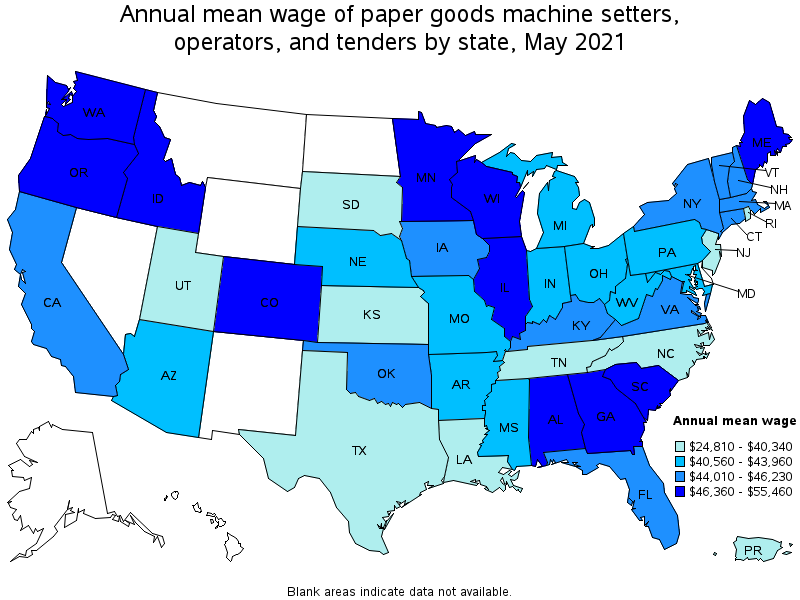
Top paying states for Paper Goods Machine Setters, Operators, and Tenders:
| State | Employment (1) | Employment per thousand jobs | Location quotient (9) | Hourly mean wage | Annual mean wage (2) |
|---|---|---|---|---|---|
| Washington | 1,630 | 0.51 | 0.82 | $ 26.66 | $ 55,460 |
| Oregon | 1,220 | 0.67 | 1.08 | $ 25.06 | $ 52,120 |
| South Carolina | 2,610 | 1.26 | 2.03 | $ 24.94 | $ 51,870 |
| Alabama | 3,150 | 1.64 | 2.63 | $ 24.58 | $ 51,130 |
| Idaho | 410 | 0.54 | 0.87 | $ 23.82 | $ 49,540 |
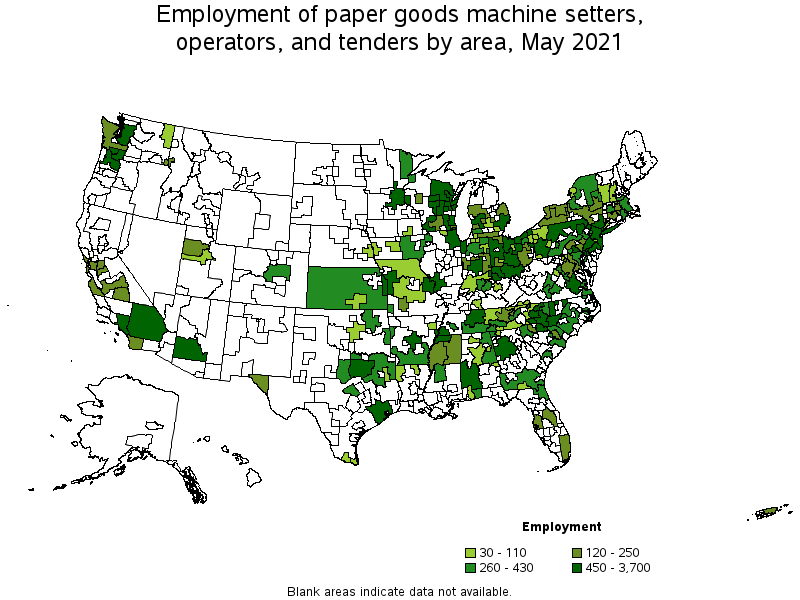
Metropolitan areas with the highest employment level in Paper Goods Machine Setters, Operators, and Tenders:
| Metropolitan area | Employment (1) | Employment per thousand jobs | Location quotient (9) | Hourly mean wage | Annual mean wage (2) |
|---|---|---|---|---|---|
| Chicago-Naperville-Elgin, IL-IN-WI | 3,700 | 0.87 | 1.41 | $ 22.81 | $ 47,440 |
| New York-Newark-Jersey City, NY-NJ-PA | 3,080 | 0.36 | 0.57 | $ 20.07 | $ 41,750 |
| Dallas-Fort Worth-Arlington, TX | 2,120 | 0.59 | 0.95 | $ 17.82 | $ 37,070 |
| Philadelphia-Camden-Wilmington, PA-NJ-DE-MD | 1,730 | 0.65 | 1.05 | $ 21.97 | $ 45,700 |
| Green Bay, WI | 1,560 | 9.44 | 15.20 | $ 23.61 | $ 49,100 |
| Los Angeles-Long Beach-Anaheim, CA | 1,430 | 0.25 | 0.40 | $ 22.07 | $ 45,910 |
| Oshkosh-Neenah, WI | 1,420 | 15.81 | 25.46 | $ 23.71 | $ 49,310 |
| Kansas City, MO-KS | 1,420 | 1.40 | 2.25 | $ 20.78 | $ 43,210 |
| Cincinnati, OH-KY-IN | 1,320 | 1.29 | 2.07 | $ 20.73 | $ 43,110 |
| Atlanta-Sandy Springs-Roswell, GA | 1,200 | 0.47 | 0.75 | $ 21.89 | $ 45,530 |
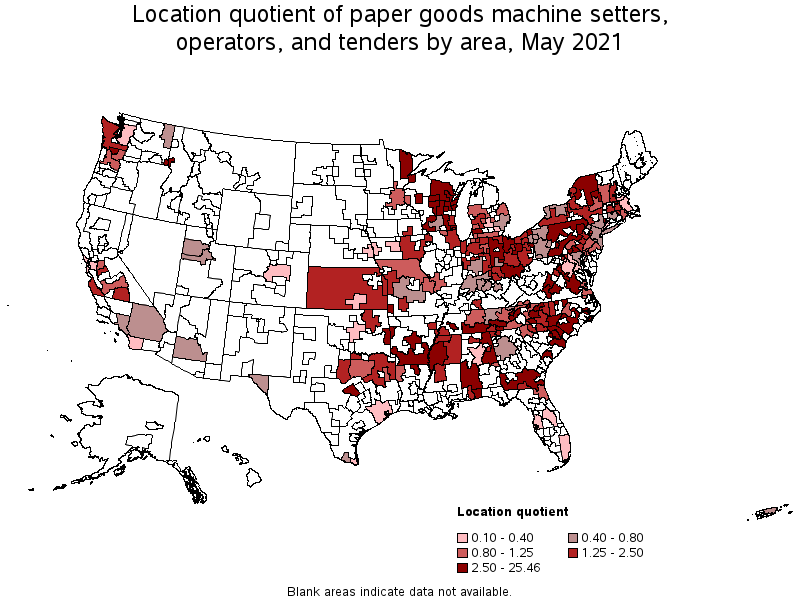
Metropolitan areas with the highest concentration of jobs and location quotients in Paper Goods Machine Setters, Operators, and Tenders:
| Metropolitan area | Employment (1) | Employment per thousand jobs | Location quotient (9) | Hourly mean wage | Annual mean wage (2) |
|---|---|---|---|---|---|
| Oshkosh-Neenah, WI | 1,420 | 15.81 | 25.46 | $ 23.71 | $ 49,310 |
| Longview, WA | 550 | 14.17 | 22.82 | $ 31.35 | $ 65,210 |
| Gettysburg, PA | 300 | 9.53 | 15.35 | $ 20.67 | $ 42,990 |
| Green Bay, WI | 1,560 | 9.44 | 15.20 | $ 23.61 | $ 49,100 |
| Lewiston, ID-WA | 240 | 8.75 | 14.09 | $ 27.74 | $ 57,690 |
| Glens Falls, NY | 420 | 8.73 | 14.06 | $ 24.32 | $ 50,580 |
| Wausau, WI | 480 | 7.06 | 11.37 | $ 24.61 | $ 51,190 |
| Appleton, WI | 750 | 6.37 | 10.27 | $ 23.41 | $ 48,680 |
| Jackson, TN | 320 | 4.79 | 7.71 | $ 18.11 | $ 37,660 |
| Altoona, PA | 260 | 4.59 | 7.39 | $ 21.49 | $ 44,690 |
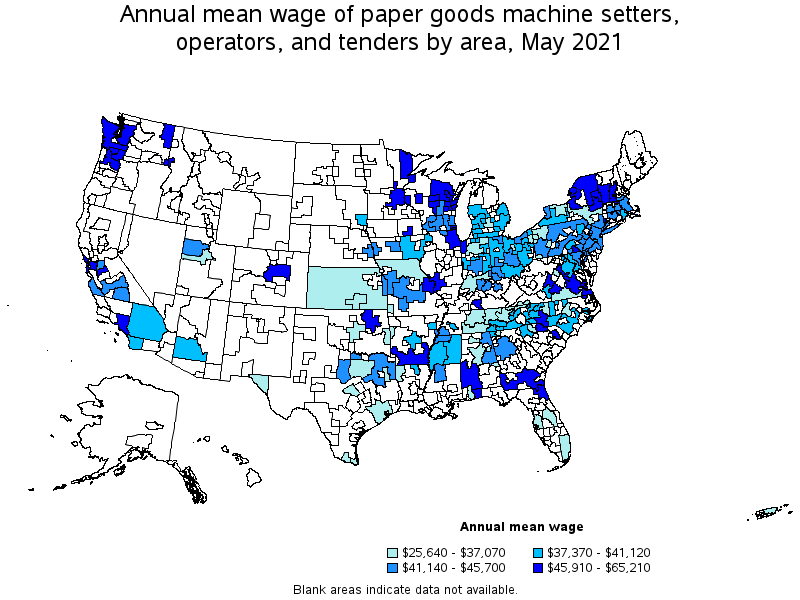
Top paying metropolitan areas for Paper Goods Machine Setters, Operators, and Tenders:
| Metropolitan area | Employment (1) | Employment per thousand jobs | Location quotient (9) | Hourly mean wage | Annual mean wage (2) |
|---|---|---|---|---|---|
| Longview, WA | 550 | 14.17 | 22.82 | $ 31.35 | $ 65,210 |
| Pensacola-Ferry Pass-Brent, FL | 310 | 1.77 | 2.86 | $ 27.92 | $ 58,070 |
| Lewiston, ID-WA | 240 | 8.75 | 14.09 | $ 27.74 | $ 57,690 |
| Duluth, MN-WI | 260 | 2.19 | 3.52 | $ 27.50 | $ 57,210 |
| Florence, SC | 250 | 2.96 | 4.77 | $ 26.80 | $ 55,750 |
| Danbury, CT | 140 | 1.95 | 3.14 | $ 26.76 | $ 55,660 |
| Spokane-Spokane Valley, WA | 70 | 0.29 | 0.46 | $ 25.36 | $ 52,760 |
| Wausau, WI | 480 | 7.06 | 11.37 | $ 24.61 | $ 51,190 |
| Seattle-Tacoma-Bellevue, WA | 460 | 0.24 | 0.39 | $ 24.51 | $ 50,980 |
| Syracuse, NY | 320 | 1.15 | 1.86 | $ 24.51 | $ 50,980 |
Nonmetropolitan areas with the highest employment in Paper Goods Machine Setters, Operators, and Tenders:
| Nonmetropolitan area | Employment (1) | Employment per thousand jobs | Location quotient (9) | Hourly mean wage | Annual mean wage (2) |
|---|---|---|---|---|---|
| Southwest Alabama nonmetropolitan area | 810 | 12.77 | 20.57 | $ 26.87 | $ 55,890 |
| Northeastern Wisconsin nonmetropolitan area | 790 | 4.13 | 6.65 | $ 23.81 | $ 49,520 |
| Piedmont North Carolina nonmetropolitan area | 750 | 3.07 | 4.95 | $ 18.77 | $ 39,030 |
| North Northeastern Ohio nonmetropolitan area (noncontiguous) | 700 | 2.23 | 3.58 | $ 19.06 | $ 39,650 |
| West Northwestern Ohio nonmetropolitan area | 660 | 2.77 | 4.47 | $ 19.39 | $ 40,320 |
Nonmetropolitan areas with the highest concentration of jobs and location quotients in Paper Goods Machine Setters, Operators, and Tenders:
| Nonmetropolitan area | Employment (1) | Employment per thousand jobs | Location quotient (9) | Hourly mean wage | Annual mean wage (2) |
|---|---|---|---|---|---|
| Southwest Alabama nonmetropolitan area | 810 | 12.77 | 20.57 | $ 26.87 | $ 55,890 |
| Northwest Virginia nonmetropolitan area | 390 | 6.31 | 10.17 | $ 24.10 | $ 50,130 |
| Northeastern Wisconsin nonmetropolitan area | 790 | 4.13 | 6.65 | $ 23.81 | $ 49,520 |
| Northern Pennsylvania nonmetropolitan area | 560 | 3.82 | 6.15 | $ 20.90 | $ 43,480 |
| Northeast South Carolina nonmetropolitan area | 340 | 3.68 | 5.93 | (8) | (8) |
Top paying nonmetropolitan areas for Paper Goods Machine Setters, Operators, and Tenders:
| Nonmetropolitan area | Employment (1) | Employment per thousand jobs | Location quotient (9) | Hourly mean wage | Annual mean wage (2) |
|---|---|---|---|---|---|
| Western Washington nonmetropolitan area | 120 | 1.04 | 1.67 | $ 27.79 | $ 57,790 |
| Southwest Alabama nonmetropolitan area | 810 | 12.77 | 20.57 | $ 26.87 | $ 55,890 |
| Capital/Northern New York nonmetropolitan area | 280 | 2.06 | 3.32 | $ 25.15 | $ 52,310 |
| Northwest Virginia nonmetropolitan area | 390 | 6.31 | 10.17 | $ 24.10 | $ 50,130 |
| Northeastern Wisconsin nonmetropolitan area | 790 | 4.13 | 6.65 | $ 23.81 | $ 49,520 |
These estimates are calculated with data collected from employers in all industry sectors, all metropolitan and nonmetropolitan areas, and all states and the District of Columbia. The top employment and wage figures are provided above. The complete list is available in the downloadable XLS files.
The percentile wage estimate is the value of a wage below which a certain percent of workers fall. The median wage is the 50th percentile wage estimate—50 percent of workers earn less than the median and 50 percent of workers earn more than the median. More about percentile wages.
(1) Estimates for detailed occupations do not sum to the totals because the totals include occupations not shown separately. Estimates do not include self-employed workers.
(2) Annual wages have been calculated by multiplying the hourly mean wage by a "year-round, full-time" hours figure of 2,080 hours; for those occupations where there is not an hourly wage published, the annual wage has been directly calculated from the reported survey data.
(3) The relative standard error (RSE) is a measure of the reliability of a survey statistic. The smaller the relative standard error, the more precise the estimate.
(8) Estimate not released.
(9) The location quotient is the ratio of the area concentration of occupational employment to the national average concentration. A location quotient greater than one indicates the occupation has a higher share of employment than average, and a location quotient less than one indicates the occupation is less prevalent in the area than average.
Other OEWS estimates and related information:
May 2021 National Occupational Employment and Wage Estimates
May 2021 State Occupational Employment and Wage Estimates
May 2021 Metropolitan and Nonmetropolitan Area Occupational Employment and Wage Estimates
May 2021 National Industry-Specific Occupational Employment and Wage Estimates
Last Modified Date: March 31, 2022