
An official website of the United States government
An official website of the United States government
The .gov means it's official.
Federal government websites often end in .gov or .mil. Before sharing sensitive information,
make sure you're on a federal government site.
The site is secure.
The
https:// ensures that you are connecting to the official website and that any
information you provide is encrypted and transmitted securely.
Operate dredge to remove sand, gravel, or other materials in order to excavate and maintain navigable channels in waterways.
Employment estimate and mean wage estimates for Dredge Operators:
| Employment (1) | Employment RSE (3) |
Mean hourly wage |
Mean annual wage (2) |
Wage RSE (3) |
|---|---|---|---|---|
| 1,650 | 10.1 % | $ 24.29 | $ 50,530 | 2.8 % |
Percentile wage estimates for Dredge Operators:
| Percentile | 10% | 25% | 50% (Median) |
75% | 90% |
|---|---|---|---|---|---|
| Hourly Wage | $ 17.04 | $ 18.39 | $ 22.22 | $ 29.68 | $ 36.83 |
| Annual Wage (2) | $ 35,440 | $ 38,250 | $ 46,210 | $ 61,740 | $ 76,610 |
Industries with the highest published employment and wages for Dredge Operators are provided. For a list of all industries with employment in Dredge Operators, see the Create Customized Tables function.
Industries with the highest levels of employment in Dredge Operators:
| Industry | Employment (1) | Percent of industry employment | Hourly mean wage | Annual mean wage (2) |
|---|---|---|---|---|
| Other Heavy and Civil Engineering Construction | 810 | 0.67 | $ 22.99 | $ 47,810 |
| Nonmetallic Mineral Mining and Quarrying | 440 | 0.46 | $ 22.67 | $ 47,150 |
| Highway, Street, and Bridge Construction | 70 | 0.02 | $ 35.33 | $ 73,480 |
| Merchant Wholesalers, Durable Goods (4232, 4233, 4235, 4236, 4237, and 4239 only) | 70 | 0.01 | $ 29.20 | $ 60,740 |
| Local Government, excluding schools and hospitals (OEWS Designation) | 60 | 0.00 | $ 33.46 | $ 69,610 |
Industries with the highest concentration of employment in Dredge Operators:
| Industry | Employment (1) | Percent of industry employment | Hourly mean wage | Annual mean wage (2) |
|---|---|---|---|---|
| Other Heavy and Civil Engineering Construction | 810 | 0.67 | $ 22.99 | $ 47,810 |
| Nonmetallic Mineral Mining and Quarrying | 440 | 0.46 | $ 22.67 | $ 47,150 |
| Highway, Street, and Bridge Construction | 70 | 0.02 | $ 35.33 | $ 73,480 |
| Chemical Manufacturing (3251, 3252, 3253, and 3259 only) | 30 | 0.01 | $ 33.00 | $ 68,640 |
| Merchant Wholesalers, Durable Goods (4232, 4233, 4235, 4236, 4237, and 4239 only) | 70 | 0.01 | $ 29.20 | $ 60,740 |
Top paying industries for Dredge Operators:
| Industry | Employment (1) | Percent of industry employment | Hourly mean wage | Annual mean wage (2) |
|---|---|---|---|---|
| Highway, Street, and Bridge Construction | 70 | 0.02 | $ 35.33 | $ 73,480 |
| Local Government, excluding schools and hospitals (OEWS Designation) | 60 | (7) | $ 33.46 | $ 69,610 |
| Chemical Manufacturing (3251, 3252, 3253, and 3259 only) | 30 | 0.01 | $ 33.00 | $ 68,640 |
| Merchant Wholesalers, Durable Goods (4232, 4233, 4235, 4236, 4237, and 4239 only) | 70 | 0.01 | $ 29.20 | $ 60,740 |
| Other Specialty Trade Contractors | (8) | (8) | $ 23.79 | $ 49,470 |
States and areas with the highest published employment, location quotients, and wages for Dredge Operators are provided. For a list of all areas with employment in Dredge Operators, see the Create Customized Tables function.
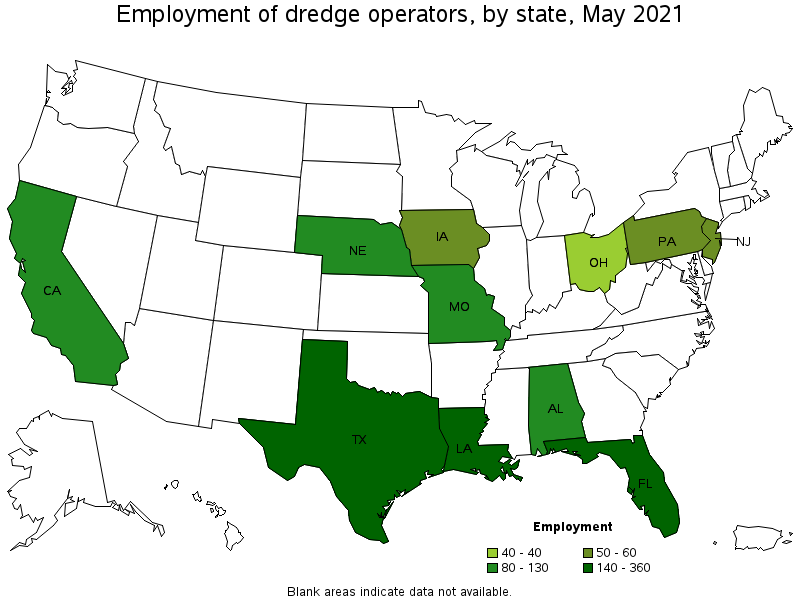
States with the highest employment level in Dredge Operators:
| State | Employment (1) | Employment per thousand jobs | Location quotient (9) | Hourly mean wage | Annual mean wage (2) |
|---|---|---|---|---|---|
| Louisiana | 360 | 0.20 | 17.17 | $ 21.62 | $ 44,970 |
| Florida | 190 | 0.02 | 1.86 | $ 21.97 | $ 45,710 |
| Texas | 140 | 0.01 | 0.95 | $ 21.66 | $ 45,060 |
| Missouri | 130 | 0.05 | 4.17 | $ 25.71 | $ 53,480 |
| California | 110 | 0.01 | 0.54 | $ 34.34 | $ 71,440 |
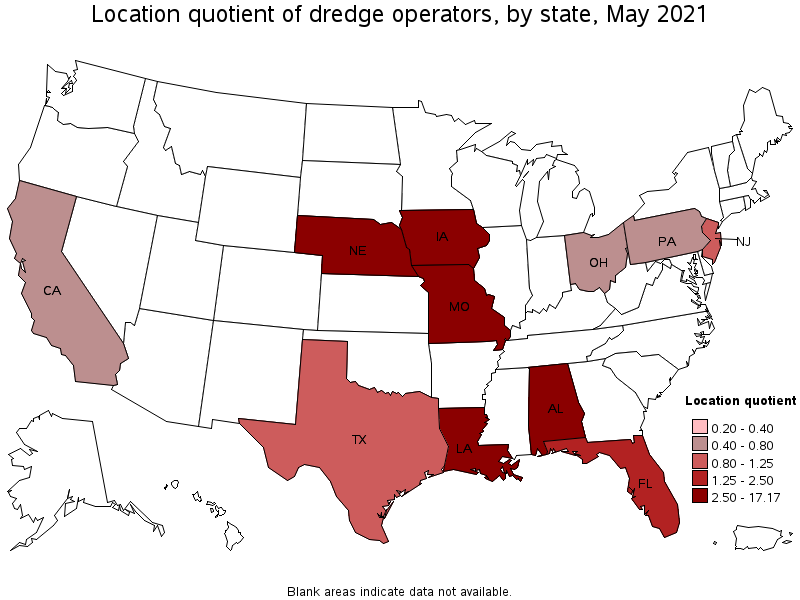
States with the highest concentration of jobs and location quotients in Dredge Operators:
| State | Employment (1) | Employment per thousand jobs | Location quotient (9) | Hourly mean wage | Annual mean wage (2) |
|---|---|---|---|---|---|
| Louisiana | 360 | 0.20 | 17.17 | $ 21.62 | $ 44,970 |
| Nebraska | 80 | 0.08 | 6.70 | $ 19.24 | $ 40,010 |
| Missouri | 130 | 0.05 | 4.17 | $ 25.71 | $ 53,480 |
| Iowa | 60 | 0.04 | 3.66 | $ 38.03 | $ 79,110 |
| Alabama | 80 | 0.04 | 3.55 | $ 15.88 | $ 33,030 |
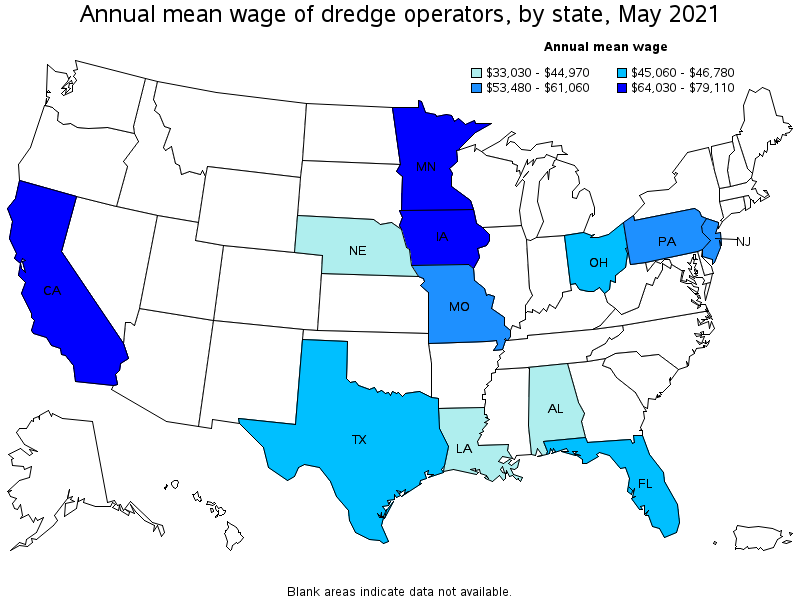
Top paying states for Dredge Operators:
| State | Employment (1) | Employment per thousand jobs | Location quotient (9) | Hourly mean wage | Annual mean wage (2) |
|---|---|---|---|---|---|
| Iowa | 60 | 0.04 | 3.66 | $ 38.03 | $ 79,110 |
| California | 110 | 0.01 | 0.54 | $ 34.34 | $ 71,440 |
| Minnesota | (8) | (8) | (8) | $ 30.79 | $ 64,030 |
| Pennsylvania | 50 | 0.01 | 0.78 | $ 29.36 | $ 61,060 |
| New Jersey | 50 | 0.01 | 1.09 | $ 28.54 | $ 59,370 |
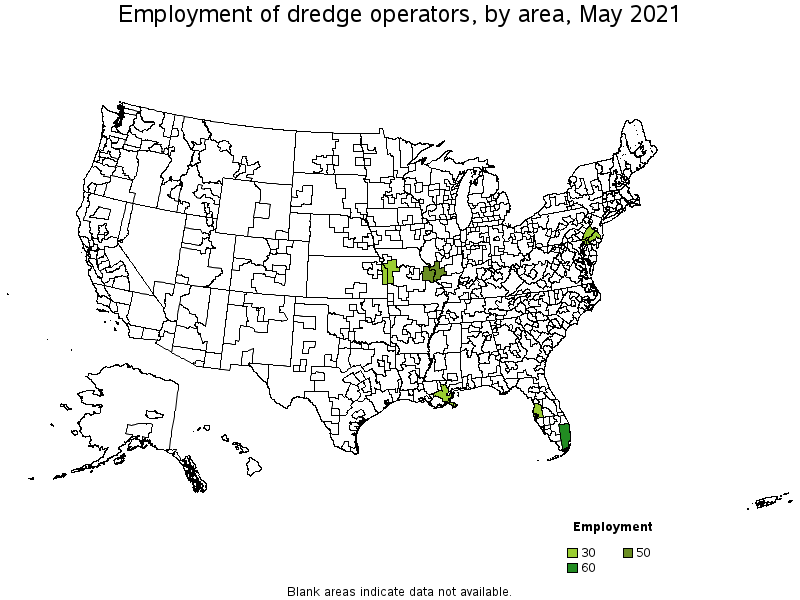
Metropolitan areas with the highest employment level in Dredge Operators:
| Metropolitan area | Employment (1) | Employment per thousand jobs | Location quotient (9) | Hourly mean wage | Annual mean wage (2) |
|---|---|---|---|---|---|
| Miami-Fort Lauderdale-West Palm Beach, FL | 60 | 0.02 | 2.07 | $ 23.71 | $ 49,320 |
| St. Louis, MO-IL | 50 | 0.04 | 3.50 | $ 29.08 | $ 60,490 |
| Kansas City, MO-KS | 30 | 0.03 | 2.94 | $ 23.42 | $ 48,720 |
| Tampa-St. Petersburg-Clearwater, FL | 30 | 0.03 | 2.25 | $ 22.09 | $ 45,950 |
| New Orleans-Metairie, LA | 30 | 0.06 | 5.26 | $ 21.81 | $ 45,370 |
| Philadelphia-Camden-Wilmington, PA-NJ-DE-MD | 30 | 0.01 | 0.97 | $ 30.22 | $ 62,850 |
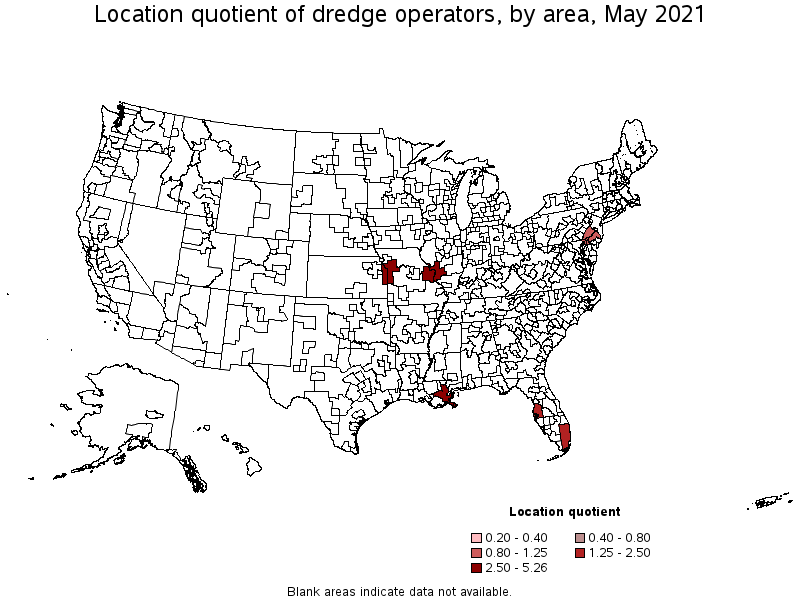
Metropolitan areas with the highest concentration of jobs and location quotients in Dredge Operators:
| Metropolitan area | Employment (1) | Employment per thousand jobs | Location quotient (9) | Hourly mean wage | Annual mean wage (2) |
|---|---|---|---|---|---|
| New Orleans-Metairie, LA | 30 | 0.06 | 5.26 | $ 21.81 | $ 45,370 |
| St. Louis, MO-IL | 50 | 0.04 | 3.50 | $ 29.08 | $ 60,490 |
| Kansas City, MO-KS | 30 | 0.03 | 2.94 | $ 23.42 | $ 48,720 |
| Tampa-St. Petersburg-Clearwater, FL | 30 | 0.03 | 2.25 | $ 22.09 | $ 45,950 |
| Miami-Fort Lauderdale-West Palm Beach, FL | 60 | 0.02 | 2.07 | $ 23.71 | $ 49,320 |
| Philadelphia-Camden-Wilmington, PA-NJ-DE-MD | 30 | 0.01 | 0.97 | $ 30.22 | $ 62,850 |
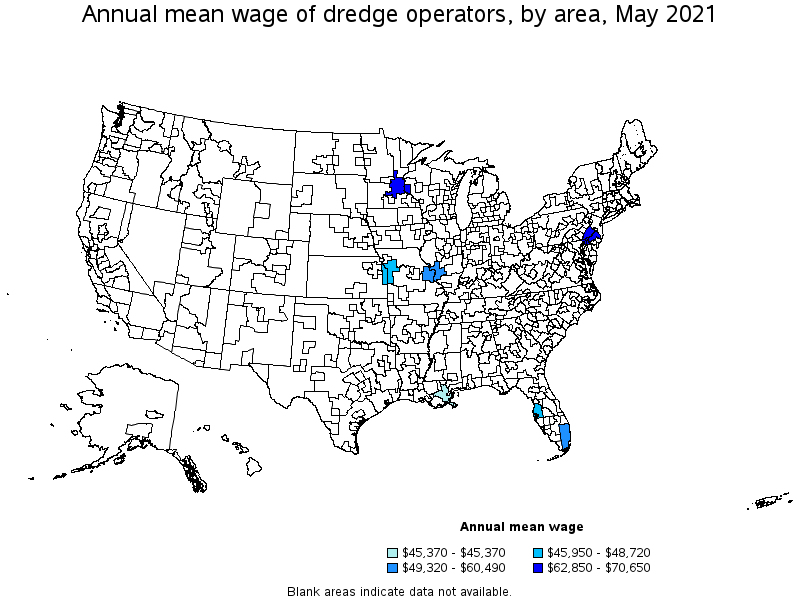
Top paying metropolitan areas for Dredge Operators:
| Metropolitan area | Employment (1) | Employment per thousand jobs | Location quotient (9) | Hourly mean wage | Annual mean wage (2) |
|---|---|---|---|---|---|
| Minneapolis-St. Paul-Bloomington, MN-WI | (8) | (8) | (8) | $ 33.97 | $ 70,650 |
| Philadelphia-Camden-Wilmington, PA-NJ-DE-MD | 30 | 0.01 | 0.97 | $ 30.22 | $ 62,850 |
| St. Louis, MO-IL | 50 | 0.04 | 3.50 | $ 29.08 | $ 60,490 |
| Miami-Fort Lauderdale-West Palm Beach, FL | 60 | 0.02 | 2.07 | $ 23.71 | $ 49,320 |
| Kansas City, MO-KS | 30 | 0.03 | 2.94 | $ 23.42 | $ 48,720 |
| Tampa-St. Petersburg-Clearwater, FL | 30 | 0.03 | 2.25 | $ 22.09 | $ 45,950 |
| New Orleans-Metairie, LA | 30 | 0.06 | 5.26 | $ 21.81 | $ 45,370 |
These estimates are calculated with data collected from employers in all industry sectors, all metropolitan and nonmetropolitan areas, and all states and the District of Columbia. The top employment and wage figures are provided above. The complete list is available in the downloadable XLS files.
The percentile wage estimate is the value of a wage below which a certain percent of workers fall. The median wage is the 50th percentile wage estimate—50 percent of workers earn less than the median and 50 percent of workers earn more than the median. More about percentile wages.
(1) Estimates for detailed occupations do not sum to the totals because the totals include occupations not shown separately. Estimates do not include self-employed workers.
(2) Annual wages have been calculated by multiplying the hourly mean wage by a "year-round, full-time" hours figure of 2,080 hours; for those occupations where there is not an hourly wage published, the annual wage has been directly calculated from the reported survey data.
(3) The relative standard error (RSE) is a measure of the reliability of a survey statistic. The smaller the relative standard error, the more precise the estimate.
(7) The value is less than .005 percent of industry employment.
(8) Estimate not released.
(9) The location quotient is the ratio of the area concentration of occupational employment to the national average concentration. A location quotient greater than one indicates the occupation has a higher share of employment than average, and a location quotient less than one indicates the occupation is less prevalent in the area than average.
Other OEWS estimates and related information:
May 2021 National Occupational Employment and Wage Estimates
May 2021 State Occupational Employment and Wage Estimates
May 2021 Metropolitan and Nonmetropolitan Area Occupational Employment and Wage Estimates
May 2021 National Industry-Specific Occupational Employment and Wage Estimates
Last Modified Date: March 31, 2022