
An official website of the United States government
An official website of the United States government
The .gov means it's official.
Federal government websites often end in .gov or .mil. Before sharing sensitive information,
make sure you're on a federal government site.
The site is secure.
The
https:// ensures that you are connecting to the official website and that any
information you provide is encrypted and transmitted securely.
Plan, direct, or coordinate the work activities and resources necessary for manufacturing products in accordance with cost, quality, and quantity specifications.
Employment estimate and mean wage estimates for Industrial Production Managers:
| Employment (1) | Employment RSE (3) |
Mean hourly wage |
Mean annual wage (2) |
Wage RSE (3) |
|---|---|---|---|---|
| 211,710 | 0.6 % | $ 58.13 | $ 120,900 | 0.4 % |
Percentile wage estimates for Industrial Production Managers:
| Percentile | 10% | 25% | 50% (Median) |
75% | 90% |
|---|---|---|---|---|---|
| Hourly Wage | $ 32.56 | $ 41.03 | $ 51.71 | $ 67.03 | $ 85.80 |
| Annual Wage (2) | $ 67,720 | $ 85,350 | $ 107,560 | $ 139,430 | $ 178,470 |
Industries with the highest published employment and wages for Industrial Production Managers are provided. For a list of all industries with employment in Industrial Production Managers, see the Create Customized Tables function.
Industries with the highest levels of employment in Industrial Production Managers:
| Industry | Employment (1) | Percent of industry employment | Hourly mean wage | Annual mean wage (2) |
|---|---|---|---|---|
| Machinery Manufacturing (3331, 3332, 3334, and 3339 only) | 9,990 | 1.33 | $ 55.31 | $ 115,050 |
| Plastics Product Manufacturing | 8,770 | 1.43 | $ 52.39 | $ 108,980 |
| Chemical Manufacturing (3251, 3252, 3253, and 3259 only) | 8,010 | 2.22 | $ 63.88 | $ 132,870 |
| Motor Vehicle Parts Manufacturing | 7,790 | 1.43 | $ 54.98 | $ 114,360 |
| Management of Companies and Enterprises | 7,410 | 0.28 | $ 76.55 | $ 159,230 |
Industries with the highest concentration of employment in Industrial Production Managers:
| Industry | Employment (1) | Percent of industry employment | Hourly mean wage | Annual mean wage (2) |
|---|---|---|---|---|
| Tobacco Manufacturing | 370 | 3.27 | $ 53.85 | $ 112,010 |
| Chemical Manufacturing (3251, 3252, 3253, and 3259 only) | 8,010 | 2.22 | $ 63.88 | $ 132,870 |
| Pharmaceutical and Medicine Manufacturing | 7,150 | 2.15 | $ 66.27 | $ 137,840 |
| Grain and Oilseed Milling | 1,210 | 1.92 | $ 57.23 | $ 119,030 |
| Coating, Engraving, Heat Treating, and Allied Activities | 2,390 | 1.89 | $ 46.17 | $ 96,040 |
Top paying industries for Industrial Production Managers:
| Industry | Employment (1) | Percent of industry employment | Hourly mean wage | Annual mean wage (2) |
|---|---|---|---|---|
| Natural Gas Distribution | 460 | 0.42 | $ 91.65 | $ 190,620 |
| Oil and Gas Extraction | 1,130 | 1.11 | $ 90.91 | $ 189,100 |
| Scientific Research and Development Services | 5,130 | 0.59 | $ 86.06 | $ 179,010 |
| Automobile Dealers | (8) | (8) | $ 78.01 | $ 162,250 |
| Electric Power Generation, Transmission and Distribution | 1,930 | 0.51 | $ 76.56 | $ 159,240 |
States and areas with the highest published employment, location quotients, and wages for Industrial Production Managers are provided. For a list of all areas with employment in Industrial Production Managers, see the Create Customized Tables function.
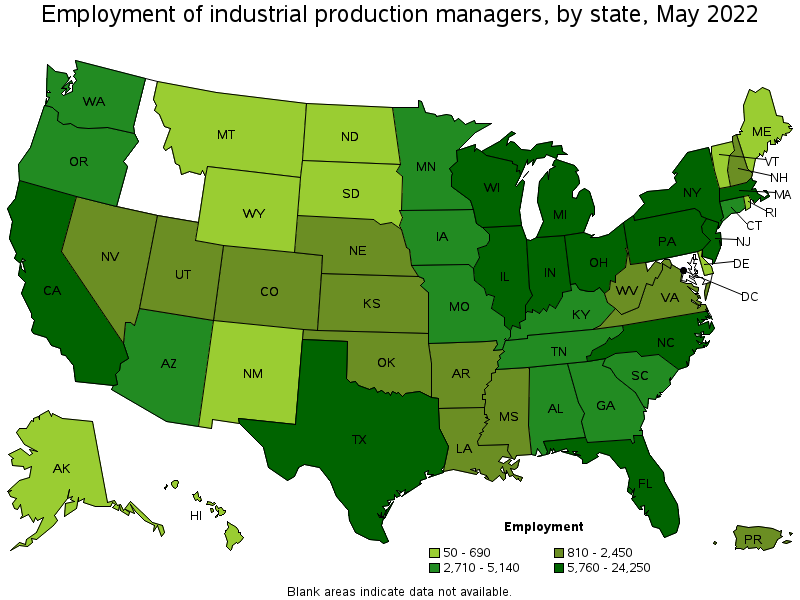
States with the highest employment level in Industrial Production Managers:
| State | Employment (1) | Employment per thousand jobs | Location quotient (9) | Hourly mean wage | Annual mean wage (2) |
|---|---|---|---|---|---|
| California | 24,250 | 1.37 | 0.96 | $ 64.66 | $ 134,500 |
| Texas | 18,220 | 1.40 | 0.98 | $ 61.30 | $ 127,500 |
| Michigan | 14,190 | 3.34 | 2.33 | $ 55.39 | $ 115,210 |
| Ohio | 12,820 | 2.38 | 1.67 | $ 51.86 | $ 107,870 |
| Illinois | 11,090 | 1.89 | 1.32 | $ 58.81 | $ 122,320 |
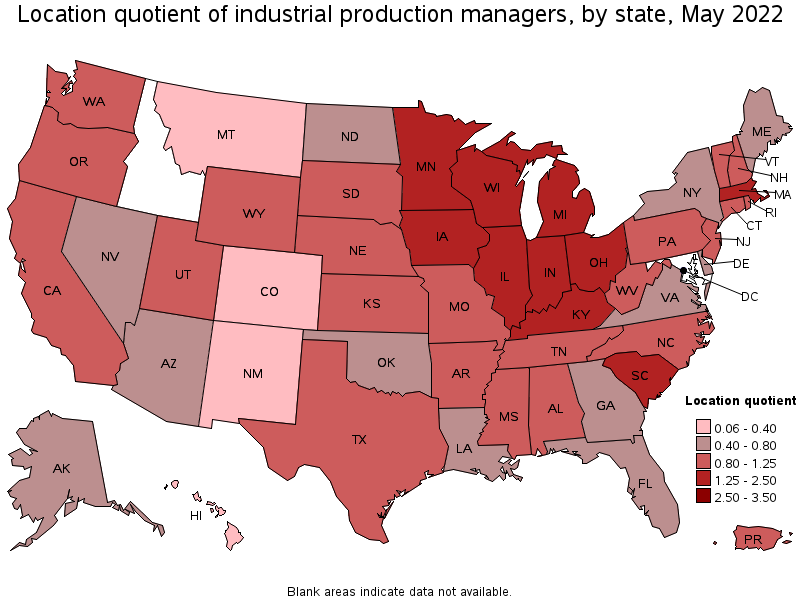
States with the highest concentration of jobs and location quotients in Industrial Production Managers:
| State | Employment (1) | Employment per thousand jobs | Location quotient (9) | Hourly mean wage | Annual mean wage (2) |
|---|---|---|---|---|---|
| Michigan | 14,190 | 3.34 | 2.33 | $ 55.39 | $ 115,210 |
| Indiana | 7,790 | 2.52 | 1.76 | $ 50.20 | $ 104,410 |
| Wisconsin | 6,870 | 2.44 | 1.70 | $ 54.96 | $ 114,310 |
| Ohio | 12,820 | 2.38 | 1.67 | $ 51.86 | $ 107,870 |
| Iowa | 3,510 | 2.31 | 1.61 | $ 50.90 | $ 105,870 |
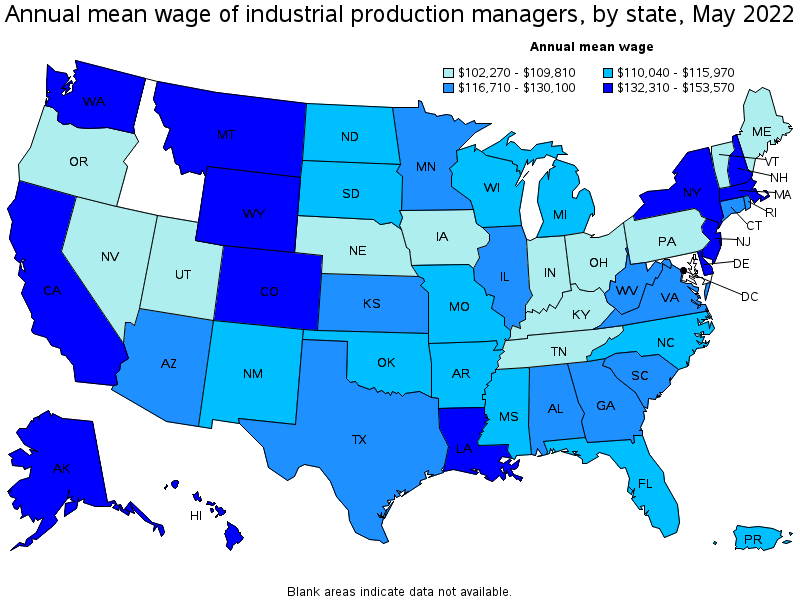
Top paying states for Industrial Production Managers:
| State | Employment (1) | Employment per thousand jobs | Location quotient (9) | Hourly mean wage | Annual mean wage (2) |
|---|---|---|---|---|---|
| New Jersey | 5,760 | 1.40 | 0.98 | $ 73.83 | $ 153,570 |
| Colorado | 1,240 | 0.45 | 0.31 | $ 71.06 | $ 147,810 |
| Delaware | 450 | 0.99 | 0.69 | $ 71.02 | $ 147,720 |
| New York | 5,840 | 0.64 | 0.45 | $ 66.92 | $ 139,200 |
| Wyoming | 370 | 1.37 | 0.95 | $ 66.51 | $ 138,340 |
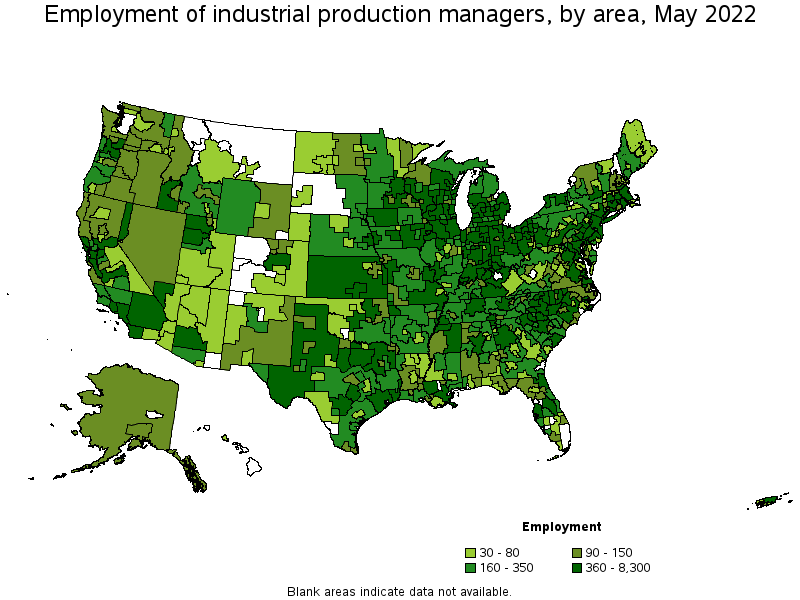
Metropolitan areas with the highest employment level in Industrial Production Managers:
| Metropolitan area | Employment (1) | Employment per thousand jobs | Location quotient (9) | Hourly mean wage | Annual mean wage (2) |
|---|---|---|---|---|---|
| Los Angeles-Long Beach-Anaheim, CA | 8,300 | 1.36 | 0.95 | $ 59.19 | $ 123,120 |
| Chicago-Naperville-Elgin, IL-IN-WI | 7,970 | 1.80 | 1.26 | $ 60.54 | $ 125,930 |
| New York-Newark-Jersey City, NY-NJ-PA | 6,660 | 0.72 | 0.51 | $ 74.91 | $ 155,810 |
| Detroit-Warren-Dearborn, MI | 6,370 | 3.41 | 2.38 | $ 58.13 | $ 120,910 |
| Boston-Cambridge-Nashua, MA-NH | 5,920 | 2.19 | 1.53 | $ 70.34 | $ 146,300 |
| Dallas-Fort Worth-Arlington, TX | 5,370 | 1.41 | 0.99 | $ 60.24 | $ 125,310 |
| Houston-The Woodlands-Sugar Land, TX | 5,210 | 1.70 | 1.19 | $ 66.16 | $ 137,610 |
| San Francisco-Oakland-Hayward, CA | 3,730 | 1.56 | 1.09 | $ 81.99 | $ 170,540 |
| Minneapolis-St. Paul-Bloomington, MN-WI | 3,590 | 1.91 | 1.33 | $ 62.70 | $ 130,420 |
| Philadelphia-Camden-Wilmington, PA-NJ-DE-MD | 3,060 | 1.10 | 0.77 | $ 59.15 | $ 123,030 |
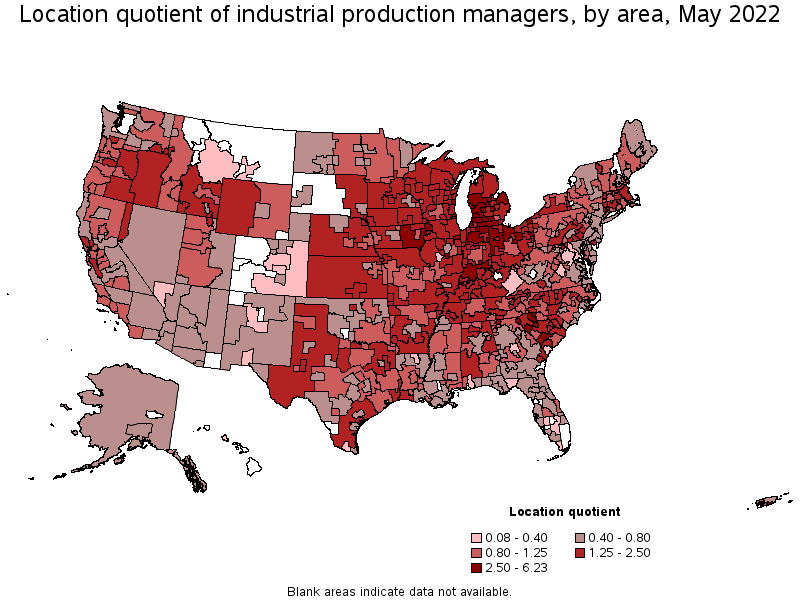
Metropolitan areas with the highest concentration of jobs and location quotients in Industrial Production Managers:
| Metropolitan area | Employment (1) | Employment per thousand jobs | Location quotient (9) | Hourly mean wage | Annual mean wage (2) |
|---|---|---|---|---|---|
| Columbus, IN | 440 | 8.92 | 6.23 | $ 46.92 | $ 97,580 |
| Decatur, IL | 370 | 8.04 | 5.62 | $ 54.49 | $ 113,330 |
| Elkhart-Goshen, IN | 870 | 6.15 | 4.30 | $ 47.21 | $ 98,200 |
| Battle Creek, MI | 250 | 5.05 | 3.53 | $ 54.83 | $ 114,050 |
| Muskegon, MI | 300 | 4.87 | 3.40 | $ 50.28 | $ 104,590 |
| Sheboygan, WI | 260 | 4.40 | 3.07 | $ 54.43 | $ 113,210 |
| Jackson, MI | 240 | 4.37 | 3.05 | $ 50.95 | $ 105,970 |
| Kalamazoo-Portage, MI | 570 | 4.13 | 2.88 | $ 54.14 | $ 112,610 |
| Grand Rapids-Wyoming, MI | 2,240 | 4.08 | 2.85 | $ 52.95 | $ 110,140 |
| Racine, WI | 290 | 3.93 | 2.75 | $ 55.82 | $ 116,110 |
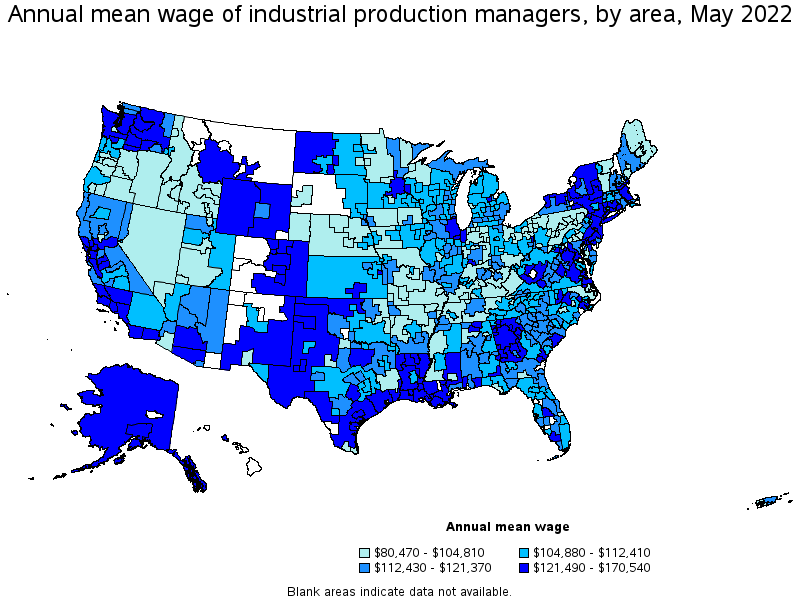
Top paying metropolitan areas for Industrial Production Managers:
| Metropolitan area | Employment (1) | Employment per thousand jobs | Location quotient (9) | Hourly mean wage | Annual mean wage (2) |
|---|---|---|---|---|---|
| San Francisco-Oakland-Hayward, CA | 3,730 | 1.56 | 1.09 | $ 81.99 | $ 170,540 |
| Trenton, NJ | 300 | 1.27 | 0.88 | $ 77.22 | $ 160,610 |
| San Jose-Sunnyvale-Santa Clara, CA | 2,410 | 2.14 | 1.50 | $ 76.58 | $ 159,280 |
| Midland, TX | 350 | 3.35 | 2.34 | $ 75.76 | $ 157,590 |
| Billings, MT | 50 | 0.54 | 0.37 | $ 75.40 | $ 156,840 |
| Houma-Thibodaux, LA | 80 | 0.98 | 0.68 | $ 75.10 | $ 156,200 |
| New York-Newark-Jersey City, NY-NJ-PA | 6,660 | 0.72 | 0.51 | $ 74.91 | $ 155,810 |
| Boulder, CO | 150 | 0.76 | 0.53 | $ 74.22 | $ 154,380 |
| Fort Collins, CO | 100 | 0.62 | 0.43 | $ 73.96 | $ 153,830 |
| Denver-Aurora-Lakewood, CO | 680 | 0.44 | 0.31 | $ 73.44 | $ 152,750 |
Nonmetropolitan areas with the highest employment in Industrial Production Managers:
| Nonmetropolitan area | Employment (1) | Employment per thousand jobs | Location quotient (9) | Hourly mean wage | Annual mean wage (2) |
|---|---|---|---|---|---|
| North Northeastern Ohio nonmetropolitan area (noncontiguous) | 1,170 | 3.65 | 2.55 | $ 49.37 | $ 102,690 |
| West Northwestern Ohio nonmetropolitan area | 1,110 | 4.51 | 3.15 | $ 50.63 | $ 105,320 |
| Balance of Lower Peninsula of Michigan nonmetropolitan area | 1,050 | 4.02 | 2.81 | $ 51.59 | $ 107,310 |
| Northern Indiana nonmetropolitan area | 890 | 4.28 | 2.99 | $ 46.74 | $ 97,210 |
| Kansas nonmetropolitan area | 790 | 2.06 | 1.44 | $ 53.93 | $ 112,160 |
Nonmetropolitan areas with the highest concentration of jobs and location quotients in Industrial Production Managers:
| Nonmetropolitan area | Employment (1) | Employment per thousand jobs | Location quotient (9) | Hourly mean wage | Annual mean wage (2) |
|---|---|---|---|---|---|
| West Northwestern Ohio nonmetropolitan area | 1,110 | 4.51 | 3.15 | $ 50.63 | $ 105,320 |
| Northern Indiana nonmetropolitan area | 890 | 4.28 | 2.99 | $ 46.74 | $ 97,210 |
| Southern Indiana nonmetropolitan area | 750 | 4.06 | 2.84 | $ 46.99 | $ 97,740 |
| Balance of Lower Peninsula of Michigan nonmetropolitan area | 1,050 | 4.02 | 2.81 | $ 51.59 | $ 107,310 |
| Upper Savannah South Carolina nonmetropolitan area | 310 | 3.96 | 2.77 | $ 54.88 | $ 114,160 |
Top paying nonmetropolitan areas for Industrial Production Managers:
| Nonmetropolitan area | Employment (1) | Employment per thousand jobs | Location quotient (9) | Hourly mean wage | Annual mean wage (2) |
|---|---|---|---|---|---|
| Western Wyoming nonmetropolitan area | 180 | 1.89 | 1.32 | $ 71.98 | $ 149,710 |
| West North Dakota nonmetropolitan area | 80 | 0.70 | 0.49 | $ 69.85 | $ 145,290 |
| Coastal Plains Region of Texas nonmetropolitan area | 280 | 1.90 | 1.32 | $ 67.32 | $ 140,030 |
| Alaska nonmetropolitan area | 90 | 0.86 | 0.60 | $ 65.74 | $ 136,730 |
| Central Louisiana nonmetropolitan area | 110 | 1.43 | 1.00 | $ 65.21 | $ 135,630 |
These estimates are calculated with data collected from employers in all industry sectors, all metropolitan and nonmetropolitan areas, and all states and the District of Columbia. The top employment and wage figures are provided above. The complete list is available in the downloadable XLS files.
The percentile wage estimate is the value of a wage below which a certain percent of workers fall. The median wage is the 50th percentile wage estimate—50 percent of workers earn less than the median and 50 percent of workers earn more than the median. More about percentile wages.
(1) Estimates for detailed occupations do not sum to the totals because the totals include occupations not shown separately. Estimates do not include self-employed workers.
(2) Annual wages have been calculated by multiplying the hourly mean wage by a "year-round, full-time" hours figure of 2,080 hours; for those occupations where there is not an hourly wage published, the annual wage has been directly calculated from the reported survey data.
(3) The relative standard error (RSE) is a measure of the reliability of a survey statistic. The smaller the relative standard error, the more precise the estimate.
(8) Estimate not released.
(9) The location quotient is the ratio of the area concentration of occupational employment to the national average concentration. A location quotient greater than one indicates the occupation has a higher share of employment than average, and a location quotient less than one indicates the occupation is less prevalent in the area than average.
Other OEWS estimates and related information:
May 2022 National Occupational Employment and Wage Estimates
May 2022 State Occupational Employment and Wage Estimates
May 2022 Metropolitan and Nonmetropolitan Area Occupational Employment and Wage Estimates
May 2022 National Industry-Specific Occupational Employment and Wage Estimates
Last Modified Date: April 25, 2023