An official website of the United States government
 United States Department of Labor
Plan, direct, or coordinate academic or nonacademic activities of preschools or childcare centers and programs, including before- and after-school care. Excludes “Preschool Teachers, Except Special Education” (25-2011) and “Childcare Workers” (39-9011).
Employment estimate and mean wage estimates for Education and Childcare Administrators, Preschool and Daycare:
| Employment (1) | Employment RSE (3) |
Mean hourly wage |
Mean annual wage (2) |
Wage RSE (3) |
|---|---|---|---|---|
| 60,010 | 2.3 % | $ 27.70 | $ 57,610 | 1.7 % |
Percentile wage estimates for Education and Childcare Administrators, Preschool and Daycare:
| Percentile | 10% | 25% | 50% (Median) |
75% | 90% |
|---|---|---|---|---|---|
| Hourly Wage | $ 16.92 | $ 19.46 | $ 23.89 | $ 30.40 | $ 41.05 |
| Annual Wage (2) | $ 35,190 | $ 40,470 | $ 49,690 | $ 63,240 | $ 85,390 |
Industries with the highest published employment and wages for Education and Childcare Administrators, Preschool and Daycare are provided. For a list of all industries with employment in Education and Childcare Administrators, Preschool and Daycare, see the Create Customized Tables function.
Industries with the highest levels of employment in Education and Childcare Administrators, Preschool and Daycare:
| Industry | Employment (1) | Percent of industry employment | Hourly mean wage | Annual mean wage (2) |
|---|---|---|---|---|
| Child Day Care Services | 48,930 | 5.58 | $ 26.49 | $ 55,100 |
| Elementary and Secondary Schools | 4,260 | 0.05 | $ 36.20 | $ 75,300 |
| Individual and Family Services | 1,530 | 0.05 | $ 29.70 | $ 61,770 |
| Civic and Social Organizations | 690 | 0.23 | $ 27.50 | $ 57,200 |
| Local Government, excluding schools and hospitals (OEWS Designation) | 660 | 0.01 | $ 33.56 | $ 69,810 |
Industries with the highest concentration of employment in Education and Childcare Administrators, Preschool and Daycare:
| Industry | Employment (1) | Percent of industry employment | Hourly mean wage | Annual mean wage (2) |
|---|---|---|---|---|
| Child Day Care Services | 48,930 | 5.58 | $ 26.49 | $ 55,100 |
| Religious Organizations | 600 | 0.32 | $ 28.69 | $ 59,680 |
| Civic and Social Organizations | 690 | 0.23 | $ 27.50 | $ 57,200 |
| Educational Support Services | 330 | 0.15 | $ 29.65 | $ 61,670 |
| Other Schools and Instruction | 630 | 0.13 | $ 23.58 | $ 49,050 |
Top paying industries for Education and Childcare Administrators, Preschool and Daycare:
| Industry | Employment (1) | Percent of industry employment | Hourly mean wage | Annual mean wage (2) |
|---|---|---|---|---|
| Management, Scientific, and Technical Consulting Services | (8) | (8) | $ 48.27 | $ 100,400 |
| State Government, excluding schools and hospitals (OEWS Designation) | 70 | (7) | $ 42.01 | $ 87,390 |
| Junior Colleges | 310 | 0.05 | $ 40.04 | $ 83,290 |
| Community Food and Housing, and Emergency and Other Relief Services | 70 | 0.04 | $ 39.57 | $ 82,300 |
| Colleges, Universities, and Professional Schools | 410 | 0.01 | $ 38.96 | $ 81,050 |
States and areas with the highest published employment, location quotients, and wages for Education and Childcare Administrators, Preschool and Daycare are provided. For a list of all areas with employment in Education and Childcare Administrators, Preschool and Daycare, see the Create Customized Tables function.
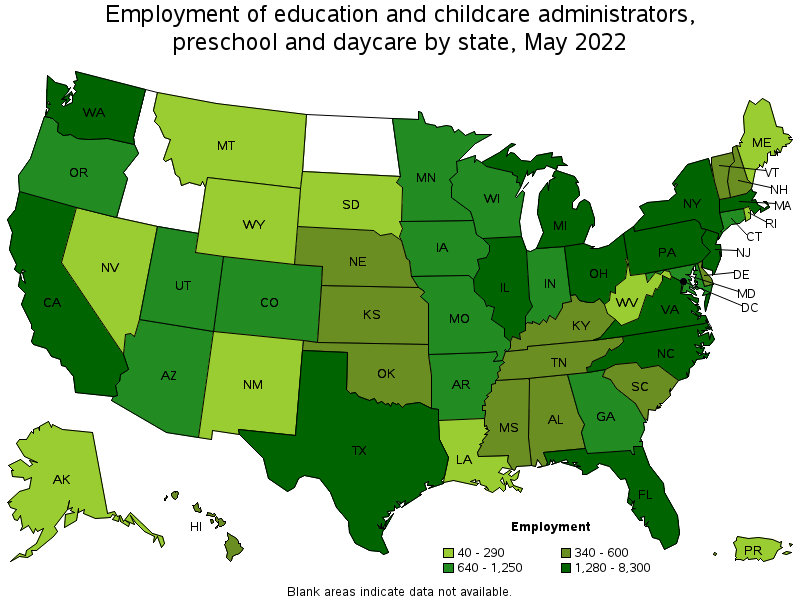
States with the highest employment level in Education and Childcare Administrators, Preschool and Daycare:
| State | Employment (1) | Employment per thousand jobs | Location quotient (9) | Hourly mean wage | Annual mean wage (2) |
|---|---|---|---|---|---|
| California | 8,300 | 0.47 | 1.16 | $ 32.30 | $ 67,190 |
| Florida | 4,570 | 0.50 | 1.22 | $ 24.68 | $ 51,330 |
| New York | 3,820 | 0.42 | 1.03 | $ 34.30 | $ 71,340 |
| Texas | 3,790 | 0.29 | 0.72 | $ 25.78 | $ 53,620 |
| Pennsylvania | 3,520 | 0.61 | 1.49 | $ 24.90 | $ 51,800 |
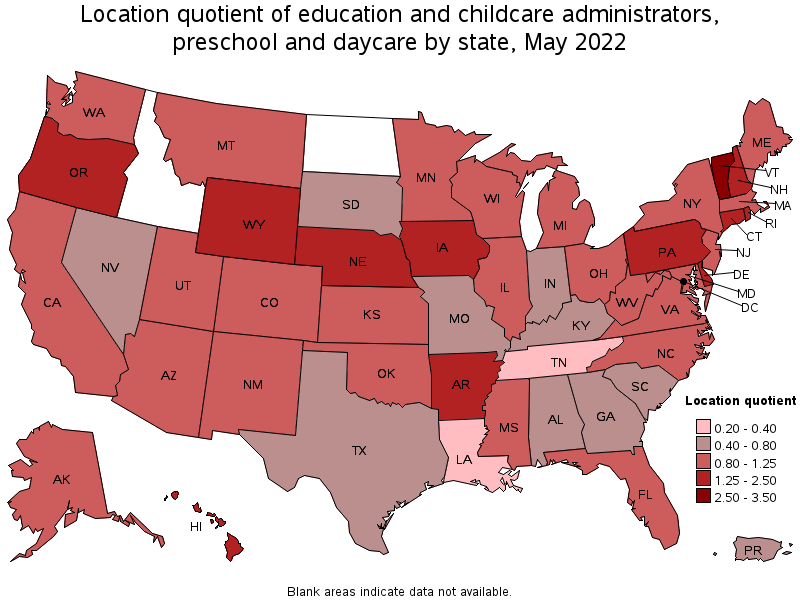
States with the highest concentration of jobs and location quotients in Education and Childcare Administrators, Preschool and Daycare:
| State | Employment (1) | Employment per thousand jobs | Location quotient (9) | Hourly mean wage | Annual mean wage (2) |
|---|---|---|---|---|---|
| Vermont | 350 | 1.21 | 2.98 | $ 26.41 | $ 54,940 |
| Iowa | 1,250 | 0.82 | 2.02 | $ 22.53 | $ 46,850 |
| Delaware | 370 | 0.80 | 1.98 | $ 25.54 | $ 53,110 |
| New Hampshire | 510 | 0.77 | 1.90 | $ 27.79 | $ 57,800 |
| Arkansas | 850 | 0.69 | 1.70 | $ 21.12 | $ 43,920 |
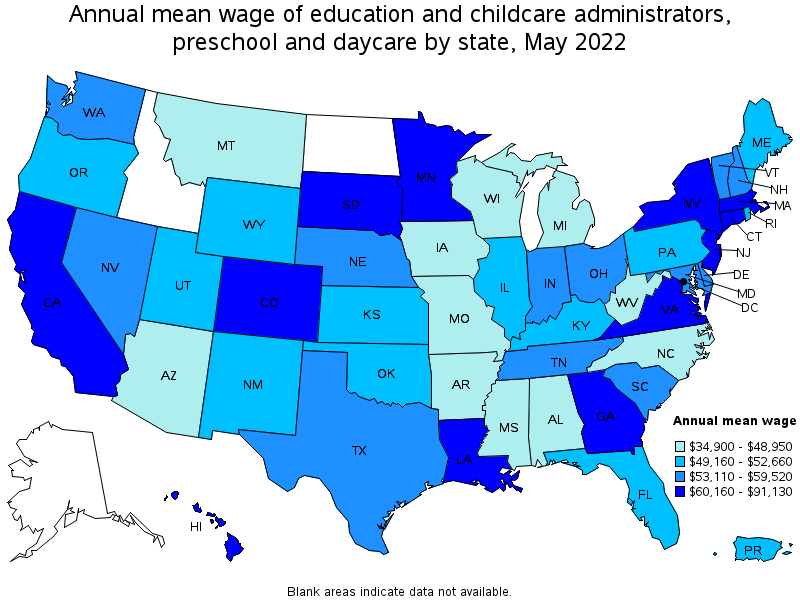
Top paying states for Education and Childcare Administrators, Preschool and Daycare:
| State | Employment (1) | Employment per thousand jobs | Location quotient (9) | Hourly mean wage | Annual mean wage (2) |
|---|---|---|---|---|---|
| District of Columbia | 280 | 0.41 | 1.00 | $ 43.81 | $ 91,130 |
| New Jersey | 1,720 | 0.42 | 1.03 | $ 42.96 | $ 89,350 |
| New York | 3,820 | 0.42 | 1.03 | $ 34.30 | $ 71,340 |
| Massachusetts | 1,640 | 0.46 | 1.13 | $ 32.68 | $ 67,980 |
| California | 8,300 | 0.47 | 1.16 | $ 32.30 | $ 67,190 |
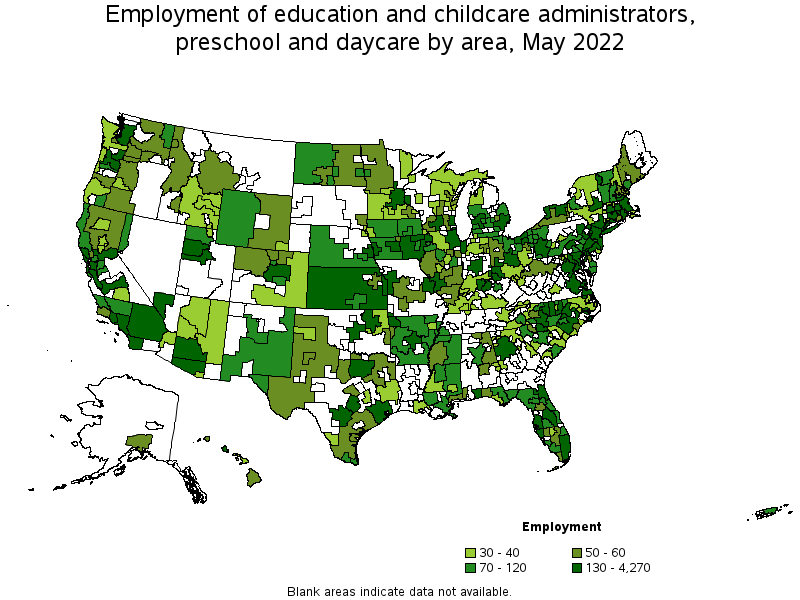
Metropolitan areas with the highest employment level in Education and Childcare Administrators, Preschool and Daycare:
| Metropolitan area | Employment (1) | Employment per thousand jobs | Location quotient (9) | Hourly mean wage | Annual mean wage (2) |
|---|---|---|---|---|---|
| New York-Newark-Jersey City, NY-NJ-PA | 4,270 | 0.46 | 1.15 | $ 38.91 | $ 80,920 |
| Los Angeles-Long Beach-Anaheim, CA | 2,650 | 0.43 | 1.07 | $ 32.31 | $ 67,210 |
| Philadelphia-Camden-Wilmington, PA-NJ-DE-MD | 2,200 | 0.79 | 1.96 | $ 26.55 | $ 55,210 |
| Chicago-Naperville-Elgin, IL-IN-WI | 1,920 | 0.44 | 1.07 | $ 26.01 | $ 54,090 |
| San Francisco-Oakland-Hayward, CA | 1,710 | 0.72 | 1.76 | $ 34.42 | $ 71,590 |
| Washington-Arlington-Alexandria, DC-VA-MD-WV | 1,550 | 0.51 | 1.26 | $ 32.88 | $ 68,380 |
| Boston-Cambridge-Nashua, MA-NH | 1,340 | 0.50 | 1.22 | $ 33.42 | $ 69,520 |
| Miami-Fort Lauderdale-West Palm Beach, FL | 1,210 | 0.46 | 1.13 | $ 27.82 | $ 57,860 |
| Dallas-Fort Worth-Arlington, TX | 1,040 | 0.27 | 0.67 | $ 26.60 | $ 55,330 |
| Houston-The Woodlands-Sugar Land, TX | 1,010 | 0.33 | 0.81 | $ 27.64 | $ 57,500 |
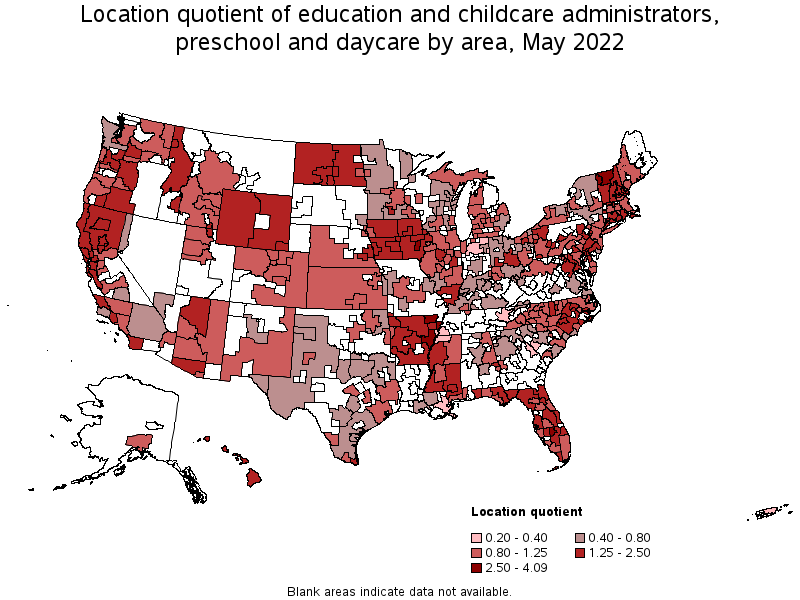
Metropolitan areas with the highest concentration of jobs and location quotients in Education and Childcare Administrators, Preschool and Daycare:
| Metropolitan area | Employment (1) | Employment per thousand jobs | Location quotient (9) | Hourly mean wage | Annual mean wage (2) |
|---|---|---|---|---|---|
| Burlington-South Burlington, VT | 180 | 1.57 | 3.86 | $ 27.37 | $ 56,930 |
| Sebring, FL | 30 | 1.25 | 3.09 | $ 24.67 | $ 51,310 |
| Iowa City, IA | 100 | 1.11 | 2.74 | $ 21.70 | $ 45,130 |
| Ames, IA | 50 | 1.00 | 2.47 | $ 21.89 | $ 45,530 |
| Dover-Durham, NH-ME | 50 | 0.99 | 2.44 | $ 25.24 | $ 52,490 |
| Waterloo-Cedar Falls, IA | 80 | 0.98 | 2.41 | $ 20.87 | $ 43,410 |
| Cedar Rapids, IA | 130 | 0.97 | 2.39 | $ 23.49 | $ 48,850 |
| Santa Cruz-Watsonville, CA | 90 | 0.91 | 2.23 | $ 29.14 | $ 60,610 |
| Des Moines-West Des Moines, IA | 330 | 0.89 | 2.19 | $ 23.04 | $ 47,930 |
| Johnstown, PA | 40 | 0.84 | 2.08 | $ 21.74 | $ 45,220 |
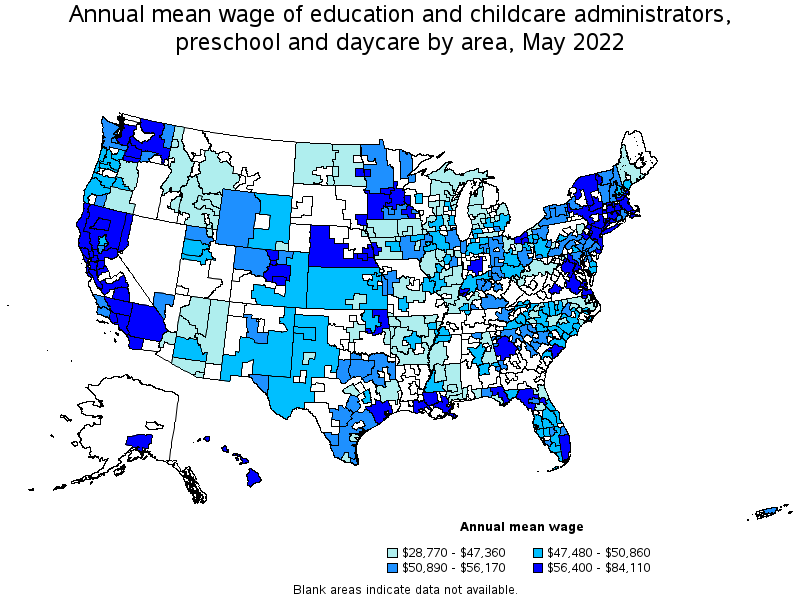
Top paying metropolitan areas for Education and Childcare Administrators, Preschool and Daycare:
| Metropolitan area | Employment (1) | Employment per thousand jobs | Location quotient (9) | Hourly mean wage | Annual mean wage (2) |
|---|---|---|---|---|---|
| Atlantic City-Hammonton, NJ | 30 | 0.25 | 0.61 | $ 40.44 | $ 84,110 |
| New York-Newark-Jersey City, NY-NJ-PA | 4,270 | 0.46 | 1.15 | $ 38.91 | $ 80,920 |
| Trenton, NJ | 110 | 0.46 | 1.14 | $ 37.48 | $ 77,970 |
| San Jose-Sunnyvale-Santa Clara, CA | 650 | 0.58 | 1.43 | $ 37.06 | $ 77,090 |
| San Francisco-Oakland-Hayward, CA | 1,710 | 0.72 | 1.76 | $ 34.42 | $ 71,590 |
| Napa, CA | 50 | 0.66 | 1.62 | $ 33.94 | $ 70,590 |
| Boston-Cambridge-Nashua, MA-NH | 1,340 | 0.50 | 1.22 | $ 33.42 | $ 69,520 |
| Washington-Arlington-Alexandria, DC-VA-MD-WV | 1,550 | 0.51 | 1.26 | $ 32.88 | $ 68,380 |
| Riverside-San Bernardino-Ontario, CA | 430 | 0.26 | 0.65 | $ 32.42 | $ 67,440 |
| Los Angeles-Long Beach-Anaheim, CA | 2,650 | 0.43 | 1.07 | $ 32.31 | $ 67,210 |
Nonmetropolitan areas with the highest employment in Education and Childcare Administrators, Preschool and Daycare:
| Nonmetropolitan area | Employment (1) | Employment per thousand jobs | Location quotient (9) | Hourly mean wage | Annual mean wage (2) |
|---|---|---|---|---|---|
| Southeast Coastal North Carolina nonmetropolitan area | 150 | 0.60 | 1.48 | $ 22.83 | $ 47,480 |
| Southeast Iowa nonmetropolitan area | 140 | 0.66 | 1.62 | $ 25.23 | $ 52,470 |
| Kansas nonmetropolitan area | 140 | 0.35 | 0.87 | $ 23.05 | $ 47,950 |
| Piedmont North Carolina nonmetropolitan area | 120 | 0.47 | 1.15 | $ 22.59 | $ 46,990 |
| Balance of Lower Peninsula of Michigan nonmetropolitan area | 120 | 0.44 | 1.09 | $ 20.11 | $ 41,830 |
Nonmetropolitan areas with the highest concentration of jobs and location quotients in Education and Childcare Administrators, Preschool and Daycare:
| Nonmetropolitan area | Employment (1) | Employment per thousand jobs | Location quotient (9) | Hourly mean wage | Annual mean wage (2) |
|---|---|---|---|---|---|
| East Arkansas nonmetropolitan area | 110 | 1.66 | 4.09 | $ 19.13 | $ 39,780 |
| Northern Vermont nonmetropolitan area | 70 | 1.08 | 2.66 | $ 25.43 | $ 52,900 |
| Southern Vermont nonmetropolitan area | 100 | 0.99 | 2.43 | $ 25.34 | $ 52,700 |
| East North Dakota nonmetropolitan area | 60 | 0.96 | 2.37 | $ 20.72 | $ 43,100 |
| Northern New Hampshire nonmetropolitan area | 30 | 0.93 | 2.29 | $ 24.47 | $ 50,890 |
Top paying nonmetropolitan areas for Education and Childcare Administrators, Preschool and Daycare:
| Nonmetropolitan area | Employment (1) | Employment per thousand jobs | Location quotient (9) | Hourly mean wage | Annual mean wage (2) |
|---|---|---|---|---|---|
| North Valley-Northern Mountains Region of California nonmetropolitan area | 60 | 0.62 | 1.53 | $ 34.41 | $ 71,580 |
| North Coast Region of California nonmetropolitan area | 70 | 0.66 | 1.63 | $ 31.87 | $ 66,300 |
| Massachusetts nonmetropolitan area | 40 | 0.63 | 1.56 | $ 29.55 | $ 61,460 |
| Hawaii / Kauai nonmetropolitan area | 60 | 0.65 | 1.59 | $ 29.44 | $ 61,230 |
| Northeast Oklahoma nonmetropolitan area | 30 | 0.29 | 0.71 | $ 28.73 | $ 59,760 |
These estimates are calculated with data collected from employers in all industry sectors, all metropolitan and nonmetropolitan areas, and all states and the District of Columbia. The top employment and wage figures are provided above. The complete list is available in the downloadable XLS files.
The percentile wage estimate is the value of a wage below which a certain percent of workers fall. The median wage is the 50th percentile wage estimate—50 percent of workers earn less than the median and 50 percent of workers earn more than the median. More about percentile wages.
(1) Estimates for detailed occupations do not sum to the totals because the totals include occupations not shown separately. Estimates do not include self-employed workers.
(2) Annual wages have been calculated by multiplying the hourly mean wage by a "year-round, full-time" hours figure of 2,080 hours; for those occupations where there is not an hourly wage published, the annual wage has been directly calculated from the reported survey data.
(3) The relative standard error (RSE) is a measure of the reliability of a survey statistic. The smaller the relative standard error, the more precise the estimate.
(7) The value is less than .005 percent of industry employment.
(8) Estimate not released.
(9) The location quotient is the ratio of the area concentration of occupational employment to the national average concentration. A location quotient greater than one indicates the occupation has a higher share of employment than average, and a location quotient less than one indicates the occupation is less prevalent in the area than average.
Other OEWS estimates and related information:
May 2022 National Occupational Employment and Wage Estimates
May 2022 State Occupational Employment and Wage Estimates
May 2022 Metropolitan and Nonmetropolitan Area Occupational Employment and Wage Estimates
May 2022 National Industry-Specific Occupational Employment and Wage Estimates
Last Modified Date: April 25, 2023