
An official website of the United States government
An official website of the United States government
The .gov means it's official.
Federal government websites often end in .gov or .mil. Before sharing sensitive information,
make sure you're on a federal government site.
The site is secure.
The
https:// ensures that you are connecting to the official website and that any
information you provide is encrypted and transmitted securely.
Provide social services to assist in rehabilitation of law offenders in custody or on probation or parole. Make recommendations for actions involving formulation of rehabilitation plan and treatment of offender, including conditional release and education and employment stipulations.
Employment estimate and mean wage estimates for Probation Officers and Correctional Treatment Specialists:
| Employment (1) | Employment RSE (3) |
Mean hourly wage |
Mean annual wage (2) |
Wage RSE (3) |
|---|---|---|---|---|
| 89,920 | 0.5 % | $ 31.21 | $ 64,920 | 0.4 % |
Percentile wage estimates for Probation Officers and Correctional Treatment Specialists:
| Percentile | 10% | 25% | 50% (Median) |
75% | 90% |
|---|---|---|---|---|---|
| Hourly Wage | $ 18.54 | $ 22.19 | $ 28.78 | $ 37.89 | $ 48.60 |
| Annual Wage (2) | $ 38,550 | $ 46,140 | $ 59,860 | $ 78,810 | $ 101,080 |
Industries with the highest published employment and wages for Probation Officers and Correctional Treatment Specialists are provided. For a list of all industries with employment in Probation Officers and Correctional Treatment Specialists, see the Create Customized Tables function.
Industries with the highest levels of employment in Probation Officers and Correctional Treatment Specialists:
| Industry | Employment (1) | Percent of industry employment | Hourly mean wage | Annual mean wage (2) |
|---|---|---|---|---|
| State Government, excluding schools and hospitals (OEWS Designation) | 45,730 | 2.15 | $ 30.22 | $ 62,860 |
| Local Government, excluding schools and hospitals (OEWS Designation) | 41,670 | 0.78 | $ 32.96 | $ 68,560 |
| Individual and Family Services | 1,090 | 0.04 | $ 18.41 | $ 38,290 |
| Facilities Support Services | 730 | 0.42 | $ 21.47 | $ 44,660 |
| Outpatient Care Centers | 80 | 0.01 | $ 22.08 | $ 45,930 |
Industries with the highest concentration of employment in Probation Officers and Correctional Treatment Specialists:
| Industry | Employment (1) | Percent of industry employment | Hourly mean wage | Annual mean wage (2) |
|---|---|---|---|---|
| State Government, excluding schools and hospitals (OEWS Designation) | 45,730 | 2.15 | $ 30.22 | $ 62,860 |
| Local Government, excluding schools and hospitals (OEWS Designation) | 41,670 | 0.78 | $ 32.96 | $ 68,560 |
| Facilities Support Services | 730 | 0.42 | $ 21.47 | $ 44,660 |
| Individual and Family Services | 1,090 | 0.04 | $ 18.41 | $ 38,290 |
| Vocational Rehabilitation Services | 40 | 0.02 | $ 20.12 | $ 41,860 |
Top paying industries for Probation Officers and Correctional Treatment Specialists:
| Industry | Employment (1) | Percent of industry employment | Hourly mean wage | Annual mean wage (2) |
|---|---|---|---|---|
| Local Government, excluding schools and hospitals (OEWS Designation) | 41,670 | 0.78 | $ 32.96 | $ 68,560 |
| Social Advocacy Organizations | (8) | (8) | $ 32.26 | $ 67,100 |
| State Government, excluding schools and hospitals (OEWS Designation) | 45,730 | 2.15 | $ 30.22 | $ 62,860 |
| Residential Intellectual and Developmental Disability, Mental Health, and Substance Abuse Facilities | 30 | 0.01 | $ 25.64 | $ 53,320 |
| Employment Services | 30 | (7) | $ 24.11 | $ 50,150 |
States and areas with the highest published employment, location quotients, and wages for Probation Officers and Correctional Treatment Specialists are provided. For a list of all areas with employment in Probation Officers and Correctional Treatment Specialists, see the Create Customized Tables function.
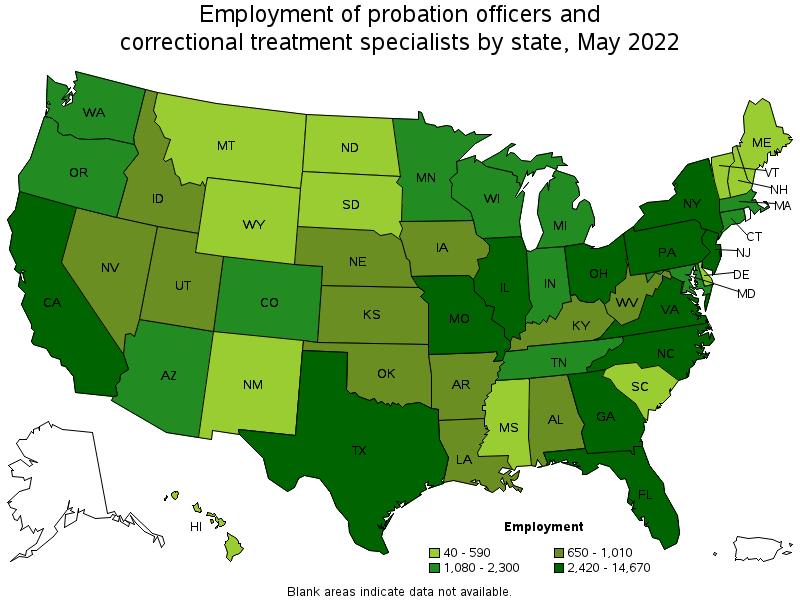
States with the highest employment level in Probation Officers and Correctional Treatment Specialists:
| State | Employment (1) | Employment per thousand jobs | Location quotient (9) | Hourly mean wage | Annual mean wage (2) |
|---|---|---|---|---|---|
| California | 14,670 | 0.83 | 1.37 | $ 46.78 | $ 97,300 |
| Texas | 7,090 | 0.55 | 0.90 | $ 23.82 | $ 49,540 |
| New York | 5,130 | 0.56 | 0.93 | $ 39.12 | $ 81,370 |
| Pennsylvania | 4,220 | 0.73 | 1.20 | $ 29.74 | $ 61,850 |
| Florida | 4,030 | 0.44 | 0.72 | $ 21.30 | $ 44,300 |
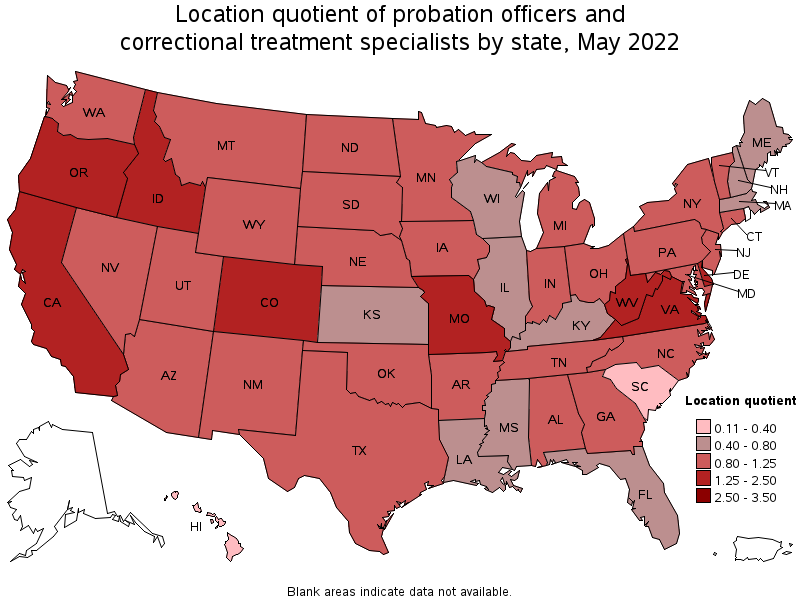
States with the highest concentration of jobs and location quotients in Probation Officers and Correctional Treatment Specialists:
| State | Employment (1) | Employment per thousand jobs | Location quotient (9) | Hourly mean wage | Annual mean wage (2) |
|---|---|---|---|---|---|
| West Virginia | 810 | 1.20 | 1.97 | $ 22.55 | $ 46,900 |
| Oregon | 1,960 | 1.03 | 1.70 | $ 33.52 | $ 69,720 |
| Missouri | 2,420 | 0.86 | 1.41 | $ 20.29 | $ 42,190 |
| California | 14,670 | 0.83 | 1.37 | $ 46.78 | $ 97,300 |
| Delaware | 370 | 0.82 | 1.35 | $ 26.14 | $ 54,360 |
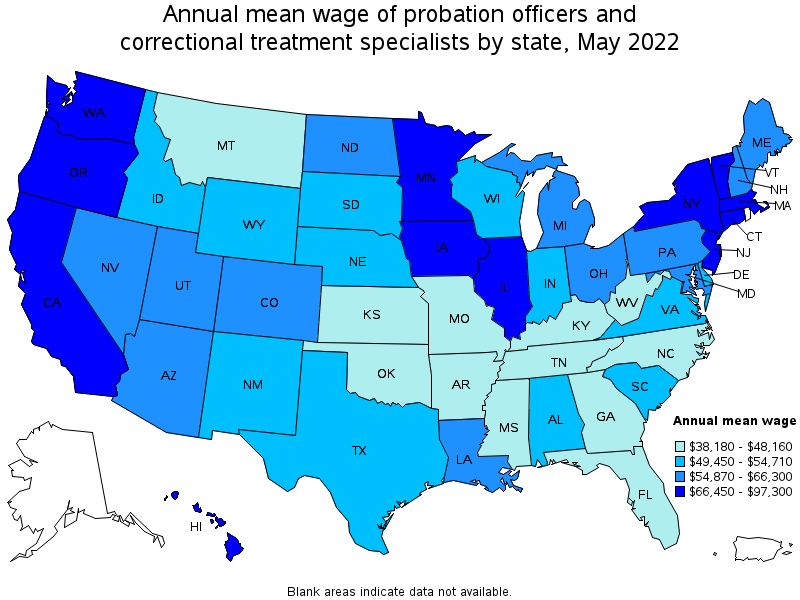
Top paying states for Probation Officers and Correctional Treatment Specialists:
| State | Employment (1) | Employment per thousand jobs | Location quotient (9) | Hourly mean wage | Annual mean wage (2) |
|---|---|---|---|---|---|
| California | 14,670 | 0.83 | 1.37 | $ 46.78 | $ 97,300 |
| Connecticut | 1,080 | 0.66 | 1.09 | $ 44.08 | $ 91,690 |
| Massachusetts | 1,170 | 0.33 | 0.54 | $ 40.08 | $ 83,370 |
| New York | 5,130 | 0.56 | 0.93 | $ 39.12 | $ 81,370 |
| New Jersey | 2,800 | 0.68 | 1.12 | $ 37.34 | $ 77,670 |
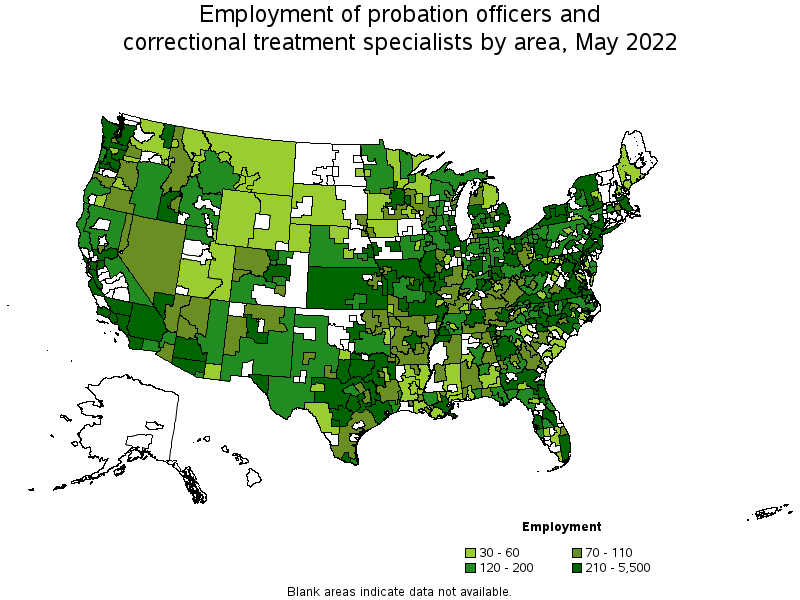
Metropolitan areas with the highest employment level in Probation Officers and Correctional Treatment Specialists:
| Metropolitan area | Employment (1) | Employment per thousand jobs | Location quotient (9) | Hourly mean wage | Annual mean wage (2) |
|---|---|---|---|---|---|
| Los Angeles-Long Beach-Anaheim, CA | 5,500 | 0.90 | 1.48 | $ 46.80 | $ 97,350 |
| New York-Newark-Jersey City, NY-NJ-PA | 4,520 | 0.49 | 0.81 | $ 40.52 | $ 84,280 |
| Philadelphia-Camden-Wilmington, PA-NJ-DE-MD | 1,890 | 0.68 | 1.12 | $ 31.86 | $ 66,270 |
| Dallas-Fort Worth-Arlington, TX | 1,880 | 0.49 | 0.81 | $ 25.40 | $ 52,840 |
| Chicago-Naperville-Elgin, IL-IN-WI | 1,750 | 0.40 | 0.65 | $ 31.24 | $ 64,990 |
| Riverside-San Bernardino-Ontario, CA | 1,670 | 1.02 | 1.68 | $ 41.80 | $ 86,930 |
| Phoenix-Mesa-Scottsdale, AZ | 1,320 | 0.60 | 0.98 | $ 29.67 | $ 61,720 |
| Houston-The Woodlands-Sugar Land, TX | 1,310 | 0.43 | 0.71 | $ 24.70 | $ 51,370 |
| Sacramento--Roseville--Arden-Arcade, CA | 1,260 | 1.22 | 2.01 | $ 50.30 | $ 104,610 |
| Minneapolis-St. Paul-Bloomington, MN-WI | 1,050 | 0.55 | 0.91 | $ 36.01 | $ 74,890 |
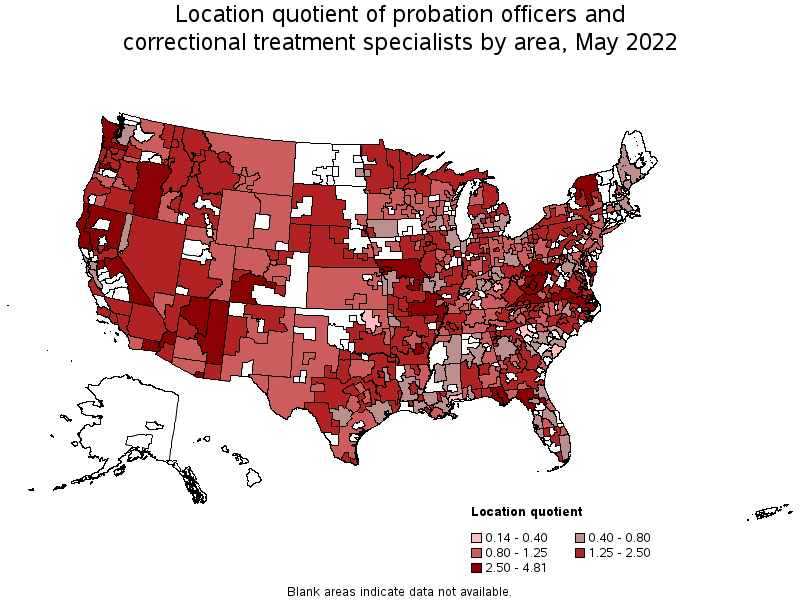
Metropolitan areas with the highest concentration of jobs and location quotients in Probation Officers and Correctional Treatment Specialists:
| Metropolitan area | Employment (1) | Employment per thousand jobs | Location quotient (9) | Hourly mean wage | Annual mean wage (2) |
|---|---|---|---|---|---|
| Jefferson City, MO | 210 | 2.93 | 4.81 | $ 19.27 | $ 40,090 |
| El Centro, CA | 150 | 2.36 | 3.88 | $ 43.47 | $ 90,410 |
| Pine Bluff, AR | 70 | 2.36 | 3.87 | $ 23.61 | $ 49,110 |
| St. Joseph, MO-KS | 110 | 2.18 | 3.59 | $ 19.73 | $ 41,040 |
| Charleston, WV | 200 | 1.99 | 3.27 | $ 24.06 | $ 50,040 |
| Beckley, WV | 80 | 1.87 | 3.07 | $ 21.57 | $ 44,870 |
| Salem, OR | 310 | 1.77 | 2.90 | $ 29.53 | $ 61,410 |
| Stockton-Lodi, CA | 460 | 1.67 | 2.75 | $ 45.73 | $ 95,120 |
| Flagstaff, AZ | 100 | 1.61 | 2.65 | $ 24.44 | $ 50,840 |
| Panama City, FL | 120 | 1.53 | 2.52 | $ 18.45 | $ 38,370 |
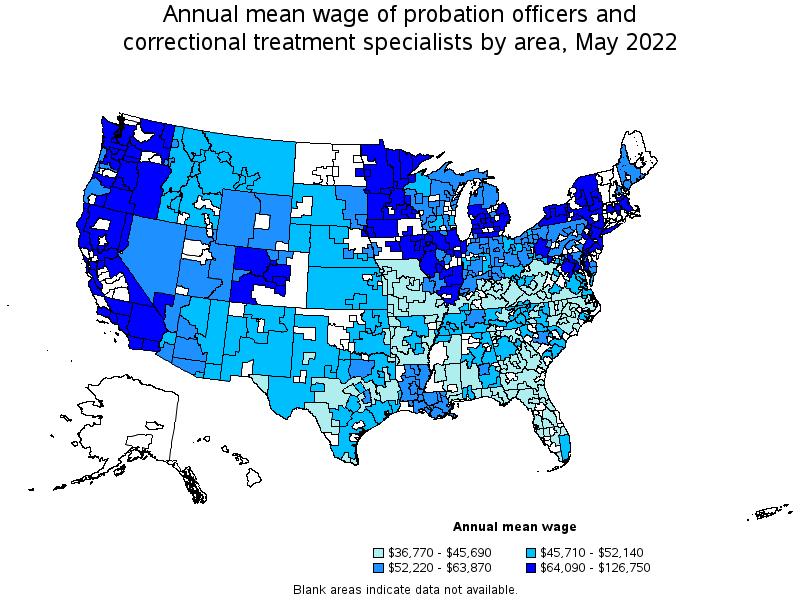
Top paying metropolitan areas for Probation Officers and Correctional Treatment Specialists:
| Metropolitan area | Employment (1) | Employment per thousand jobs | Location quotient (9) | Hourly mean wage | Annual mean wage (2) |
|---|---|---|---|---|---|
| San Jose-Sunnyvale-Santa Clara, CA | 530 | 0.47 | 0.77 | $ 60.94 | $ 126,750 |
| San Francisco-Oakland-Hayward, CA | 920 | 0.39 | 0.63 | $ 54.64 | $ 113,640 |
| Bakersfield, CA | 440 | 1.35 | 2.21 | $ 50.80 | $ 105,670 |
| Sacramento--Roseville--Arden-Arcade, CA | 1,260 | 1.22 | 2.01 | $ 50.30 | $ 104,610 |
| Salinas, CA | 210 | 1.14 | 1.87 | $ 50.09 | $ 104,190 |
| Los Angeles-Long Beach-Anaheim, CA | 5,500 | 0.90 | 1.48 | $ 46.80 | $ 97,350 |
| Santa Maria-Santa Barbara, CA | 230 | 1.13 | 1.86 | $ 45.75 | $ 95,160 |
| Stockton-Lodi, CA | 460 | 1.67 | 2.75 | $ 45.73 | $ 95,120 |
| Oxnard-Thousand Oaks-Ventura, CA | 300 | 0.96 | 1.58 | $ 44.42 | $ 92,390 |
| El Centro, CA | 150 | 2.36 | 3.88 | $ 43.47 | $ 90,410 |
Nonmetropolitan areas with the highest employment in Probation Officers and Correctional Treatment Specialists:
| Nonmetropolitan area | Employment (1) | Employment per thousand jobs | Location quotient (9) | Hourly mean wage | Annual mean wage (2) |
|---|---|---|---|---|---|
| Southeast Missouri nonmetropolitan area | 380 | 2.33 | 3.83 | $ 18.24 | $ 37,940 |
| Southeast Coastal North Carolina nonmetropolitan area | 350 | 1.41 | 2.33 | $ 21.76 | $ 45,270 |
| Southwest Virginia nonmetropolitan area | 340 | 2.90 | 4.76 | $ 20.05 | $ 41,710 |
| Western Washington nonmetropolitan area | 300 | 2.42 | 3.97 | $ 31.79 | $ 66,130 |
| Piedmont North Carolina nonmetropolitan area | 280 | 1.11 | 1.82 | $ 21.84 | $ 45,440 |
Nonmetropolitan areas with the highest concentration of jobs and location quotients in Probation Officers and Correctional Treatment Specialists:
| Nonmetropolitan area | Employment (1) | Employment per thousand jobs | Location quotient (9) | Hourly mean wage | Annual mean wage (2) |
|---|---|---|---|---|---|
| Eastern Sierra-Mother Lode Region of California nonmetropolitan area | 180 | 2.91 | 4.79 | $ 47.28 | $ 98,340 |
| Southwest Virginia nonmetropolitan area | 340 | 2.90 | 4.76 | $ 20.05 | $ 41,710 |
| North Missouri nonmetropolitan area | 270 | 2.53 | 4.16 | $ 18.44 | $ 38,360 |
| Western Washington nonmetropolitan area | 300 | 2.42 | 3.97 | $ 31.79 | $ 66,130 |
| Southeast Missouri nonmetropolitan area | 380 | 2.33 | 3.83 | $ 18.24 | $ 37,940 |
Top paying nonmetropolitan areas for Probation Officers and Correctional Treatment Specialists:
| Nonmetropolitan area | Employment (1) | Employment per thousand jobs | Location quotient (9) | Hourly mean wage | Annual mean wage (2) |
|---|---|---|---|---|---|
| Eastern Sierra-Mother Lode Region of California nonmetropolitan area | 180 | 2.91 | 4.79 | $ 47.28 | $ 98,340 |
| North Valley-Northern Mountains Region of California nonmetropolitan area | 180 | 1.74 | 2.86 | $ 41.93 | $ 87,210 |
| North Coast Region of California nonmetropolitan area | 160 | 1.56 | 2.56 | $ 39.46 | $ 82,080 |
| Southeast Minnesota nonmetropolitan area | 110 | 0.71 | 1.17 | $ 37.06 | $ 77,070 |
| South Illinois nonmetropolitan area | 100 | 1.12 | 1.83 | $ 36.62 | $ 76,180 |
These estimates are calculated with data collected from employers in all industry sectors, all metropolitan and nonmetropolitan areas, and all states and the District of Columbia. The top employment and wage figures are provided above. The complete list is available in the downloadable XLS files.
The percentile wage estimate is the value of a wage below which a certain percent of workers fall. The median wage is the 50th percentile wage estimate—50 percent of workers earn less than the median and 50 percent of workers earn more than the median. More about percentile wages.
(1) Estimates for detailed occupations do not sum to the totals because the totals include occupations not shown separately. Estimates do not include self-employed workers.
(2) Annual wages have been calculated by multiplying the hourly mean wage by a "year-round, full-time" hours figure of 2,080 hours; for those occupations where there is not an hourly wage published, the annual wage has been directly calculated from the reported survey data.
(3) The relative standard error (RSE) is a measure of the reliability of a survey statistic. The smaller the relative standard error, the more precise the estimate.
(7) The value is less than .005 percent of industry employment.
(8) Estimate not released.
(9) The location quotient is the ratio of the area concentration of occupational employment to the national average concentration. A location quotient greater than one indicates the occupation has a higher share of employment than average, and a location quotient less than one indicates the occupation is less prevalent in the area than average.
Other OEWS estimates and related information:
May 2022 National Occupational Employment and Wage Estimates
May 2022 State Occupational Employment and Wage Estimates
May 2022 Metropolitan and Nonmetropolitan Area Occupational Employment and Wage Estimates
May 2022 National Industry-Specific Occupational Employment and Wage Estimates
Last Modified Date: April 25, 2023