
An official website of the United States government
An official website of the United States government
The .gov means it's official.
Federal government websites often end in .gov or .mil. Before sharing sensitive information,
make sure you're on a federal government site.
The site is secure.
The
https:// ensures that you are connecting to the official website and that any
information you provide is encrypted and transmitted securely.
All healthcare diagnosing or treating practitioners not listed separately.
Employment estimate and mean wage estimates for Healthcare Diagnosing or Treating Practitioners, All Other:
| Employment (1) | Employment RSE (3) |
Mean hourly wage |
Mean annual wage (2) |
Wage RSE (3) |
|---|---|---|---|---|
| 30,080 | 2.3 % | $ 59.60 | $ 123,960 | 5.1 % |
Percentile wage estimates for Healthcare Diagnosing or Treating Practitioners, All Other:
| Percentile | 10% | 25% | 50% (Median) |
75% | 90% |
|---|---|---|---|---|---|
| Hourly Wage | $ 29.09 | $ 36.44 | $ 51.07 | $ 72.82 | $ 93.06 |
| Annual Wage (2) | $ 60,520 | $ 75,800 | $ 106,230 | $ 151,470 | $ 193,560 |
Industries with the highest published employment and wages for Healthcare Diagnosing or Treating Practitioners, All Other are provided. For a list of all industries with employment in Healthcare Diagnosing or Treating Practitioners, All Other, see the Create Customized Tables function.
Industries with the highest levels of employment in Healthcare Diagnosing or Treating Practitioners, All Other:
| Industry | Employment (1) | Percent of industry employment | Hourly mean wage | Annual mean wage (2) |
|---|---|---|---|---|
| Federal Executive Branch (OEWS Designation) | 17,800 | 0.85 | $ 54.95 | $ 114,290 |
| Offices of Other Health Practitioners | 1,990 | 0.19 | $ 61.26 | $ 127,410 |
| Colleges, Universities, and Professional Schools | 1,130 | 0.04 | $ 37.98 | $ 79,000 |
| Management of Companies and Enterprises | 280 | 0.01 | $ 62.23 | $ 129,430 |
| Local Government, excluding schools and hospitals (OEWS Designation) | 270 | 0.01 | $ 68.36 | $ 142,190 |
Industries with the highest concentration of employment in Healthcare Diagnosing or Treating Practitioners, All Other:
| Industry | Employment (1) | Percent of industry employment | Hourly mean wage | Annual mean wage (2) |
|---|---|---|---|---|
| Federal Executive Branch (OEWS Designation) | 17,800 | 0.85 | $ 54.95 | $ 114,290 |
| Offices of Other Health Practitioners | 1,990 | 0.19 | $ 61.26 | $ 127,410 |
| Colleges, Universities, and Professional Schools | 1,130 | 0.04 | $ 37.98 | $ 79,000 |
| Medical and Diagnostic Laboratories | 120 | 0.04 | $ 78.26 | $ 162,770 |
| Psychiatric and Substance Abuse Hospitals | 80 | 0.03 | $ 23.47 | $ 48,810 |
Top paying industries for Healthcare Diagnosing or Treating Practitioners, All Other:
| Industry | Employment (1) | Percent of industry employment | Hourly mean wage | Annual mean wage (2) |
|---|---|---|---|---|
| Merchant Wholesalers, Nondurable Goods (4242 and 4246 only) | 70 | 0.02 | $ 83.61 | $ 173,900 |
| Medical and Diagnostic Laboratories | 120 | 0.04 | $ 78.26 | $ 162,770 |
| Agencies, Brokerages, and Other Insurance Related Activities | 70 | 0.01 | $ 77.21 | $ 160,590 |
| Local Government, excluding schools and hospitals (OEWS Designation) | 270 | 0.01 | $ 68.36 | $ 142,190 |
| Management of Companies and Enterprises | 280 | 0.01 | $ 62.23 | $ 129,430 |
States and areas with the highest published employment, location quotients, and wages for Healthcare Diagnosing or Treating Practitioners, All Other are provided. For a list of all areas with employment in Healthcare Diagnosing or Treating Practitioners, All Other, see the Create Customized Tables function.
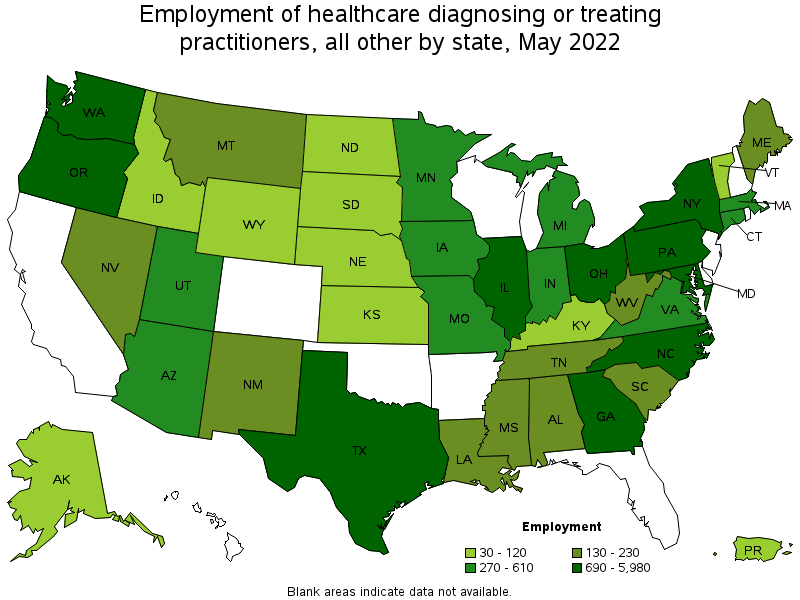
States with the highest employment level in Healthcare Diagnosing or Treating Practitioners, All Other:
| State | Employment (1) | Employment per thousand jobs | Location quotient (9) | Hourly mean wage | Annual mean wage (2) |
|---|---|---|---|---|---|
| Maryland | 5,980 | 2.26 | 11.13 | $ 69.35 | $ 144,260 |
| Georgia | 2,790 | 0.60 | 2.97 | $ 58.39 | $ 121,450 |
| Texas | 2,050 | 0.16 | 0.78 | $ 57.95 | $ 120,530 |
| Pennsylvania | 1,200 | 0.21 | 1.02 | $ 39.14 | $ 81,400 |
| Washington | 1,100 | 0.32 | 1.59 | $ 62.71 | $ 130,440 |
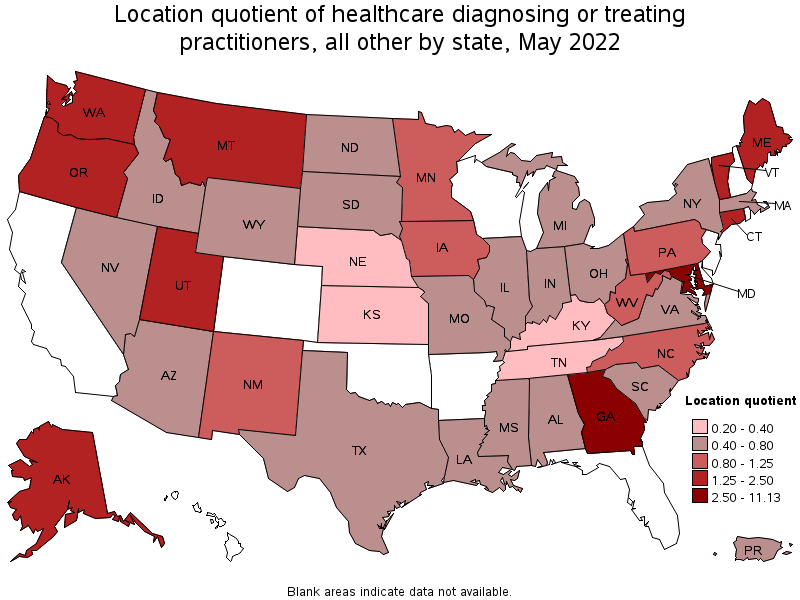
States with the highest concentration of jobs and location quotients in Healthcare Diagnosing or Treating Practitioners, All Other:
| State | Employment (1) | Employment per thousand jobs | Location quotient (9) | Hourly mean wage | Annual mean wage (2) |
|---|---|---|---|---|---|
| Maryland | 5,980 | 2.26 | 11.13 | $ 69.35 | $ 144,260 |
| Georgia | 2,790 | 0.60 | 2.97 | $ 58.39 | $ 121,450 |
| Utah | 610 | 0.38 | 1.86 | (8) | (8) |
| Maine | 230 | 0.38 | 1.85 | $ 43.67 | $ 90,820 |
| Oregon | 710 | 0.37 | 1.83 | $ 51.33 | $ 106,760 |
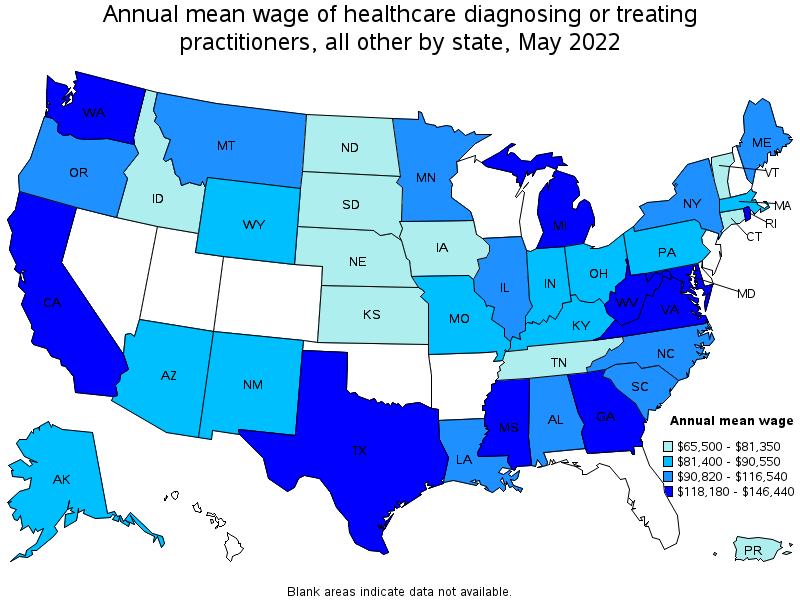
Top paying states for Healthcare Diagnosing or Treating Practitioners, All Other:
| State | Employment (1) | Employment per thousand jobs | Location quotient (9) | Hourly mean wage | Annual mean wage (2) |
|---|---|---|---|---|---|
| Virginia | 570 | 0.15 | 0.72 | $ 70.41 | $ 146,440 |
| Maryland | 5,980 | 2.26 | 11.13 | $ 69.35 | $ 144,260 |
| Washington | 1,100 | 0.32 | 1.59 | $ 62.71 | $ 130,440 |
| Mississippi | 130 | 0.12 | 0.57 | $ 62.43 | $ 129,850 |
| California | (8) | (8) | (8) | $ 61.36 | $ 127,620 |
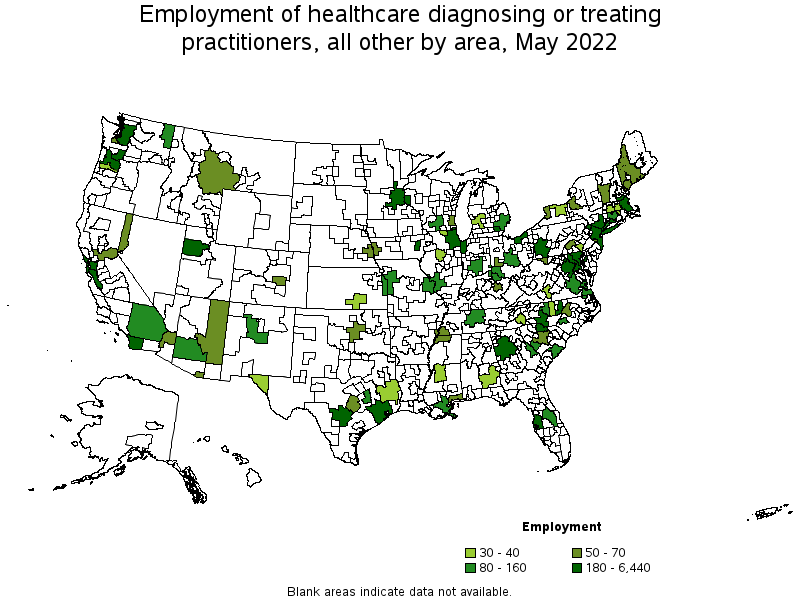
Metropolitan areas with the highest employment level in Healthcare Diagnosing or Treating Practitioners, All Other:
| Metropolitan area | Employment (1) | Employment per thousand jobs | Location quotient (9) | Hourly mean wage | Annual mean wage (2) |
|---|---|---|---|---|---|
| Washington-Arlington-Alexandria, DC-VA-MD-WV | 6,440 | 2.13 | 10.46 | $ 69.94 | $ 145,470 |
| Atlanta-Sandy Springs-Roswell, GA | 2,510 | 0.92 | 4.52 | $ 58.82 | $ 122,340 |
| New York-Newark-Jersey City, NY-NJ-PA | 890 | 0.10 | 0.47 | $ 59.78 | $ 124,330 |
| Seattle-Tacoma-Bellevue, WA | 830 | 0.41 | 2.01 | $ 66.03 | $ 137,340 |
| Chicago-Naperville-Elgin, IL-IN-WI | 630 | 0.14 | 0.70 | $ 47.51 | $ 98,830 |
| Portland-Vancouver-Hillsboro, OR-WA | 580 | 0.49 | 2.43 | $ 51.20 | $ 106,490 |
| Houston-The Woodlands-Sugar Land, TX | 530 | 0.17 | 0.85 | $ 44.64 | $ 92,860 |
| Boston-Cambridge-Nashua, MA-NH | 520 | 0.19 | 0.94 | $ 46.62 | $ 96,970 |
| Minneapolis-St. Paul-Bloomington, MN-WI | 390 | 0.21 | 1.03 | $ 47.67 | $ 99,160 |
| Durham-Chapel Hill, NC | 390 | 1.18 | 5.79 | $ 51.38 | $ 106,880 |
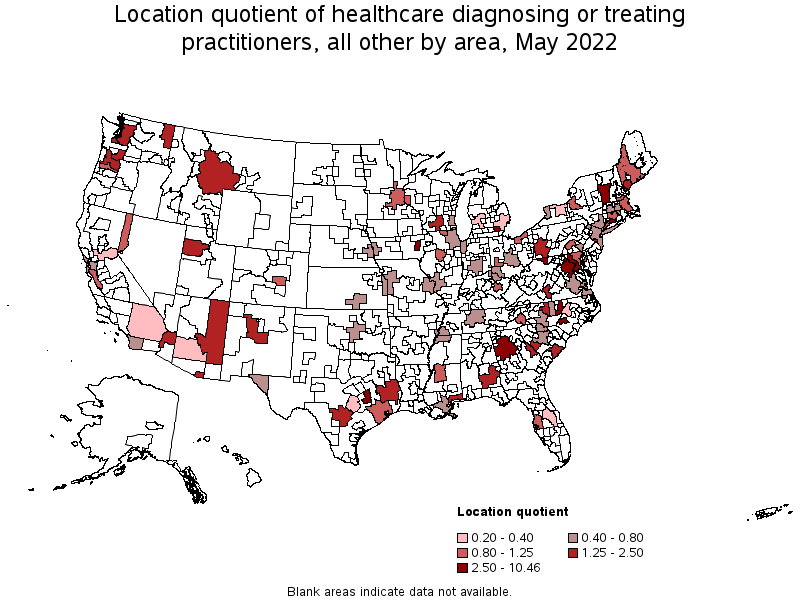
Metropolitan areas with the highest concentration of jobs and location quotients in Healthcare Diagnosing or Treating Practitioners, All Other:
| Metropolitan area | Employment (1) | Employment per thousand jobs | Location quotient (9) | Hourly mean wage | Annual mean wage (2) |
|---|---|---|---|---|---|
| Washington-Arlington-Alexandria, DC-VA-MD-WV | 6,440 | 2.13 | 10.46 | $ 69.94 | $ 145,470 |
| Iowa City, IA | 180 | 1.97 | 9.66 | $ 41.14 | $ 85,570 |
| Durham-Chapel Hill, NC | 390 | 1.18 | 5.79 | $ 51.38 | $ 106,880 |
| Ann Arbor, MI | 210 | 0.98 | 4.83 | (8) | (8) |
| Atlanta-Sandy Springs-Roswell, GA | 2,510 | 0.92 | 4.52 | $ 58.82 | $ 122,340 |
| Morgantown, WV | 50 | 0.84 | 4.12 | $ 58.37 | $ 121,410 |
| New Haven, CT | 190 | 0.65 | 3.20 | $ 40.74 | $ 84,740 |
| College Station-Bryan, TX | 80 | 0.61 | 2.99 | $ 36.61 | $ 76,160 |
| Fayetteville, NC | 80 | 0.59 | 2.90 | $ 45.46 | $ 94,560 |
| Portland-Vancouver-Hillsboro, OR-WA | 580 | 0.49 | 2.43 | $ 51.20 | $ 106,490 |
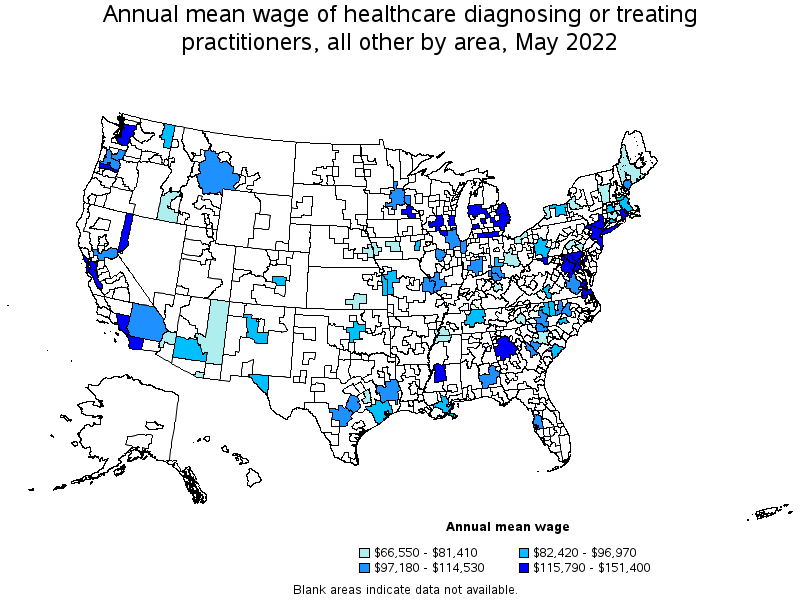
Top paying metropolitan areas for Healthcare Diagnosing or Treating Practitioners, All Other:
| Metropolitan area | Employment (1) | Employment per thousand jobs | Location quotient (9) | Hourly mean wage | Annual mean wage (2) |
|---|---|---|---|---|---|
| Rochester, MN | (8) | (8) | (8) | $ 72.79 | $ 151,400 |
| Washington-Arlington-Alexandria, DC-VA-MD-WV | 6,440 | 2.13 | 10.46 | $ 69.94 | $ 145,470 |
| Seattle-Tacoma-Bellevue, WA | 830 | 0.41 | 2.01 | $ 66.03 | $ 137,340 |
| Reno, NV | 60 | 0.24 | 1.17 | $ 65.68 | $ 136,610 |
| Milwaukee-Waukesha-West Allis, WI | 70 | 0.09 | 0.46 | $ 64.98 | $ 135,150 |
| Baltimore-Columbia-Towson, MD | 280 | 0.21 | 1.05 | $ 64.07 | $ 133,260 |
| Jackson, MS | 40 | 0.18 | 0.89 | $ 62.53 | $ 130,050 |
| Madison, WI | 100 | 0.26 | 1.29 | $ 60.76 | $ 126,380 |
| Rockford, IL | 30 | 0.24 | 1.18 | $ 60.55 | $ 125,940 |
| New York-Newark-Jersey City, NY-NJ-PA | 890 | 0.10 | 0.47 | $ 59.78 | $ 124,330 |
Nonmetropolitan areas with the highest employment in Healthcare Diagnosing or Treating Practitioners, All Other:
| Nonmetropolitan area | Employment (1) | Employment per thousand jobs | Location quotient (9) | Hourly mean wage | Annual mean wage (2) |
|---|---|---|---|---|---|
| Southern Vermont nonmetropolitan area | 60 | 0.59 | 2.91 | $ 35.48 | $ 73,800 |
| Southwest Montana nonmetropolitan area | 50 | 0.35 | 1.70 | $ 49.35 | $ 102,650 |
| Southwest Maine nonmetropolitan area | 50 | 0.25 | 1.24 | $ 37.84 | $ 78,710 |
| Arizona nonmetropolitan area | 50 | 0.49 | 2.41 | $ 36.14 | $ 75,160 |
| Southeast Alabama nonmetropolitan area | 30 | 0.39 | 1.93 | $ 46.72 | $ 97,180 |
Nonmetropolitan areas with the highest concentration of jobs and location quotients in Healthcare Diagnosing or Treating Practitioners, All Other:
| Nonmetropolitan area | Employment (1) | Employment per thousand jobs | Location quotient (9) | Hourly mean wage | Annual mean wage (2) |
|---|---|---|---|---|---|
| Southern Vermont nonmetropolitan area | 60 | 0.59 | 2.91 | $ 35.48 | $ 73,800 |
| Arizona nonmetropolitan area | 50 | 0.49 | 2.41 | $ 36.14 | $ 75,160 |
| Southeast Alabama nonmetropolitan area | 30 | 0.39 | 1.93 | $ 46.72 | $ 97,180 |
| Southwest Montana nonmetropolitan area | 50 | 0.35 | 1.70 | $ 49.35 | $ 102,650 |
| Big Thicket Region of Texas nonmetropolitan area | 30 | 0.29 | 1.44 | $ 54.22 | $ 112,770 |
Top paying nonmetropolitan areas for Healthcare Diagnosing or Treating Practitioners, All Other:
| Nonmetropolitan area | Employment (1) | Employment per thousand jobs | Location quotient (9) | Hourly mean wage | Annual mean wage (2) |
|---|---|---|---|---|---|
| Balance of Lower Peninsula of Michigan nonmetropolitan area | (8) | (8) | (8) | $ 70.35 | $ 146,320 |
| Big Thicket Region of Texas nonmetropolitan area | 30 | 0.29 | 1.44 | $ 54.22 | $ 112,770 |
| Southwest Montana nonmetropolitan area | 50 | 0.35 | 1.70 | $ 49.35 | $ 102,650 |
| Southeast Alabama nonmetropolitan area | 30 | 0.39 | 1.93 | $ 46.72 | $ 97,180 |
| Southwest Maine nonmetropolitan area | 50 | 0.25 | 1.24 | $ 37.84 | $ 78,710 |
These estimates are calculated with data collected from employers in all industry sectors, all metropolitan and nonmetropolitan areas, and all states and the District of Columbia. The top employment and wage figures are provided above. The complete list is available in the downloadable XLS files.
The percentile wage estimate is the value of a wage below which a certain percent of workers fall. The median wage is the 50th percentile wage estimate—50 percent of workers earn less than the median and 50 percent of workers earn more than the median. More about percentile wages.
(1) Estimates for detailed occupations do not sum to the totals because the totals include occupations not shown separately. Estimates do not include self-employed workers.
(2) Annual wages have been calculated by multiplying the hourly mean wage by a "year-round, full-time" hours figure of 2,080 hours; for those occupations where there is not an hourly wage published, the annual wage has been directly calculated from the reported survey data.
(3) The relative standard error (RSE) is a measure of the reliability of a survey statistic. The smaller the relative standard error, the more precise the estimate.
(8) Estimate not released.
(9) The location quotient is the ratio of the area concentration of occupational employment to the national average concentration. A location quotient greater than one indicates the occupation has a higher share of employment than average, and a location quotient less than one indicates the occupation is less prevalent in the area than average.
Other OEWS estimates and related information:
May 2022 National Occupational Employment and Wage Estimates
May 2022 State Occupational Employment and Wage Estimates
May 2022 Metropolitan and Nonmetropolitan Area Occupational Employment and Wage Estimates
May 2022 National Industry-Specific Occupational Employment and Wage Estimates
Last Modified Date: April 25, 2023