
An official website of the United States government
An official website of the United States government
The .gov means it's official.
Federal government websites often end in .gov or .mil. Before sharing sensitive information,
make sure you're on a federal government site.
The site is secure.
The
https:// ensures that you are connecting to the official website and that any
information you provide is encrypted and transmitted securely.
Provide or assist with basic care or support under the direction of onsite licensed nursing staff. Perform duties such as monitoring of health status, feeding, bathing, dressing, grooming, toileting, or ambulation of patients in a health or nursing facility. May include medication administration and other health-related tasks. Includes nursing care attendants, nursing aides, and nursing attendants. Excludes �Home Health Aides� (31-1121), �Personal Care Aides� (31-1122), �Orderlies� (31-1132), and �Psychiatric Aides� (31-1133).
Employment estimate and mean wage estimates for Nursing Assistants:
| Employment (1) | Employment RSE (3) |
Mean hourly wage |
Mean annual wage (2) |
Wage RSE (3) |
|---|---|---|---|---|
| 1,310,090 | 0.4 % | $ 17.41 | $ 36,220 | 0.2 % |
Percentile wage estimates for Nursing Assistants:
| Percentile | 10% | 25% | 50% (Median) |
75% | 90% |
|---|---|---|---|---|---|
| Hourly Wage | $ 13.48 | $ 14.79 | $ 17.19 | $ 18.87 | $ 22.09 |
| Annual Wage (2) | $ 28,030 | $ 30,770 | $ 35,760 | $ 39,260 | $ 45,940 |
Industries with the highest published employment and wages for Nursing Assistants are provided. For a list of all industries with employment in Nursing Assistants, see the Create Customized Tables function.
Industries with the highest levels of employment in Nursing Assistants:
| Industry | Employment (1) | Percent of industry employment | Hourly mean wage | Annual mean wage (2) |
|---|---|---|---|---|
| Nursing Care Facilities (Skilled Nursing Facilities) | 447,940 | 33.35 | $ 16.90 | $ 35,160 |
| General Medical and Surgical Hospitals | 396,060 | 7.08 | $ 18.18 | $ 37,820 |
| Continuing Care Retirement Communities and Assisted Living Facilities for the Elderly | 140,910 | 16.02 | $ 16.41 | $ 34,130 |
| Home Health Care Services | 81,640 | 5.32 | $ 15.46 | $ 32,160 |
| Employment Services | 52,310 | 1.33 | $ 19.44 | $ 40,430 |
Industries with the highest concentration of employment in Nursing Assistants:
| Industry | Employment (1) | Percent of industry employment | Hourly mean wage | Annual mean wage (2) |
|---|---|---|---|---|
| Nursing Care Facilities (Skilled Nursing Facilities) | 447,940 | 33.35 | $ 16.90 | $ 35,160 |
| Continuing Care Retirement Communities and Assisted Living Facilities for the Elderly | 140,910 | 16.02 | $ 16.41 | $ 34,130 |
| Specialty (except Psychiatric and Substance Abuse) Hospitals | 27,270 | 10.07 | $ 18.64 | $ 38,780 |
| General Medical and Surgical Hospitals | 396,060 | 7.08 | $ 18.18 | $ 37,820 |
| Home Health Care Services | 81,640 | 5.32 | $ 15.46 | $ 32,160 |
Top paying industries for Nursing Assistants:
| Industry | Employment (1) | Percent of industry employment | Hourly mean wage | Annual mean wage (2) |
|---|---|---|---|---|
| Junior Colleges | 80 | 0.01 | $ 33.25 | $ 69,150 |
| Offices of Dentists | 400 | 0.04 | $ 26.86 | $ 55,870 |
| Technical and Trade Schools | 110 | 0.08 | $ 24.17 | $ 50,270 |
| Colleges, Universities, and Professional Schools | 5,010 | 0.17 | $ 23.95 | $ 49,820 |
| Scientific Research and Development Services | (8) | (8) | $ 23.09 | $ 48,020 |
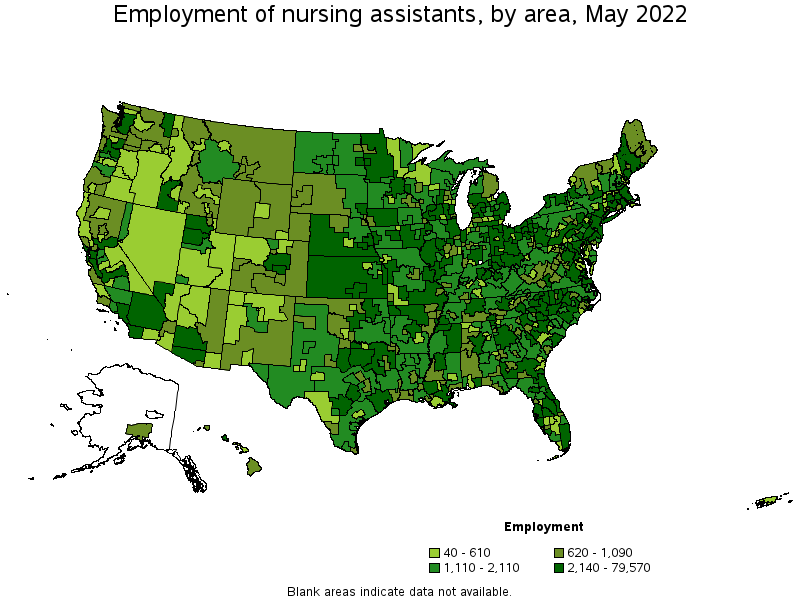
States and areas with the highest published employment, location quotients, and wages for Nursing Assistants are provided. For a list of all areas with employment in Nursing Assistants, see the Create Customized Tables function.
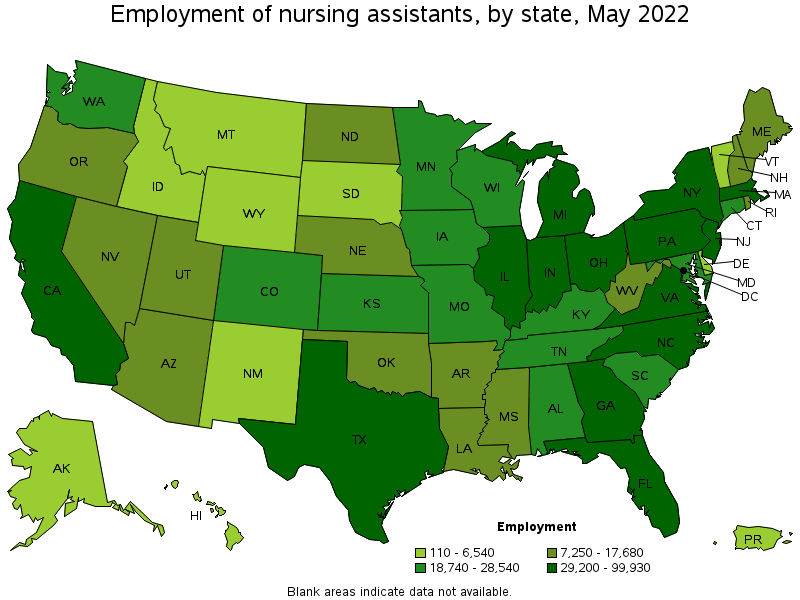
States with the highest employment level in Nursing Assistants:
| State | Employment (1) | Employment per thousand jobs | Location quotient (9) | Hourly mean wage | Annual mean wage (2) |
|---|---|---|---|---|---|
| California | 99,930 | 5.67 | 0.64 | $ 20.95 | $ 43,570 |
| Florida | 89,110 | 9.67 | 1.09 | $ 16.05 | $ 33,390 |
| Texas | 81,170 | 6.25 | 0.71 | $ 15.46 | $ 32,150 |
| New York | 80,100 | 8.79 | 0.99 | $ 20.89 | $ 43,450 |
| Pennsylvania | 66,800 | 11.50 | 1.30 | $ 17.50 | $ 36,400 |
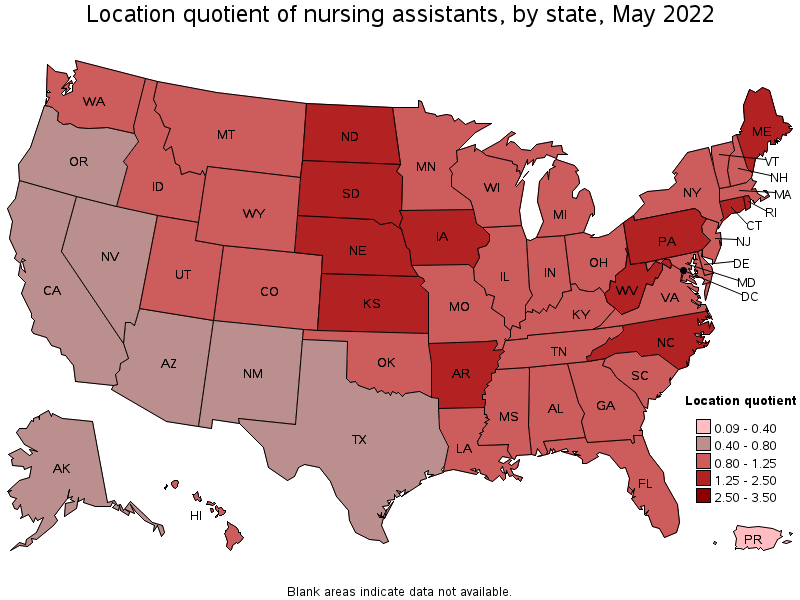
States with the highest concentration of jobs and location quotients in Nursing Assistants:
| State | Employment (1) | Employment per thousand jobs | Location quotient (9) | Hourly mean wage | Annual mean wage (2) |
|---|---|---|---|---|---|
| Rhode Island | 8,730 | 18.22 | 2.06 | $ 18.99 | $ 39,490 |
| North Dakota | 7,350 | 18.13 | 2.05 | $ 18.37 | $ 38,200 |
| Nebraska | 15,120 | 15.58 | 1.76 | $ 16.84 | $ 35,020 |
| Kansas | 21,310 | 15.44 | 1.74 | $ 16.10 | $ 33,490 |
| Iowa | 20,880 | 13.73 | 1.55 | $ 16.89 | $ 35,120 |
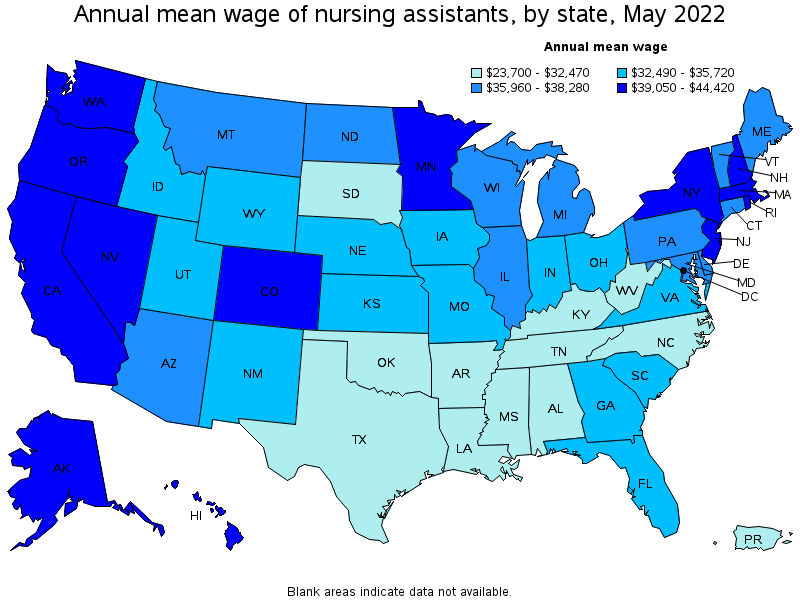
Top paying states for Nursing Assistants:
| State | Employment (1) | Employment per thousand jobs | Location quotient (9) | Hourly mean wage | Annual mean wage (2) |
|---|---|---|---|---|---|
| Alaska | 1,770 | 5.77 | 0.65 | $ 21.35 | $ 44,420 |
| District of Columbia | 2,950 | 4.28 | 0.48 | $ 21.07 | $ 43,820 |
| California | 99,930 | 5.67 | 0.64 | $ 20.95 | $ 43,570 |
| New York | 80,100 | 8.79 | 0.99 | $ 20.89 | $ 43,450 |
| Oregon | 12,450 | 6.57 | 0.74 | $ 20.65 | $ 42,960 |
Metropolitan areas with the highest employment level in Nursing Assistants:
| Metropolitan area | Employment (1) | Employment per thousand jobs | Location quotient (9) | Hourly mean wage | Annual mean wage (2) |
|---|---|---|---|---|---|
| New York-Newark-Jersey City, NY-NJ-PA | 79,570 | 8.66 | 0.98 | $ 21.50 | $ 44,720 |
| Los Angeles-Long Beach-Anaheim, CA | 39,710 | 6.51 | 0.73 | $ 20.49 | $ 42,620 |
| Chicago-Naperville-Elgin, IL-IN-WI | 37,030 | 8.39 | 0.95 | $ 18.37 | $ 38,200 |
| Philadelphia-Camden-Wilmington, PA-NJ-DE-MD | 32,440 | 11.71 | 1.32 | $ 18.17 | $ 37,780 |
| Boston-Cambridge-Nashua, MA-NH | 26,140 | 9.67 | 1.09 | $ 20.42 | $ 42,480 |
| Miami-Fort Lauderdale-West Palm Beach, FL | 22,600 | 8.61 | 0.97 | $ 16.17 | $ 33,640 |
| Washington-Arlington-Alexandria, DC-VA-MD-WV | 21,980 | 7.26 | 0.82 | $ 18.33 | $ 38,120 |
| Dallas-Fort Worth-Arlington, TX | 21,940 | 5.77 | 0.65 | $ 16.34 | $ 34,000 |
| Atlanta-Sandy Springs-Roswell, GA | 20,820 | 7.63 | 0.86 | $ 17.12 | $ 35,610 |
| Houston-The Woodlands-Sugar Land, TX | 16,990 | 5.56 | 0.63 | $ 16.18 | $ 33,660 |
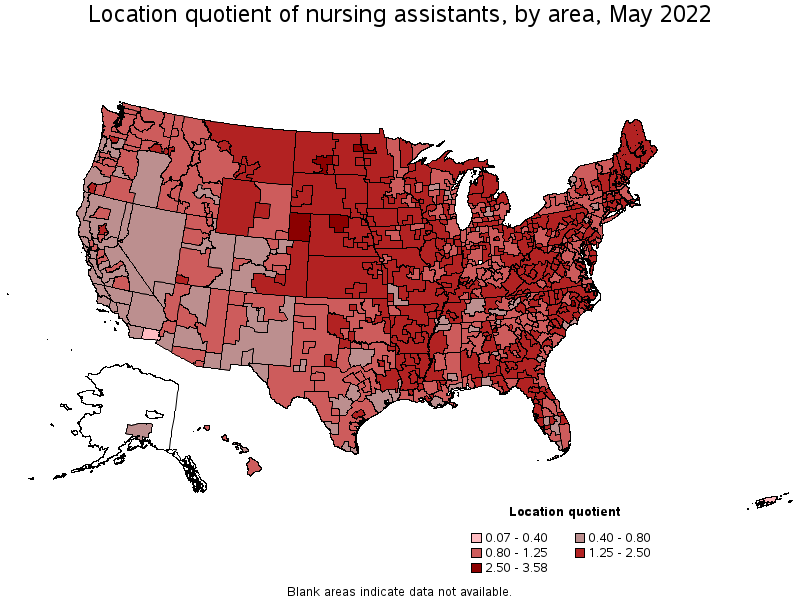
Metropolitan areas with the highest concentration of jobs and location quotients in Nursing Assistants:
| Metropolitan area | Employment (1) | Employment per thousand jobs | Location quotient (9) | Hourly mean wage | Annual mean wage (2) |
|---|---|---|---|---|---|
| Goldsboro, NC | 1,250 | 31.69 | 3.58 | $ 15.31 | $ 31,850 |
| Bismarck, ND | 1,810 | 25.37 | 2.86 | $ 18.24 | $ 37,930 |
| Rome, GA | 880 | 22.23 | 2.51 | $ 14.13 | $ 29,400 |
| Grand Forks, ND-MN | 1,090 | 22.16 | 2.50 | $ 18.41 | $ 38,280 |
| Sebring, FL | 560 | 21.30 | 2.40 | $ 14.40 | $ 29,950 |
| Greenville, NC | 1,640 | 21.08 | 2.38 | $ 15.31 | $ 31,840 |
| Bloomsburg-Berwick, PA | 840 | 21.06 | 2.38 | $ 15.87 | $ 33,000 |
| Hot Springs, AR | 790 | 20.95 | 2.36 | $ 13.77 | $ 28,640 |
| Homosassa Springs, FL | 660 | 19.69 | 2.22 | $ 14.33 | $ 29,800 |
| Gainesville, FL | 2,610 | 18.98 | 2.14 | $ 16.56 | $ 34,430 |
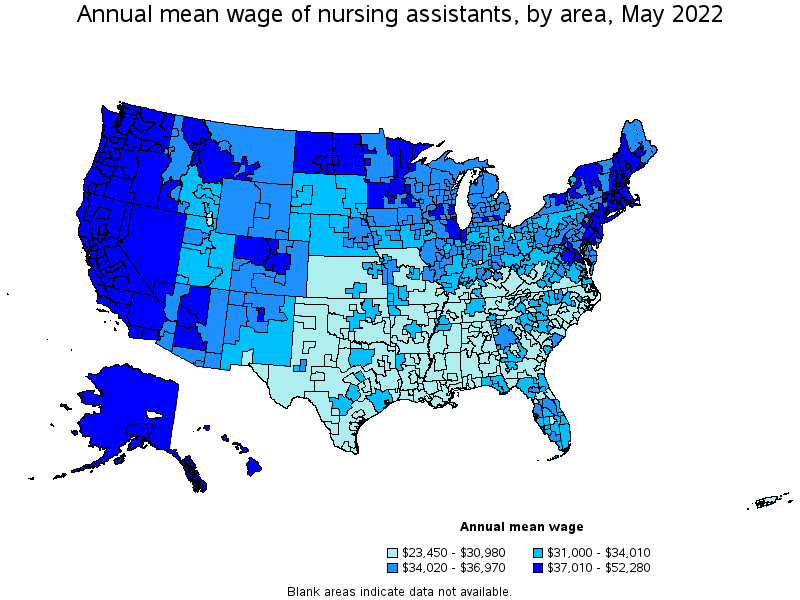
Top paying metropolitan areas for Nursing Assistants:
| Metropolitan area | Employment (1) | Employment per thousand jobs | Location quotient (9) | Hourly mean wage | Annual mean wage (2) |
|---|---|---|---|---|---|
| San Francisco-Oakland-Hayward, CA | 10,980 | 4.59 | 0.52 | $ 25.13 | $ 52,280 |
| San Jose-Sunnyvale-Santa Clara, CA | 5,230 | 4.66 | 0.53 | $ 24.81 | $ 51,600 |
| Minneapolis-St. Paul-Bloomington, MN-WI | 13,820 | 7.33 | 0.83 | $ 22.36 | $ 46,520 |
| Salem, OR | 1,270 | 7.26 | 0.82 | $ 21.59 | $ 44,900 |
| New York-Newark-Jersey City, NY-NJ-PA | 79,570 | 8.66 | 0.98 | $ 21.50 | $ 44,720 |
| Seattle-Tacoma-Bellevue, WA | 15,890 | 7.80 | 0.88 | $ 21.40 | $ 44,520 |
| Santa Cruz-Watsonville, CA | 370 | 3.81 | 0.43 | $ 21.36 | $ 44,440 |
| Napa, CA | 530 | 7.11 | 0.80 | $ 21.24 | $ 44,180 |
| Sacramento--Roseville--Arden-Arcade, CA | 5,090 | 4.95 | 0.56 | $ 21.17 | $ 44,040 |
| Portland-Vancouver-Hillsboro, OR-WA | 7,480 | 6.34 | 0.72 | $ 21.15 | $ 44,000 |
Nonmetropolitan areas with the highest employment in Nursing Assistants:
| Nonmetropolitan area | Employment (1) | Employment per thousand jobs | Location quotient (9) | Hourly mean wage | Annual mean wage (2) |
|---|---|---|---|---|---|
| Kansas nonmetropolitan area | 7,330 | 19.12 | 2.16 | $ 14.81 | $ 30,800 |
| Piedmont North Carolina nonmetropolitan area | 4,800 | 19.19 | 2.17 | $ 14.77 | $ 30,710 |
| North Northeastern Ohio nonmetropolitan area (noncontiguous) | 4,080 | 12.68 | 1.43 | $ 15.63 | $ 32,510 |
| Southeast Coastal North Carolina nonmetropolitan area | 4,070 | 16.62 | 1.88 | $ 13.92 | $ 28,960 |
| Balance of Lower Peninsula of Michigan nonmetropolitan area | 3,100 | 11.83 | 1.33 | $ 16.92 | $ 35,180 |
Nonmetropolitan areas with the highest concentration of jobs and location quotients in Nursing Assistants:
| Nonmetropolitan area | Employment (1) | Employment per thousand jobs | Location quotient (9) | Hourly mean wage | Annual mean wage (2) |
|---|---|---|---|---|---|
| Northwest Nebraska nonmetropolitan area | 1,010 | 26.62 | 3.01 | $ 16.32 | $ 33,940 |
| Northeast Louisiana nonmetropolitan area | 1,330 | 21.32 | 2.41 | $ 11.92 | $ 24,800 |
| Northeast Nebraska nonmetropolitan area | 1,910 | 20.72 | 2.34 | $ 16.64 | $ 34,610 |
| South Nebraska nonmetropolitan area | 3,000 | 20.59 | 2.32 | $ 16.31 | $ 33,930 |
| North Arkansas nonmetropolitan area | 2,360 | 20.24 | 2.28 | $ 13.62 | $ 28,320 |
Top paying nonmetropolitan areas for Nursing Assistants:
| Nonmetropolitan area | Employment (1) | Employment per thousand jobs | Location quotient (9) | Hourly mean wage | Annual mean wage (2) |
|---|---|---|---|---|---|
| Alaska nonmetropolitan area | (8) | (8) | (8) | $ 22.68 | $ 47,170 |
| North Valley-Northern Mountains Region of California nonmetropolitan area | 650 | 6.45 | 0.73 | $ 20.34 | $ 42,300 |
| Massachusetts nonmetropolitan area | 600 | 9.80 | 1.11 | $ 20.14 | $ 41,900 |
| Eastern Sierra-Mother Lode Region of California nonmetropolitan area | 300 | 5.00 | 0.56 | $ 19.99 | $ 41,570 |
| North Coast Region of California nonmetropolitan area | 600 | 5.72 | 0.65 | $ 19.80 | $ 41,190 |
These estimates are calculated with data collected from employers in all industry sectors, all metropolitan and nonmetropolitan areas, and all states and the District of Columbia. The top employment and wage figures are provided above. The complete list is available in the downloadable XLS files.
The percentile wage estimate is the value of a wage below which a certain percent of workers fall. The median wage is the 50th percentile wage estimate—50 percent of workers earn less than the median and 50 percent of workers earn more than the median. More about percentile wages.
(1) Estimates for detailed occupations do not sum to the totals because the totals include occupations not shown separately. Estimates do not include self-employed workers.
(2) Annual wages have been calculated by multiplying the hourly mean wage by a "year-round, full-time" hours figure of 2,080 hours; for those occupations where there is not an hourly wage published, the annual wage has been directly calculated from the reported survey data.
(3) The relative standard error (RSE) is a measure of the reliability of a survey statistic. The smaller the relative standard error, the more precise the estimate.
(8) Estimate not released.
(9) The location quotient is the ratio of the area concentration of occupational employment to the national average concentration. A location quotient greater than one indicates the occupation has a higher share of employment than average, and a location quotient less than one indicates the occupation is less prevalent in the area than average.
Other OEWS estimates and related information:
May 2022 National Occupational Employment and Wage Estimates
May 2022 State Occupational Employment and Wage Estimates
May 2022 Metropolitan and Nonmetropolitan Area Occupational Employment and Wage Estimates
May 2022 National Industry-Specific Occupational Employment and Wage Estimates
Last Modified Date: April 25, 2023